Fig. 5
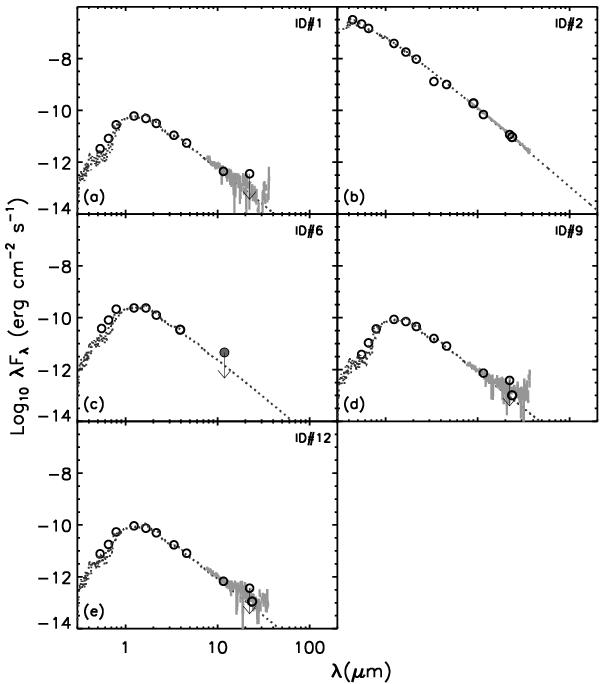
SEDs of apparently diskless stars. The photospheric emission level is indicated with a dotted curve in each panel. The circles show the photometry in different bands. The filled circle show the upper limit derived from our VLT/VISIR imaging for ID#6. The thick grey solid lines in panels a, b, d and e show the Spitzer/IRS spectra.
Current usage metrics show cumulative count of Article Views (full-text article views including HTML views, PDF and ePub downloads, according to the available data) and Abstracts Views on Vision4Press platform.
Data correspond to usage on the plateform after 2015. The current usage metrics is available 48-96 hours after online publication and is updated daily on week days.
Initial download of the metrics may take a while.