Free Access
Fig. 11
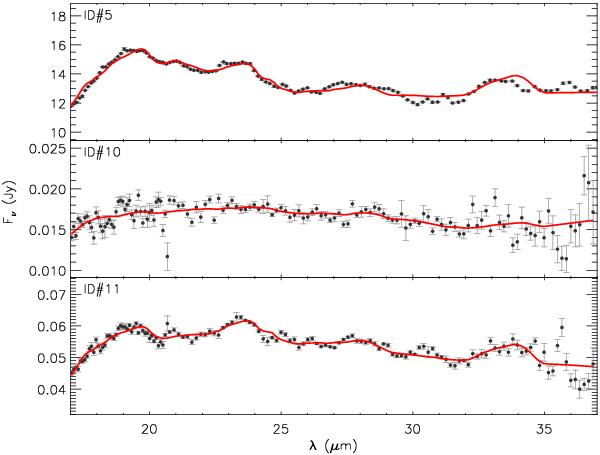
IRS spectra in the 17–37 μm range and spectral fits using the TLTD method. The observed spectra are represented as filled circles with the errors in grey, whereas the fits are shown in red.
Current usage metrics show cumulative count of Article Views (full-text article views including HTML views, PDF and ePub downloads, according to the available data) and Abstracts Views on Vision4Press platform.
Data correspond to usage on the plateform after 2015. The current usage metrics is available 48-96 hours after online publication and is updated daily on week days.
Initial download of the metrics may take a while.