Fig. 6
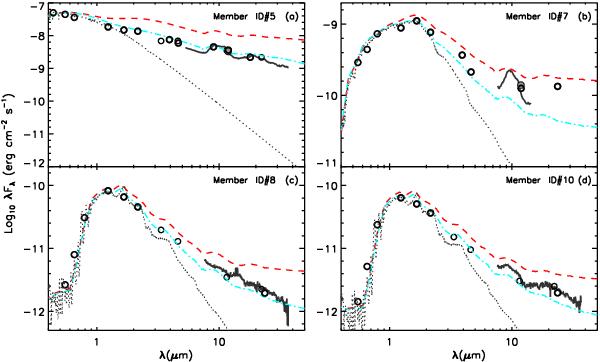
SEDs of the disk population in ϵ Cha. The photospheric emission level is indicated with a grey dotted curve in each panel. The circles show the photometry in various bands. The filled circles show the photometry from our VLT/VISIR imaging. The solid line shows the IRS spectrum in each panel. The dashed line in each panel represents the calculated SED of a flaring disk model, and the dash-dotted line shows the calculated SED of a flattened disk model.
Current usage metrics show cumulative count of Article Views (full-text article views including HTML views, PDF and ePub downloads, according to the available data) and Abstracts Views on Vision4Press platform.
Data correspond to usage on the plateform after 2015. The current usage metrics is available 48-96 hours after online publication and is updated daily on week days.
Initial download of the metrics may take a while.