| Issue |
A&A
Volume 536, December 2011
Planck early results
|
|
|---|---|---|
| Article Number | A9 | |
| Number of page(s) | 20 | |
| Section | Cosmology (including clusters of galaxies) | |
| DOI | https://doi.org/10.1051/0004-6361/201116460 | |
| Published online | 01 December 2011 | |
Planck early results. IX. XMM-Newton follow-up for validation of Planck cluster candidates⋆
1
Aalto University Metsähovi Radio Observatory,
Metsähovintie 114,
02540
Kylmälä,
Finland
2
Agenzia Spaziale Italiana Science Data Center,
c/o ESRIN, via Galileo
Galilei, Frascati, Italy
3
Astroparticule et Cosmologie, CNRS (UMR7164), Université
Denis Diderot Paris 7, Bâtiment Condorcet, 10 rue A. Domon et Léonie Duquet,
Paris,
France
4
Astrophysics Group, Cavendish Laboratory, University of
Cambridge, J J Thomson
Avenue, Cambridge
CB3 0HE,
UK
5
Atacama Large Millimeter/submillimeter Array, ALMA Santiago
Central Offices, Alonso de
Cordova 3107, Vitacura, Casilla
763 0355, Santiago,
Chile
6
CITA, University of Toronto, 60 St. George St., Toronto, ON
M5S 3H8,
Canada
7
CNRS, IRAP, 9 Av. colonel Roche, BP 44346, 31028
Toulouse Cedex 4,
France
e-mail: This email address is being protected from spambots. You need JavaScript enabled to view it.
8
California Institute of Technology,
Pasadena, California,
USA
9
Centre of Mathematics for Applications, University of
Oslo, Blindern,
Oslo,
Norway
10
Centro de Astrofísica, Universidade do Porto,
Rua das Estrelas,
4150-762
Porto,
Portugal
11
DAMTP, University of Cambridge, Centre for Mathematical
Sciences, Wilberforce
Road, Cambridge
CB3 0WA,
UK
12
DSM/Irfu/SPP, CEA-Saclay, 91191
Gif-sur-Yvette Cedex,
France
13
DTU Space, National Space Institute,
Juliane Mariesvej 30,
Copenhagen,
Denmark
14
Departamento de Física, Universidad de Oviedo,
Avda. Calvo Sotelo s/n,
Oviedo,
Spain
15
Department of Astronomy and Astrophysics, University of
Toronto, 50 Saint George
Street, Toronto, Ontario, Canada
16
Department of Physics & Astronomy, University of
British Columbia, 6224
Agricultural Road, Vancouver,
British Columbia,
Canada
17
Department of Physics and Astronomy, University of Southern
California, Los
Angeles, California, USA
18
Department of Physics and Astronomy, University of
Sussex, Brighton
BN1 9QH,
UK
19
Department of Physics, Gustaf Hällströmin katu 2a,
University of Helsinki, Helsinki, Finland
20
Department of Physics, Purdue University,
525 Northwestern Avenue,
West Lafayette,
Indiana,
USA
21
Department of Physics, University of
California, Berkeley, California, USA
22
Department of Physics, University of
California, One Shields
Avenue, Davis, California, USA
23
Department of Physics, University of
California, Santa
Barbara, California, USA
24
Department of Physics, University of Illinois at
Urbana-Champaign, 1110 West
Green Street, Urbana, Illinois, USA
25
Dipartimento di Fisica G. Galilei, Università degli Studi di
Padova, via Marzolo
8, 35131
Padova,
Italy
26
Dipartimento di Fisica, Università La
Sapienza, P. le A. Moro
2, Roma,
Italy
27
Dipartimento di Fisica, Università degli Studi
diMilano, via Celoria,
16, Milano,
Italy
28
Dipartimento di Fisica, Università degli Studi di
Trieste, via A. Valerio
2, Trieste,
Italy
29
Dipartimento di Fisica, Università di Ferrara,
via Saragat 1,
44122
Ferrara,
Italy
30
Dipartimento di Fisica, Università di Roma Tor
Vergata, via della Ricerca
Scientifica, 1, Roma, Italy
31
Discovery Center, Niels Bohr Institute,
Blegdamsvej
17, Copenhagen, Denmark
32
Dpto. Astrofísica, Universidad de La Laguna
(ULL), 38206
La Laguna, Tenerife,
Spain
33
European Southern Observatory, ESO Vitacura, Alonso de Cordova 3107, Vitacura, Casilla
19001, Santiago,
Chile
34
European Space Agency, ESAC, Camino bajo del
Castillo, s/n, Urbanización
Villafranca del Castillo, Villanueva de la Cañada,
Madrid,
Spain
35
European Space Agency, ESAC, Planck Science Office, Camino
bajo del Castillo, s/n,
Urbanización Villafranca del Castillo, Villanueva de la Cañada,
Madrid,
Spain
36
European Space Agency, ESTEC, Keplerlaan 1, 2201 AZ
Noordwijk, The
Netherlands
37
Helsinki Institute of Physics, Gustaf Hällströmin katu 2,
University of Helsinki, Helsinki, Finland
38
INAF – Osservatorio Astronomico di Padova,
Vicolo dell’Osservatorio 5,
Padova,
Italy
39
INAF – Osservatorio Astronomico di Roma,
via di Frascati 33,
Monte Porzio Catone,
Italy
40
INAF – Osservatorio Astronomico di Trieste,
via G.B. Tiepolo 11,
Trieste,
Italy
41
INAF/IASF Bologna, via Gobetti
101, Bologna,
Italy
42
INAF/IASF Milano, via E. Bassini 15, Milano, Italy
43
INRIA, Laboratoire de Recherche en Informatique, Université
Paris-Sud 11, Bâtiment
490, 91405
Orsay Cedex,
France
44
IPAG: Institut de Planétologie et d’Astrophysique de
Grenoble, Université Joseph Fourier, Grenoble 1 / CNRS-INSU, UMR
5274, 38041
Grenoble,
France
45
Imperial College London, Astrophysics group, Blackett
Laboratory, Prince Consort
Road, London,
SW7 2AZ,
UK
46
Infrared Processing and Analysis Center, California
Institute of Technology, Pasadena, CA
91125,
USA
47
Institut Néel, CNRS, Université Joseph Fourier Grenoble
I, 25 rue des
Martyrs, Grenoble, France
48
Institut d’Astrophysique Spatiale, CNRS (UMR8617) Université
Paris-Sud 11, Bâtiment
121, Orsay,
France
49
Institut d’Astrophysique de Paris, CNRS UMR7095, Université
Pierre & Marie Curie, 98 bis boulevard Arago, Paris, France
50
Institute of Astronomy and Astrophysics, Academia
Sinica, Taipei,
Taiwan
51
Institute of Astronomy, University of
Cambridge, Madingley
Road, Cambridge
CB3 0HA,
UK
52
Institute of Theoretical Astrophysics, University of
Oslo, Blindern,
Oslo,
Norway
53
Instituto de Astrofísica de Canarias,
C/Vía Láctea s/n,
La Laguna, Tenerife,
Spain
54
Instituto de Física de Cantabria (CSIC-Universidad de
Cantabria), Avda. de los
Castros s/n, Santander, Spain
55
Jet Propulsion Laboratory, California Institute of
Technology, 4800 Oak Grove
Drive, Pasadena, California, USA
56
Jodrell Bank Centre for Astrophysics, Alan Turing Building,
School of Physics and Astronomy, The University of Manchester,
Oxford Road, Manchester, M13 9PL,
UK
57
Kavli Institute for Cosmology Cambridge,
Madingley Road,
Cambridge, CB3 0HA,
UK
58
LERMA, CNRS, Observatoire de Paris,
61 Avenue de
l’Observatoire, Paris, France
59
Laboratoire AIM, IRFU/Service d’Astrophysique - CEA/DSM -
CNRS - Université Paris Diderot, Bât. 709, CEA-Saclay,
91191
Gif-sur-Yvette Cedex,
France
60
Laboratoire Traitement et Communication de l’Information,
CNRS (UMR 5141) and Télécom ParisTech, 46 rue Barrault, 75634
Paris Cedex 13,
France
61
Laboratoire de Physique Subatomique et de Cosmologie,
CNRS/IN2P3, Université Joseph Fourier Grenoble I, Institut National
Polytechnique de Grenoble, 53
rue des Martyrs, 38026
Grenoble Cedex,
France
62
Laboratoire de l’Accélérateur Linéaire, Université Paris-Sud
11, CNRS/IN2P3, Orsay, France
63
Lawrence Berkeley National Laboratory,
Berkeley,
California,
USA
64
Max-Planck-Institut für Astrophysik,
Karl-Schwarzschild-Str. 1,
85741
Garching,
Germany
65
Max-Planck-Institut für Extraterrestrische
Physik, Giessenbachstraße, 85748
Garching,
Germany
66
MilliLab, VTT Technical Research Centre of
Finland, Tietotie
3, Espoo,
Finland
67
National University of Ireland, Department of Experimental
Physics, Maynooth, Co.
Kildare, Ireland
68
Niels Bohr Institute, Blegdamsvej 17, Copenhagen,
Denmark
69
Observational Cosmology, Mail Stop 367-17, California
Institute of Technology, Pasadena, CA
91125,
USA
70
SISSA, Astrophysics Sector, via Bonomea 265, 34136, Trieste,
Italy
71
SUPA, Institute for Astronomy, University of Edinburgh,
Royal Observatory, Blackford
Hill, Edinburgh
EH9 3HJ,
UK
72
School of Physics and Astronomy, Cardiff
University, Queens Buildings,
The Parade, Cardiff, CF24
3AA, UK
73
Space Research Institute (IKI), Russian Academy of
Sciences, Profsoyuznaya Str,
84/32, Moscow
117997,
Russia
74
Space Sciences Laboratory, University of
California, Berkeley, California, USA
75
Stanford University, Dept of Physics, Varian Physics
Bldg, 382 via Pueblo
Mall, Stanford, California, USA
76
Tartu Observatory, Toravere, Tartumaa 61602, Estonia
77
Tuorla Observatory, Department of Physics and Astronomy,
University of Turku, Väisäläntie 20, 21500
Piikkiö,
Finland
78
Universität Heidelberg, Institut für Theoretische
Astrophysik, Albert-Überle-Str. 2, 69120
Heidelberg,
Germany
79
Université de Toulouse, UPS-OMP, IRAP, 31028
Toulouse Cedex 4,
France
80
University of Granada, Departamento de Física Teórica y del
Cosmos, Facultad de Ciencias, Granada, Spain
81
University of Miami, Knight Physics Building, 1320 Campo Sano
Dr., Coral
Gables, Florida, USA
82
Warsaw University Observatory, Aleje Ujazdowskie 4, 00-478
Warszawa,
Poland
Received:
7
January
2011
Accepted:
2
July
2011
Abstract
We present the XMM-Newton follow-up for confirmation of Planck cluster candidates. Twenty-five candidates have been observed to date using snapshot (~10ks) exposures, ten as part of a pilot programme to sample a low range of signal-to-noise ratios (4 < S/N < 6), and a further 15 in a programme to observe a sample of S/N > 5 candidates. The sensitivity and spatial resolution of XMM-Newton allows unambiguous discrimination between clusters and false candidates. The 4 false candidates have S/N ≤ 4.1. A total of 21 candidates are confirmed as extended X-ray sources. Seventeen are single clusters, the majority of which are found to have highly irregular and disturbed morphologies (about ~70%). The remaining four sources are multiple systems, including the unexpected discovery of a supercluster at z = 0.45. For 20 sources we are able to derive a redshift estimate from the X-ray Fe K line (albeit of variable quality). The new clusters span the redshift range 0.09 ≲ z ≲ 0.54, with a median redshift of z ~ 0.37. A first determination is made of their X-ray properties including the characteristic size, which is used to improve the estimate of the SZ Compton parameter, Y500. The follow-up validation programme has helped to optimise the Planck candidate selection process. It has also provided a preview of the X-ray properties of these newly-discovered clusters, allowing comparison with their SZ properties, and to the X-ray and SZ properties of known clusters observed in the Planck survey. Our results suggest that Planck may have started to reveal a non-negligible population of massive dynamically perturbed objects that is under-represented in X-ray surveys. However, despite their particular properties, these new clusters appear to follow the Y500–YX relation established for X-ray selected objects, where YX is the product of the gas mass and temperature.
Key words: cosmology: observations / galaxies: clusters: general / galaxies: clusters: intracluster medium / cosmic background radiation / X-rays: galaxies: clusters
Corresponding author: E. Pointecouteau, e-mail: This email address is being protected from spambots. You need JavaScript enabled to view it.
© ESO, 2011
1. Introduction
The Planck1 satellite has been surveying the sky across nine frequencies in the microwave band since August 2009. The resulting data set allows the detection of galaxy clusters through the Sunyaev-Zeldovich (SZ) effect (Sunyaev & Zeldovich 1972), the spectral distortion of the cosmic microwave background (CMB) generated via inverse Compton scattering of CMB photons by the hot electrons in the intra-cluster medium (ICM). The total SZ signal is expected to be closely related to the cluster mass (e.g., da Silva et al. 2004) and its brightness is insensitive to redshift dimming. As a result, SZ surveys can potentially provide unbiased cluster samples, covering a wide range of redshifts, that are expected to be close to mass-selected. As compared to other SZ instruments, Planck brings a unique nine-band coverage from 30 to 857 GHz and a relatively high, band-dependent spatial resolution of 5–10 arcmin. Most crucially, the Planck SZ survey covers an exceptionally large volume, being the first all-sky survey capable of blindly detecting clusters since the ROSAT All-Sky Survey (RASS) in the X-ray domain. As a consequence, Planck is detecting previously unknown, massive clusters that do not appear in other SZ surveys. Its all-sky coverage allows detection of the rarest clusters, the most massive objects lying in the exponential tail of the mass function. These are the best clusters for precision cosmology: their abundance evolution is the most sensitive to the cosmological parameters (Voit 2005), and their gas mass fractions can be used as distance indicators (Allen et al. 2008). In addition, clusters in this high-mass regime are X-ray bright, making their observation easier, and their ICM is expected to be the least affected by non-gravitational processes. These newly-discovered Planck clusters will thus also be ideal targets for studying the physics of the gravitational collapse that drives all cluster formation.
The Planck survey is providing a sample of cluster candidates. Any such survey sample is expected to include a fraction of false detections, due for example to fluctuations in the complex microwave astrophysical sky. In addition, as a result of Planck’s moderate spatial resolution at SZ frequencies with respect to typical cluster sizes, a Planck cluster candidate SZ measurement essentially provides only coordinates and total SZ flux estimates; these estimates are further hampered by the flux-size degeneracy discussed extensively in Planck Collaboration (2011d). A vigourous follow-up programme is therefore required to scientifically exploit Planck cluster candidate data. Such a programme includes candidate confirmation, which is the final part of the catalogue validation, in addition to redshift measurements, estimation of relevant physical parameters (including cluster size, allowing precise SZ flux estimates), and investigation of scaling properties. In particular, measurement of the relation between the SZ “luminosity” and the mass as a function of redshift, z, is essential for calculation of the survey selection function and for related cosmological applications.
The all-sky nature of the Planck survey means that confirmation and redshift measurement of cluster candidates is not a trivial task. In the optical domain, the only publicly available large survey is the Sloan Digital Sky Survey (SDSS)2. Although cross-correlation with this survey can be used to confirm candidates up to z ~ 0.6, it covers only part of the northern sky. Furthermore, optical confirmation is hampered by the relatively large Planck source position uncertainty, which can be up to 5′ (Planck Collaboration 2011d). To discriminate between a true counterpart and a chance association with low-mass systems at various redshifts within the Planck error box, optical mass and spectroscopic redshift or photometric redshift estimates with a wide-field, multi-band, instrument are required.
In contrast, confirmation in X-rays offers definite advantages. Above the Galactic Plane, the detection of extended X-ray emission is an unambiguous signature of a cluster, and the density-squared dependence of the X-ray emission reduces projection effects nearly to zero. Furthermore, the low space density of groups and clusters in a typical X-ray exposure makes spurious association with a Planck candidate unlikely. For instance, the XMM-LSS survey found 29 systems in 5 deg2 using 10 ks XMM-Newton exposures (Pacaud et al. 2007). Such a detection rate corresponds to only a 10 per cent probability of finding a cluster by chance within a 5′ aperture, the conservative Planck error box. Finally, as both X-ray and SZ observations probe the same medium, spurious associations can be readily assessed from a consistency check between the X-ray and SZ flux, assuming a reasonable redshift range (as illustrated in Sect. 3.2).
In this context, and because of its superior sensitivity, XMM-Newton (Jansen et al. 2001) is the best instrument for following up newly-detected Planck clusters up to high redshift. A short snapshot XMM-Newton exposure is sufficient to confirm any Planck cluster candidate at least up to z = 1.5 (Sect. 2.4), and for the X-ray brightest objects, provides the source redshift from the iron K line (Sect. 4.1). Because of their high mass, clusters are expected to be larger than 1′ and the XMM-Newton spatial resolution is sufficient to discriminate between a point source and extended emission.
In order to assess the galaxy cluster nature of the Planck SZ sources and to help guarantee the integrity of the final Planck SZ legacy catalogue to be released in 2012, we have thus proposed to use XMM-Newton to confirm the highest significance cluster candidates discovered by Planck. This validation programme consists of snapshot (~10ks) observations and is undertaken via an agreement between the ESA XMM-Newton and Planck project scientists. In this paper we present the definition and results of this programme. To date, 25 Planck SZ sources have been observed, making use of XMM-Newton Director’s Discretionary Time. Of these, 21 sources have been confirmed. In compliance with Planck policies for follow-up, the XMM-Newton data of the 25 Planck sources are made public along with the publication of the Early Release Compact Source Catalogue (ERCSC).
The XMM-Newton follow-up for validation is the backbone of a larger programme for the confirmation and redshift measurement of Planck SZ cluster candidates. The Planck collaboration has also been granted time on the following facilities: the ENO, the ESO/MPG 2.2m and the Palomar telescopes. Observations with these facilities are ongoing or being processed. Some optical results from the ENO observations are presented together with the XMM-Newton results in this paper (Sects. 4.2 and A.1). Other early astrophysics results on clusters of galaxies are presented in Planck Collaboration (2011d,f,g,h).
We adopt a ΛCDM cosmology with
H0 = 70 kms-1Mpc-1, ΩM = 0.3
and ΩΛ = 0.7. The factor 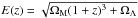 is the ratio of the Hubble constant at redshift z to its present day value.
The quantities M500 and R500 are the
total mass and radius corresponding to a total density contrast δ = 500, as
compared to ρc(z), the critical density of the
Universe at the cluster redshift; thus
is the ratio of the Hubble constant at redshift z to its present day value.
The quantities M500 and R500 are the
total mass and radius corresponding to a total density contrast δ = 500, as
compared to ρc(z), the critical density of the
Universe at the cluster redshift; thus  . The quantity
YX is defined as the product of
Mg,500, the gas mass within R500,
and TX, the spectroscopic temperature measured in the
[0.15–0.75] R500 aperture. The SZ signal is
characterised by Y500 throughout. This quantity is defined as
. The quantity
YX is defined as the product of
Mg,500, the gas mass within R500,
and TX, the spectroscopic temperature measured in the
[0.15–0.75] R500 aperture. The SZ signal is
characterised by Y500 throughout. This quantity is defined as
 . Here
DA is the angular-diameter distance to the system,
σT is the Thomson cross-section, c is the
speed of light, me is the electron rest mass;
P = neT is the pressure, the
product of the electron number density and temperature, and the integration is performed
over a sphere of radius R500. The quantity
. Here
DA is the angular-diameter distance to the system,
σT is the Thomson cross-section, c is the
speed of light, me is the electron rest mass;
P = neT is the pressure, the
product of the electron number density and temperature, and the integration is performed
over a sphere of radius R500. The quantity
 is the
spherically integrated Compton parameter and Y500 is
proportional to the apparent magnitude of the SZ signal from within
R500.
is the
spherically integrated Compton parameter and Y500 is
proportional to the apparent magnitude of the SZ signal from within
R500.
2. The XMM-Newton validation follow-up of Planck cluster candidates
2.1. The Planck survey
Planck (Tauber et al. 2010; Planck Collaboration 2011a) is the third generation space mission to measure the anisotropy of the CMB. It observes the sky in nine frequency bands covering 30–857GHz with high sensitivity and angular resolution from 31′ to 5′. The Low Frequency Instrument (LFI; Mandolesi et al. 2010; Bersanelli et al. 2010; Mennella et al. 2011 covers the 30, 44, and 70GHz bands with amplifiers cooled to 20K. The High Frequency Instrument (HFI; Lamarre et al. 2010; Planck HFI Core Team 2011a) covers the 100, 143, 217, 353, 545, and 857GHz bands with bolometers cooled to 0.1K. Polarisation is measured in all but the highest two bands (Leahy et al. 2010; Rosset et al. 2010). A combination of radiative cooling and three mechanical coolers produces the temperatures needed for the detectors and optics (Planck Collaboration 2011b). Two data processing centres (DPCs) check and calibrate the data and make maps of the sky (Planck HFI Core Team 2011b; Zacchei et al. 2011). Planck’s sensitivity, angular resolution, and frequency coverage make it a powerful instrument for Galactic and extragalactic astrophysics as well as cosmology. Early astrophysics results are given in Planck Collaboration (2011h–z).
2.2. Blind detection of SZ clusters in Planck
The blind search for clusters in Planck data relies on a multi-matched filter (MMF) approach (Melin et al. 2006)3. This detection algorithm operates on all-sky maps divided into a set of overlapping square patches, using simultaneously the 6 frequency maps of the HFI instrument (Planck Collaboration 2011d). Within the algorithm, the SZ spectral signature and the universal pressure profile derived by Arnaud et al. (2010) are used as spectral and spatial templates, respectively. In such a blind search, the position, the characteristic scale of the profile (∝ R500) and the amplitude (∝ Y500) are left free, being optimised by the MMF algorithm. In practice the algorithm is run in an iterative way: after a first detection run to locate candidates, consecutive runs on sky patches centred on the candidate positions refine the estimated signal-to-noise ratio (S/N) and other properties.
Cluster candidates then undergo a validation process, extensively described in Planck Collaboration (2011d). This process includes internal quality checks (e.g., map artefacts, cross-comparison between detection algorithms, SZ spectral signature, astrophysical contamination by Galactic dust, point sources or structures in the CMB) and cross-correlation with ancillary data and catalogues allowing known clusters to be identified. This process produces a list of new Planck SZ cluster candidates above a given S/N threshold (S/N = 4 in this work).
Observation log of the XMM-Newton validation follow-up.
2.3. XMM-Newton target selection
From the list of new potential clusters detected as SZ sources in the Planck survey, we selected 25 targets in a two step process:
-
1.
Pilot programme: 10 targets were selected on the basis of thePlanck survey as it stood at the end of October2009, i.e., ~62% sky coverage. These targets were explicitly chosen tosample the lower range of signal-to-noise (4 < S/N < 6) in order to bettercharacterise the nature and quality of the SZ signal.
-
2.
High S/N programme: a further 15 targets were chosen in the spring of 2010 when the first full-sky coverage was close to completion (99.5% sky coverage). In contrast to the pilot programme, here we focused on high-significance SZ sources (S/N > 5) and selected candidates starting from the highest S/N.
In both cases the selection process was intimately linked to the Planck-HFI data time ordered information processing status, calibration, attitude and map versions (as of Dec. 7, 2009 and April 19, 2010 for the two programmes, respectively). The choice of targets was also constrained by their XMM-Newton visibility in a period of 2–3 months following their submission to the science operations centre. For both programmes, maps and spectra of each potential target were visually inspected, including reprocessing with aperture photometry methods. Cross-correlation with the RASS Bright Source Catalogue (RASS-BSC, Voges et al. 1999) and Faint Source Catalogue (RASS-FSC, Voges et al. 2000) was undertaken. For the two targets of the pilot programme falling in the SDSS area, we ran a dedicated algorithm to search for galaxy overdensities (Fromenteau et al., in prep.), allowing us to track significant concentrations of matter down to z ~ 0.6. These two targets were chosen to test the SDSS based confirmation at high z. The first candidate, PLCK G070.8-21.5, was not confirmed (see Fromenteau et al., in prep., for discussion); the other candidate, PLCK G214.6+37.0, is discussed in Sect. 7.2.1. Detailed searches in XMM-Newton, Chandra and Suzaku observatory logs were also undertaken in order to avoid duplication of performed or accepted observations with similar facilities.
Six of the ten pilot programme targets were confirmed (see Table 1); two of these are multiple systems. Taking into account the result of the pilot project, for the second programme we set a lower S/N threshold of S/N = 5 and refined and strengthened the selection criteria. In particular, we required that the source be independently detected by at least two of the three blind detection methods, and more quality flags were considered. The internal checks were very similar to those defined for constructing the early SZ (ESZ) sample (Planck Collaboration 2011d), which benefit from the result of the XMM-Newton Pilot programme. We also performed a search for emission in the RASS hard band images, looking for X-ray signatures beyond those recorded in the RASS source catalogues. However, RASS information never took precedence over the internal Planck quality flags. Note that two of the false candidates of the Pilot programme (PLCK G343.4–43.4 and PLCK G226.1–16.9) were associated with a RASS-FSC source that XMM-Newton subsequently revealed to be several point sources (see Sect. 3.2). Thus association with an RASS source alone is not sufficient for cluster candidate confirmation.
The ESZ sample (Planck Collaboration 2011d) consists of a high signal-to-noise, i.e. primarily S/N ≥ 6, list of 189 clusters and cluster candidates based on data from the first 10 months of the Planck survey. Ten of the 21 objects presented in the present paper passed the S/N ESZ selection criteria and are thus part of the ESZ sample released to the community in January 2011. The original S/N of their detection in the Planck maps is given in Table 1, whereas the S/N values provided in Table 2 are derived from the 10 month Planck maps on the basis of which the ESZ sample was constructed.
2.4. Observation setup
As discussed by Scharf (2002), the optimum energy
band for XMM-Newton cluster detection is the soft energy band (energy
below 2 keV), for which the signal-to-noise ratio reaches a maximum. We calculated
expectations for XMM-Newton sensitivity in that band for two
representative values of the SZ flux from within R500:
Y500 = 5 × 10⁻⁴ arcmin-2 and
Y500 = 2 × 10⁻³ arcmin-2. In each
case, the expected cluster luminosity L500 for various
redshifts was estimated using the
L500– relation of Arnaud et al. (2010), assuming self-similar evolution.
We then derived the corresponding total XMM-Newton count rates,
R, in the [0.3−2] keV band for the epic MOS–CCD (herafter
emos) and pn–CCD (herafter epn) camera (Turner et al. 2001; Strüder et al.
2001). We used the xspec software (Arnaud
1996) to simulate an absorbed thermal model (assuming kT = 7keV,
NH = 2 × 1020 cm-2), convolved with
the instrument response. The corresponding angular extent θ500
was estimated from the L500–M500
relation of Pratt et al. (2009). The
signal–to–noise ratio of the detection is then given by
relation of Arnaud et al. (2010), assuming self-similar evolution.
We then derived the corresponding total XMM-Newton count rates,
R, in the [0.3−2] keV band for the epic MOS–CCD (herafter
emos) and pn–CCD (herafter epn) camera (Turner et al. 2001; Strüder et al.
2001). We used the xspec software (Arnaud
1996) to simulate an absorbed thermal model (assuming kT = 7keV,
NH = 2 × 1020 cm-2), convolved with
the instrument response. The corresponding angular extent θ500
was estimated from the L500–M500
relation of Pratt et al. (2009). The
signal–to–noise ratio of the detection is then given by
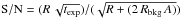 , where
texp is the exposure time, Rbkg
is the background count rate, and
, where
texp is the exposure time, Rbkg
is the background count rate, and  is the
integration area in square arc minutes. We assumed a [0.3–2] keV band background count
rate of
Rbkg = 4.5 × 10⁻³ countss-1 arcmin-2,
as estimated from the blank sky backgrounds of Read
& Ponman (2003). Figure 1 shows the
resulting S/N of an XMM-Newton detection as a function of redshift.
is the
integration area in square arc minutes. We assumed a [0.3–2] keV band background count
rate of
Rbkg = 4.5 × 10⁻³ countss-1 arcmin-2,
as estimated from the blank sky backgrounds of Read
& Ponman (2003). Figure 1 shows the
resulting S/N of an XMM-Newton detection as a function of redshift.
Since the goal of the XMM-Newton observations is confirmation of new Planck SZ cluster candidates, the nominal observing time was set to 10 ks (net epn camera time) per target. Such a snapshot observation is sufficient to detect the cluster – if real – at better than 10σ up to z = 1.5 (Fig. 1). The nominal setup used the THIN filters (unless optical loading had to be avoided) and EFF mode for the epn camera. The boresight was optimised to avoid camera gaps.
2.5. XMM-Newton data reduction
We produced calibrated event lists using v10.0 of the XMM-Newton science analysis system (SAS). Observations were cleaned for periods of high background due to soft proton flares, pattern-selected and corrected for vignetting as described in Pratt et al. (2007). Point sources were identified from the small scales of wavelet-decomposed images in the [0.3–2] and [2−5] keV bands. These sources were excluded in the analysis of confirmed clusters, with the exclusion radius matched to the point spread function (PSF) size (which varies across the detector).
Above ~2 keV the XMM-Newton background is dominated by particle events. We subtracted this background using a stacked event list built from observations obtained with the filter wheel in the closed position, recast to the pointing position and renormalised using the count rate in the high energy band free of cluster emission. The remaining background (due to the cosmic X-ray background of unresolved AGN and Galactic emission) was estimated from the particle-background subtracted emission from an annulus beyond the cluster emission. For the spectral analysis, we modeled this background emission as arising from two thermal sources and a power-law source with index Γ = 1.4, taking into account the absorbing Galactic column density in the direction of the object (see, e.g., De Luca & Molendi 2004).
As Table 1 shows, the observations are of variable quality. In three cases the epn data were completely contaminated by soft proton flares and formally had no useful observing time. For two of these observations, the emos data were completely contaminated too. In these instances, we used emos data only (uncleaned in the last two cases). The power-law index in the background model was left free, which empirically produces a relatively good fit to the background spectrum. The spectroscopic results for these objects should be treated with caution.
Spectral fits were undertaken in the [0.3–10] keV energy range, after binning the spectra to a minimum of 25 counts per bin and excluding background fluorescence line regions. The cluster component was modelled with an absorbed mekal model with the reference solar abundances from the data of Anders & Grevesse (1989). The hydrogen column density NH was fixed at the 21 cm value from Dickey & Lockman (1990), except for PLCK G286.3−38.4, PLCK G308.3−20.2 and PLCK G018.7+23.6. Their best fit NH values were found to be significantly higher by a factor 1.8, 1.8 and 2.4, respectively. These clusters are located at low latitude, in regions of high IR dust emission (Snowden et al. 1997, Fig. 11). The 21 cm value may underestimate the total NH, measured from X-ray data, due to a non-negligible H2 contribution. To check this hypothesis, we used the IRIS maps (Miville-Deschênes & Lagache 2005) as tracers of the dust emission and the correlation between the Galactic dust emission and the total hydrogen column density (Boulanger et al. 1996) to estimate the NH values at the cluster locations (see Pointecouteau et al. 2004). A better agreement was found with X-ray values, with ratios of 1.30, 1.06 and 1.48. It must also be noted that the PLCK G286.3−38.4 observation is highly contaminated by solar flares and only emos data are used. Some residual background may also affect the low energy part of the spectrum and thus the NH estimate
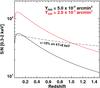 |
Fig.1 Sensitivity of XMM-Newton observations to typical Planck SZ sources. The expected signal-to-noise ratio (S/N) of the cluster detection in the [0.3–2] keV energy band with the epic camera is plotted as a function of redshift for an exposure time of 10 ks assuming two typical SZ fluxes. See text for details of the model assumed to convert SZ to X-ray flux and count rate. The dash-dotted line indicates the S/N required for 10% uncertainty on the temperature measurement of an 8 keV cluster. |
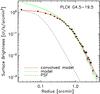 |
Fig.2 Surface brightness profile of PLCK G4.5-19.5 at z = 0.54, the highest-z cluster of the sample, as measured with XMM-Newton. The data of the emos12 and epn camera in the [0.3–2.] keV energy band are combined. The green line indicates the best fitting model (see text); the red line is the best fitting model convolved with the point spread function (PSF) of XMM-Newton and the dashed line is the on axis XMM/PSF, normalised to the central intensity. The source is clearly extended. |
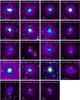 |
Fig.3 XMM-Newton images of all confirmed cluster candidates, except for the two triple systems which are shown on Fig. 12 and discussed in Sect. 7, in the [0.3–2] keV energy band. The observations of PLCK G272.9+48.8 and PLCK G250.0+24.1 suffer from high background that has only been crudely subtracted. Image sizes are 3θ500 on a side, where θ500 is estimated from the M500–YX relation (see Sect. 5.1). Images are corrected for surface brightness dimming with z, divided by the emissivity in the energy band, taking into account galactic absorption and instrument response, and scaled according to the self-similar model. The colour table is the same for all clusters, so that the images would be identical if clusters obeyed strict self-similarity. The majority of the objects show evidence for significant morphological disturbance. A yellow cross indicates the Planck position and a red/green plus sign the position of a RASS-BSC/FSC source. |
3. XMM-Newton validation: methods and outcome
The observations were completed by the end of October 2010. The median clean epn observation time is 7 ks (Table 1). Of 25 targets, 21 are confirmed as X-ray extended sources. Only four targets with S/N ≤ 4.1 were not confirmed. The confirmation status of each XMM-Newton observation is given in Table 1.
3.1. Confirmed cluster candidates
Our procedure for candidate cluster confirmation consists of identifying an extended X-ray source coincident with the Planck SZ source and checking that the SZ and X-ray properties are consistent. Generally, a candidate cluster (or supercluster) is clearly visible within 5′ of the Planck candidate position, in which case we simply have to confirm the X-ray source extent. This is achieved by comparing the surface brightness profile extracted in the [0.3–2.0] keV band with the XMM-Newton PSF. A typical cluster β-model with a cusp (Eq. (2) in Pratt & Arnaud 2002) is also fitted to the data. Figure 2 shows this comparison for the highest-z confirmed extended source.
17 systems show extended emission from a single source and are confirmed as new clusters of galaxies. Using the Fe K line in the X-ray spectrum we have estimated a redshift for all these objects, albeit with large uncertainties in some cases (see Sect. 4.1). We have also calculated the YX parameter (Sect. 5.1). A final check of the candidate confirmation is the good agreement found between the measured SZ signal and that expected from the YX value (Sect. 5.1). A further two confirmed candidates were revealed to be double systems, one of which is a projection of two independent clusters at different redshifts. More unexpected are two additional newly-discovered triple systems. All of the confirmed candidates revealed by XMM-Newton to be multiple clusters are discussed in more detail in Sect. 7.
The XMM-Newton images of confirmed single and double systems are shown in Fig. 3. In each panel, the Planck source centre position is marked with a cross; in addition, when relevant a red/green plus sign shows the associated RASS-FSC/BSC source.
3.2. False cluster candidates
In some cases a source is not clearly visible in the image and then the relatively large
FWHMs of the HFI beams (~ ; Planck HFI Core Team 2011b) complicate source search and confirmation.
For these observations we employ the approach described in Šuhada et al. (2010), applying the XMM-Newton–SAS source
detection algorithms eboxdetect and emldetect to the images to determine whether an
extended source lies within the Planck beam. In brief, images are
produced in the [0.35–2.4] keV band and eboxdetect is first run in local mode, where
the background is estimated locally for each source. Sources found in this first step are
then excised, leaving an image suitable for background estimation. The background image is
modeled with two components, a vignetted component to represent the X-ray background, and
a non-vignetted component to represent the particle and instrumental background. The model
is based on a linear combination of two templates based on vignetted and non-vignetted
exposure maps, and is fit to the source-subtracted image. We then re-run eboxdetect with
this model background. All sources found in this step are then analysed with the maximum
likelihood (ML) task emldetect, that analyses each source by fitting with a 2D King
function convolved with the PSF. The log of the detection likelihood of each source as
defined in the code is
; Planck HFI Core Team 2011b) complicate source search and confirmation.
For these observations we employ the approach described in Šuhada et al. (2010), applying the XMM-Newton–SAS source
detection algorithms eboxdetect and emldetect to the images to determine whether an
extended source lies within the Planck beam. In brief, images are
produced in the [0.35–2.4] keV band and eboxdetect is first run in local mode, where
the background is estimated locally for each source. Sources found in this first step are
then excised, leaving an image suitable for background estimation. The background image is
modeled with two components, a vignetted component to represent the X-ray background, and
a non-vignetted component to represent the particle and instrumental background. The model
is based on a linear combination of two templates based on vignetted and non-vignetted
exposure maps, and is fit to the source-subtracted image. We then re-run eboxdetect with
this model background. All sources found in this step are then analysed with the maximum
likelihood (ML) task emldetect, that analyses each source by fitting with a 2D King
function convolved with the PSF. The log of the detection likelihood of each source as
defined in the code is
 , where the latter
is the probability of the observed counts arising from Poisson fluctuations. We set the
minimum
, where the latter
is the probability of the observed counts arising from Poisson fluctuations. We set the
minimum
 , corresponding to a
≳ 3σ detection4. In addition to
the above, we also searched for possible extended sources using visual inspection of a
wavelet-smoothed image.
, corresponding to a
≳ 3σ detection4. In addition to
the above, we also searched for possible extended sources using visual inspection of a
wavelet-smoothed image.
Figure 4 illustrates application of the method for the false source PLCK G226.1−16.9. This candidate was the lowest S/N candidate of the Pilot sample (S/N = 4.0) and located close to a RASS-FSC source, which may have been the cluster counterpart. The top panel shows the raw XMM-Newton image and the reconstructed epn ML source image. The RASS-FSC source located at 0.8′ from the Planck source is clearly detected with XMM-Newton (red plus sign in the top panels). The surface brightness profile is well fitted by a point source convolved with the XMM-Newton PSF (bottom left panel). The source spectrum is clearly a power law, and thermal emission from a 0.3 solar abundance ICM is rejected at high confidence at all redshifts and temperatures. This source is most likely an AGN and is definitively not the Planck counterpart.
The source list produced by the ML method includes two potentially extended sources, only one of which is within 5′ of the Planck source position (source labelled A in the figure). It is located ~0.8′ from the RASS-FSC source position and is much fainter, showing the capability of XMM-Newton to separate sources. The source has an estimated [0.35–2.4] keV flux of ~2 × 10-14ergcm2s-1, which is more than 5 times lower than that expected from the SZ source even if located at z ~ 1.5. Furthermore its extent (although not well constrained) is small and it is perfectly coincident with a 2MASS galaxy. This source again could not be the Planck counterpart. Finally, from a wavelet-smoothed image, there was a hint that another source, located 3.5′ away from the Planck candidate position, was extended, although it was not classified as such with the ML method (source labelled B). We extracted its profile and confirmed it as extended, although the extent was not very significant (bottom right panel of Fig. 4). However, its flux was half that expected from the observed Planck flux, even for a cluster at z = 1.5. Nevertheless, in view of possible errors in the Planck position, we re-analysed the Planck data by re-extracting the signal exactly at the position of the source. The SZ detection was no longer significant, leading us to conclude that source B was definitively not the counterpart to the Planck candidate. From the XMM-Newton observation we thus concluded that this Planck candidate was a false detection.
4. Redshift estimate
4.1. XMM-Newton estimates
The ICM has a typical abundance of 0.3 times solar, implying that metals are present in large amounts (see Balestra et al. 2007; Leccardi & Molendi 2008; Maughan et al. 2008, for recent work on metals in the cluster context). The spectroscopic sensitivity of XMM-Newton allows the measurement of the intensity and centroid energy of the strongest line emission, namely the Fe K and Fe L line complexes (respectively found at E ~ 6.4 and E ~ 1 keV at z = 0). As a consequence the Fe line emission can be used to constrain the cluster redshift. We have thus searched for their signature in the XMM-Newton observations, focusing mainly on the Fe K complex, which is about 10 times as strong as any other line emission in the ICM. A clear detection then provides an estimate of the X-ray redshift zFe.
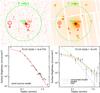 |
Fig.4 Illustration of the XMM-Newton validation procedure results for a false candidate, PLCK G226.1−16.9. Top panels: sum of the emos and epn raw image (left) and reconstructed epn image (right) in the soft band. The circle of 5′ radius centred on the Planck position (green cross) corresponds to the conservative position error box. The RASS-FSC source is clearly detected (red cross) as a point source: its surface brightness profile (black points in left bottom panel) is well fitted by the XMM-Newton PSF (red line). Two extended sources labelled A and B are also detected. Bottom right panel: same as Fig. 2 for source B. |
The intrinsic spectral resolution of XMM-Newton is ΔE ~ 150 eV at 6.4 keV and ΔE ~ 100 eV at 3.2 keV; the energies here correspond to the Fe K complex centroid energy for a cluster at a redshift of z = 0 and z = 1, respectively. Such resolution allows centroid determination to typically 10–15eV for high quality spectra, of the same magnitude as the systematic uncertainty of the calibration of the energy reconstruction (about 5eV and 10eV in the central CCD of the emos and epn camera, respectively). The overall energy uncertainty would yield a typical corresponding redshift uncertainty of Δz ~ 0.002. In practice, the limiting factor affecting the accuracy of the redshift determination is the statistical uncertainty in the spectrum, which is linked to the observation duration and overall quality (background conditions). Furthermore, Planck-detected clusters are mostly massive, hot objects with low Fe K line equivalent widths (Rothenflug & Arnaud 1985). This makes zFe determination more difficult than for cooler objects.
X-ray and SZ properties of the confirmed Planck sources.
To estimate zFe using xspec we first performed a spectral fit of the region corresponding to the maximum significance of the detection (defined from the surface brightness profile in the soft band), with the redshift as one of the free parameters. The abundance was left free to fit within a typical cluster range (0.2–0.6 times solar). From this starting point we investigated the χ2 in the kT–zFe plane using a regular grid. The best fitting kT and zFe values were recovered from a simple maximum likelihood analysis, whereupon these best fitting values were used as input for a final spectral fit. When a two- or three-peak degeneracy appeared in the kT–zFe plane, we checked the various potential zFe values and chose the redshift giving the best spectral fit as defined by the χ2 and the null probability hypothesis.
This redshift estimation process is illustrated by three cases in Fig. 5 with the left panel showing a fully degenerate case, the middle panel a double-peaked case and the right panel a well-constrained case. These redshifts are flagged with quality values Qz = 0,1,2, respectively, in Table 2. The few cases where no redshift estimate was possible are flagged with Qz = −1.
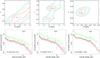 |
Fig.5 Top row: redshift determination from XMM-Newton spectroscopy in the kT-z plane. Red, green and blue contours trace 68, 95 and 99.9 percent confidence levels, respectively. The black error point shows the final best-fitting spectral results with associated statistical errors. Bottom row: epicemos12 (red and black points) and epn (green points) spectra. Only the data points above 2keV are shown for clarity but data down to 0.3keV are used in the spectral fitting. The line is the thermal model for the best-fitting redshift. The position of the redshifted Fe K line is marked. From left to right the figures are for sources PLCK G100.2−30.4, PLCK G277.8−51.7 and PLCK G241.2−28.7. |
4.2. Optical estimates
For three clusters, we have estimated the redshift either from existing optical archive observations or dedicated follow-up observations as part of the overall Planck cluster candidate validation programme. The most recent corresponds to telescope time acquired by the Planck consortium at the ENO telescopes, Observatorio del Teide (Tenerife, Spain – AO 2010A and 2010B). The details of the observation setup and data processing can be found in Appendix A.1.
-
PLCK G100.2−30.4. The source was observed in 4bands (griz) with the CAMELOT camera at the 0.82-m IAC80telescope. After data reduction, we derived a photometric redshiftof zphot = 0.38 ± 0.04, using the bpz code (Benítez 2000). This estimateis compatible within 3σ, with the zFe = 0.31 derived from the X-rayspectroscopy.
-
PLCK G285.0−23.7. We reduced the ESO NTT/SUSI2 archive images for this object, deriving a red-sequence redshift of zphot = 0.37. This estimate is in good agreement with the X-ray spectroscopic redshift zFe = 0.39.
-
PLCK286.3−38.4. ESO NTT/SUSI2 images and NTT/EMMI spectroscopic archive data targetting the X-ray source RXJ0359.1−7205 were available. From a poor quality NTT/EMMI spectrum, we extracted a redshift of zspec = 0.307 ± 0.003, backed-up by the presence of two absorption line features (Hβ and Mgi). Again this value agrees well with the X-ray spectroscopic redshift of zFe = 0.31.
Finally, the source PLCK G262.7−40.9 appeared to be one of the ACT SZ optically-confirmed clusters (Menanteau et al. 2010), accepted for observation by Chandra after it was scheduled for observation with XMM-Newton. The reported photometric redshift is zphot = 0.54 ± 0.05, in disagreement with our X-ray-derived value of zFe = 0.38 at the 3σ level. Although slightly weak, the Fe K line is clearly seen in the X-ray spectrum (see Fig. 5 right panels). We thus adopt the X-ray estimate. However, optical spectroscopic observations are clearly needed to confirm the cluster redshift. All compiled and derived optical redshifts are reported in Col. 6 (zopt) in Table 2.
5. Physical parameter estimates of confirmed clusters
5.1. XMM-Newton data
For all single clusters (17 systems) or obvious sub-components in double and triple systems (4 objects), the X-ray peak position was taken to be the (sub-)cluster centre. For these systems we undertook a more in-depth analysis assuming that a spherically symmetric approximation is appropriate.
Surface brightness profiles, centred on the X-ray peak, were extracted in the
[0.3–2] keV band in  bins. Deprojected,
PSF-corrected gas density profiles were then calculated using the method described in
Croston et al. (2008). Global cluster parameters
were then estimated self-consistently within R500 via
iteration about the M500–YX
relation of Arnaud et al. (2010, see also Pratt et al. 2010, viz.,
bins. Deprojected,
PSF-corrected gas density profiles were then calculated using the method described in
Croston et al. (2008). Global cluster parameters
were then estimated self-consistently within R500 via
iteration about the M500–YX
relation of Arnaud et al. (2010, see also Pratt et al. 2010, viz.,
![Mathematical equation: \begin{equation} E(z)^{2/5}\M500 = 10^{14.567 \pm 0.010} \left[\frac{\YX}{2\times10^{14}\,{\msol}\,\keV}\right]^{0.561 \pm 0.018}\,{h_{70}^{-1}\, \msol},\label{eqn:Yx} \end{equation}](/articles/aa/full_html/2011/12/aa16460-11/aa16460-11-eq152.png) (1)
(1)
assuming the standard evolution predicted by the self-similar model purely based on gravitation. In addition, the X-ray luminosity in the [0.1−2.4] keV band interior to R500, L500 was calculated as described in Pratt et al. (2009). All resulting X-ray properties are summarized in Table 2. Errors include only statistical uncertainties. We did not attempt to include systematic errors due to redshift uncertainty or high background level; such estimates are beyond the scope of the paper. The results for this sample are not used for quantitative statistical study (e.g. derivation of scaling laws), which would require redshift confirmation (sources with Qz < 2) and deeper XMM-Newton observations.
The X-ray position for single systems is compared to the Planck position in Fig. 6. The offset behaviour is similar to that observed for known clusters in the ESZ sample (see Planck Collaboration 2011d, for discussion). Except for the outlier PLCK G18.7+23.6, the positional offset is less than 2′ and is clearly dominated by the Planck reconstruction error which peaks at that value. A physical offset is also expected, especially for merging clusters. Such an offset would contribute less with increasing z as it would be more and more poorly resolved. The small residual systematic variation of the offset with z, for z > 0.2, suggests that physical offsets may indeed slightly contribute. This is likely to be the case for PLCK G18.7+23.6, a highly disturbed object at z = 0.09, the lowest z of the sample, and which has an offset of 3′ corresponding to 0.3R500. In all cases, the offset remains smaller than θ500 or the cluster extent (see also Fig. 3).
5.2. Planck refined YSZ estimate
The SZ signal extraction procedure is described in detail in Planck Collaboration (2011d). It consists of applying multi-frequency matched filters to the data that maximally enhance the signal-to-noise ratio of an SZ cluster source by optimally filtering the data. As shown in Planck Collaboration (2011d), SZ fluxes derived using this method can be significantly overestimated due to an over-estimation of the cluster size θ500.
We can optimise the SZ photometry of the clusters presented here by using the X-ray estimate of the cluster position and size θ500, derived from R500 measured using the M500–YX relation as detailed in Sect. 5.1. For each cluster in the sample, we thus re-extract the SZ flux, calculating Y500 with the X-ray position and size fixed to the refined values derived from the high-quality XMM-Newton observation. The resulting Y500 values are listed in Table 2. In Fig. 7, they are compared to the blind values as a function of the ratio of the XMM-Newton and blind characteristic size θ500. For most cases the values are consistent within the errors; however, there is a clear trend of SZ flux overestimation with size overestimation, which can reach as much as a factor of two (see detailed discussion of the cluster size-flux relation in Planck Collaboration 2011d and Planck Collaboration 2011g).
6. X-ray and SZ properties of newly detected clusters
In this Section we consider the 17 systems confirmed as single-component clusters of galaxies, leaving aside the multiple systems which are discussed in the next section.
6.1. RASS properties
We extracted 2° × 2° count images in the [0.5–2.] keV hard band from the RASS data at the position of each cluster. We excised events associated with known RASS-BSC and RASS-FSC sources (Voges et al. 1999, 2000). We then carefully followed the methods described in Böhringer et al. (2000) and Reiprich & Böhringer (2002) to compute background corrected growth curves and estimate an associated detection radius, Rd. The background was estimated from an outer annulus with 15′ < θ < 90′. When allowed by the quality of the growth curve, the count rate within the R500 aperture was either taken as the count rate within Rd when Rd < R500 or interpolated on the curve when Rd > R500. In the case of low quality growth curves, we computed a direct integrated count rate from the map within an aperture of R500. Assuming the best fitting XMM-Newton spectral parameters for each cluster (i.e. z, temperature, abundance, galactic NH) we derived the [0.1–2.4] keV band RASS flux.
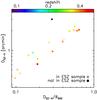 |
Fig.6 Distance of blind SZ position to X-ray position, DSZ−X, as a function of DSZ−X, normalised to the cluster size θ500,X for single confirmed systems. The clusters are colour-coded according to redshift. Note that the offset is typically less than 2′ and always less than θ500. |
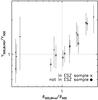 |
Fig.7 Comparison of the Planck blind and X-ray constrained Y500 measurements for single confirmed systems (see text, Sect. 5.2). The ratio is correlated with the ratio of the corresponding characteristic size, θ500. |
The RASS values are compared to the XMM-Newton values in Fig. 8. There is a good agreement after taking into account the RASS statistical errors. The slight offset (<20%) is likely due to systematic errors linked to the RASS background estimate and/or calibration uncertainties. The most significant outlier at high flux is PLCK G18.7+23.6. A bright point source is present at the centre of this object (see Fig. 3) that cannot be excised from the RASS data and which contaminates the signal. From the XMM-Newton image (Fig. 3), the known RASS-FSC or RASS-BSC sources within the Planck error box for 15 of the candidates can be clearly identified with the clusters. Those are indicated in Fig. 8. The two clusters with no RASS-FSC or RASS-BSC association, PLCK G287.0+32.9 and PLCK G292.5+22.0, are in fact detected in RASS, but at low S/N (2 and 3, respectively; see also Sect. 6.4).
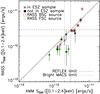 |
Fig.8 Unabsorbed RASS flux versus XMM-Newton flux for the 17 confirmed single-component clusters. The [0.1–2.4] keV flux is measured within an aperture of θ500. Clusters coincident with a RASS-BSC or a RASS-FSC source are marked with red squares and green diamonds, respectively. The most significant outlier at high flux is PLCK G18.7+23.6 at z = 0.09 (see Sects. 6.1 and 6.2 for discussion). |
6.2. The Lx−z plane and comparison with RASS catalogues
In Fig. 9, the new clusters are shown in the LX–z plane, plotted together with the clusters from large catalogues based on RASS data outside the Galactic Plane: REFLEX (Böhringer et al. 2004) in the Southern sky: NORAS (Böhringer et al. 2000); BCS (Ebeling et al. 1998); and eBCS (Ebeling et al. 2000) in the Northern Sky. The NORAS is not flux limited. The REFLEX flux limit of 3 × 10-12 ergs-1 cm-2 is shown. It is similar to that of the eBCS+BCS limit of 2.8 × 10⁻¹² ergs-1 cm-2. Also shown are clusters from the published catalogues of the MACS survey with their corresponding flux limit. MACS is based on the RASS-BSC but in contrast to the above surveys, the X-ray extent of the RASS source is not a selection criterion, allowing more distant (but massive) clusters to be found (Ebeling et al. 2001). Published MACS catalogues are the z > 0.5 catalogue (Ebeling et al. 2007) and the 0.3 < z < 0.5 brightest cluster catalogue (Ebeling et al. 2007, hereafter bright MACS). Luminosities plotted in Fig. 9 are the homogenised values given in the MCXC (Meta-Catalogue of X-ray detected Clusters of galaxies Piffaretti et al. 2011).
The present sample of new Planck-detected systems spans a redshift range of 0.1 ≲ z ≲ 0.6, with 15 out of 17 clusters above z = 0.25, a medium-distant redshift region of the LX–z plane that is sparsely-populated by the RASS catalogues. As a consequence, our current sample has X-ray luminosities well below the flux limit of HIFLUCGS (Reiprich & Böhringer 2002) and REFLEX-DXL (Zhang et al. 2006), two high-luminosity X-ray selected samples that stand as the counterparts to our present high S/N SZ sample. The closest sample in X-ray luminosity and redshift to the new Planck clusters are the MACS clusters, although the Planck clusters go to lower luminosity.
Most of the new Planck clusters naturally fall below the REFLEX flux limit or, equivalently, the BCS+eBCS limit in the North. However, three clusters lie well above this limit: PLCK G18.7+23.6, PLCK G171.9−40.7, PLCK G271.2−31.0, in order of decreasing X-ray flux (Figs. 8 and 9). As discussed above, PLCK G18.7+23.6 at z = 0.09 has a very bright central source and very diffuse ICM emission. It may have been misclassified as a point source in the REFLEX survey. We also note that this cluster, although not included in the ESZ sample, is the brightest X-ray cluster of the sample due to its low redshift z = 0.09. PLCK G271.2−31.0 simply falls in the Large Magellanic Cloud LMC2 region, which was excluded in the REFLEX survey (see Böhringer et al. 2001, Table 1). However, PLCK G171.9−40.7 at z = 0.27 has a flux of 5.7 × 10⁻¹² ergs-1 cm-2 (from fully consistent ROSAT and XMM-Newton measurements), and is a northern sky cluster that fulfills the BCS flux and sky position criteria. Thus a priori, it should have been included in that survey. Finally, six new clusters at z ≥ 0.3 are above the MACS flux limit. Of these, four are not associated with a RASS-BSC source and so could not be found in a MACS-like survey, and the other two are at lower declination than considered by MACS.
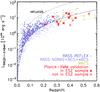 |
Fig.9 The new SZ-discovered Planck clusters compared to clusters from the ROSAT All-Sky Survey catalogues in the LX–z plane. The X-ray luminosity is that in the [0.1–2.4] keV band. Catalogues shown are the REFLEX, NORAS, BCS, eBCS and published MACS catalogues. The solid line is the REFLEX flux limit of 3 × 10-12 ergs-1 cm-2, similar to that of the BCS+eBCS catalogues. The dotted line is the HIFLUCGS flux limit of 2 × 10-11 ergs-1 cm-2 and the dashed line is from the MACS flux limits. See Sect. 6.2 for references and details. |
 |
Fig.10 Scaled density profiles of the new Planck SZ clusters compared to those of similar mass systems from the representative X-ray samples REXCESS (Böhringer et al. 2007) and EXCPRES (Arnaud et al., in prep.). R500 is estimated from the M500–YX relation of Arnaud et al. (2010). Thick lines show the mean profile of each sample. The density profiles of the Planck SZ-selected clusters are on average shallower than those of the X-ray selected clusters of the same mass. |
6.3. Gas morphology and scaled density profiles
Figure 3 shows [0.3–2] keV XMM-Newton images of the newly-discovered clusters. Each image corresponds to the same physical size in units of R500 and is corrected for surface brightness dimming with redshift and divided by the emissivity in the [0.3–2] keV energy band. As detailed in Arnaud et al. (2002, Sect. 3.2), the emissivity is computed from a redshifted thermal model convolved with the instrument response and taking into account Galactic absorption. The resulting image is proportional to the emission measure along the line of sight, which is then scaled by E(z)2R500 according to the self-similar model. The colour table is the same for all clusters, so that the images would be identical if clusters obeyed strict self-similarity. A first visual impression is that low surface brightness, morphologically-disturbed objects dominate the sample, which contains very few centrally-peaked, cool core-like objects.
The visual impression is confirmed and quantified when one looks at the density profiles of the clusters shown in Fig. 10. They are plotted together with the density profiles of similar mass clusters from the representative X-ray-selected samples REXCESS (z < 0.2; Böhringer et al. 2007) and EXCPRES (0.4 < z < 0.6; Arnaud et al, in prep.). For all three samples, the radii are scaled by R500, estimated from the M500–YX relation (Eq. (1)). The thick lines show the mean profile. While the two X-ray-selected samples agree to a remarkable degree, the Planck-selected sample clearly consists of systems with much flatter density profiles, and the corresponding mean profile is significantly flatter than that of the X-ray selected samples. This shape is due to a number of very disturbed clusters with very flat profiles in the new Planck-discovered cluster sample. Let us consider the ten clusters with the flattest density profiles, flatter than the mean profile Planck cluster profile and flatter than all the REXCESS profiles. These ten objects include PLCK G18.7+23.6 at z = 0.09 discussed above, PLCK G286.6−31.3 at z = 0.21 that is just at the REFLEX flux limit and PLCK G292.5+22.0 at z = 0.30 that is just at the MACS flux limit (Fig. 9). The other seven clusters lie at medium redshift, 0.3 < z < 0.45, and are all hot (TX ≳ 5keV) and massive (M500 ≳ 5 × 10¹⁴ M⊙) systems. They lie below the flux limit of both REFLEX and bright MACS for a similar mass range (Ebeling et al. 2010). Thus Planck appears to have uncovered a population of massive, disturbed, low-luminosity systems.
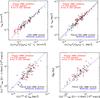 |
Fig.11 Scaling relations for the 17 new confirmed single-component clusters (red symbols).
Black points show clusters in the Planck-ESZ sample with
XMM-Newton archival data as presented in Planck Collaboration (2011g). The solid black line denotes the
corresponding scaling relation fits in each panel. The blue lines in the top
and bottom right panels denote the predicted
Y500 scaling relations from the REXCESS X-ray
observations (Arnaud et al. 2010). The blue
line in the bottom left panel is the Malmquist bias corrected
M–L relation from the REXCESS sample (Pratt et al. 2009; Arnaud et al. 2010). In all figures,
R500 and M500 are
estimated from the M500–YX
relation of Arnaud et al. (2010). Top
row: relation between apparent SZ signal
(Y500, left) or intrinsic Compton
parameter ( |

6.4. SZ flux versus X-ray prediction and mass-proxy – mass relations
Planck Collaboration (2011g) uses XMM-Newton archival data to study the relations between the SZ signal and X-ray properties such as YX or the soft band luminosity L500 on a sub-sample of clusters from the high signal-to-noise ratio ESZ sample. This sample (hereafter the ESZ-XMM-archive sample) is SZ selected but by nature only comprises clusters from X-ray surveys. As discussed extensively in Planck Collaboration (2011g), the analysis has demonstrated the excellent agreement between the observed scaling relations and the predictions based on REXCESS pressure profiles and numerical simulations (Arnaud et al. 2010). In Fig. 11, we have placed the new PlanckXMM-Newton confirmed clusters on the Y500–YX relations (top panels) and the L500–Y500 and M500–L500 relations (bottom panels).
6.4.1. The Y500–YX relation
The SZ signal, Y500, is plotted as a function of the
normalized  parameter in
the left panel of Fig. 11. The new clusters follow
the trend observed for the ESZ-XMM-archive and are consistent with the
REXCESS prediction (blue line). However, a slight turnover is observed at low flux, with
observed points systematically above the predicted relation. This excess is likely due
to the Malmquist bias. Such a trend is also slightly apparent for the
ESZ-XMM-archive sample but is less important (see Planck Collaboration 2011g, for discussion of this
effect). The low flux clusters span various z values and are
redistributed over the range of intrinsic Compton parameter. As a result there is slight
positive offset apparent in the
parameter in
the left panel of Fig. 11. The new clusters follow
the trend observed for the ESZ-XMM-archive and are consistent with the
REXCESS prediction (blue line). However, a slight turnover is observed at low flux, with
observed points systematically above the predicted relation. This excess is likely due
to the Malmquist bias. Such a trend is also slightly apparent for the
ESZ-XMM-archive sample but is less important (see Planck Collaboration 2011g, for discussion of this
effect). The low flux clusters span various z values and are
redistributed over the range of intrinsic Compton parameter. As a result there is slight
positive offset apparent in the  –YX
relation for new clusters as compared to the ESZ-XMM-archive sample.
–YX
relation for new clusters as compared to the ESZ-XMM-archive sample.
This suggests that as far as the relation between Y500 and its X-ray equivalent YX is concerned, the new clusters are similar to X-ray selected clusters, although they are more dynamically disturbed. This is expected if indeed the pressure is the quantity less affected by dynamical state and both YX and Y500 are low scatter mass proxies. However, independent mass estimates are required to check this point; they cannot be provided by X-ray measurements in view of the highly unrelaxed nature of the new clusters.
6.4.2. The L500–Y500 and M500–L500 relations
As compared to X-ray selected clusters, the new clusters fall on the low luminosity side of the L500–Y500 relation (bottom left panel of Fig. 11). In other words, they are under-luminous at given Y500. If the mass is indeed tightly related to Y500 (or YX) we then expect them to be underluminous at a given mass. This trend is consistently observed in the bottom-right panel, where M500 is estimated from YX: the new clusters fall towards the high-mass, low-luminosity side of the M500–L500 relation. However, confirmation requires independent mass estimates, e.g., from lensing data.
As shown by Pratt et al. (2009), the underluminous region of the L–M plane is populated by morphologically disturbed systems. This once again suggests that the majority of the new Planck-detected systems are disturbed, in agreement with the above discussion on the morphology and the scaled density profiles.
The dispersion of the new clusters about the M500–L500 relation also seems higher than that for X-ray selected objects. This suggests the existence of new extreme low-luminosity, high-mass objects that are being revealed by Planck. The two prominent outliers are PLCK G287.0+32.9 (z = 0.39) and PLCK G292.5+22.0 (z = 0.3), detected by Planck at high S/N values of 10.6 and 6.9, respectively. They belong to the very hot (T ≳ 10keV) and very massive (M500 ≳ 1015 M⊙) cluster category (Table 2) and are the only two clusters associated with neither a BSC nor an FSC source (Sect. 6.1 and Fig. 8). The flux of PLCK G292.5+22.0 barely reaches the MACS limit for a mass of M500 ~ 9.2 × 10¹⁴ M⊙. It has a very disturbed morphology (Fig. 3) and a flat density profile with a scaled central density of 4 × 10⁻³ cm-3 (Fig. 10).
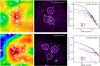 |
Fig.12 The triple systems PLCK G214.6+37.0 (top) and PLCK G334.8−38.0 (bottom). The left panels show the PlanckYSZ map (derived from an Internal Linear Combination method) with contours from the XMM-Newton wavelet filtered [0.3–2] keV image (middle panels) overlaid in white. The cross marks the position of the re-extraction centre for flux re-analysis. Extended components found in the XMM-Newton image are marked with letters (see text and Table 2). The circles in each XMM-Newton image denote the estimated R500 radius for each component. The right panels show the X-ray surface brightness profiles of the three components for each super cluster (points with uncertainties), and the best-fitting β-model (solid lines) compared to the profile of the PSF normalised at the central level (dashed lines). |
7. Further analysis of multiple systems
7.1. Double systems
Two of the new Planck sources (PLCK G308.3−20.2 and PLCK G337.1−26.0) were revealed by the XMM-Newton validation observations to be double systems. X-ray images of these systems are included in the gallery in Fig. 3.
7.1.1. PLCK G308.3−20.2
Two clusters with quite regular morphology are clearly detected in the XMM-Newton snapshot observation for this candidate (denoted A and B in Fig. 3). The Planck position is very close (1.5′) to that of the northern cluster A. This cluster is very hot (TX ~ 10keV) and massive (Table 2). From the X-ray spectroscopy, we estimated its redshift to be z = 0.48. This estimate is robust, with a quality flag of 2 as reported in Table 2. The second component, B, lies 7′ to the South-East of A. The lack of statistics prevents us from deriving a sufficiently reliable redshift estimate. Assuming it lies at the same redshift as A, its YX parameter is 6.0 times less than that of A, and its derived mass is 2.7 times less. Both clusters are seen as well-separated sources in RASS: A is associated with a RASS-BSC source; whereas B coincides with a RASS-FSC source.
7.1.2. PLCK G337.1−26.0
The distance between components A and B (Fig. 3) is 8.1′. Both have regular morphologies, and exhibit strong Fe K lines, allowing individual redshift estimation. They are found to lie at two clearly different redshifts: zFe = 0.26 for A; and zFe = 0.12 for B. A is the hotter of the two with TX = (6.2 ± 0.2)keV and thus the more massive. The YX of cluster A is 15 times larger than that of B, making it the main contributor to the Planck SZ signal.
The two clusters are seen as separate sources in RASS: cluster A as a RASS-BCS source; and B as a RASS-FCS source. The XMM-Newton emission coincides perfectly with the RASS emission in each case. Additionally, the two clusters are also found 40′ off-axis in a PSPC pointed observation of a globular cluster, NGC6752 (Johnston et al. 1994), where they are listed as sources within the globular cluster (sources 1 and 2 in Johnston et al.’s Table 8). Lacking spectroscopic information, Johnston et al. (1994) could not specify the exact nature of the sources, which they assumed to be of Galactic origin. Note that it is not surprising that the sources were not identified as extended sources, in view of the large PSPC PSF (90% encircled energy diameter of ~6′) at such off-axis angle.
7.2. Triple systems
PLCK G214.6+37.0 and PLCK G334.8-38.0 were included in the XMM-Newton pilot programme and are detected in the Planck survey with S/N of 5.0 and 4.1, respectively. The wavelet-filtered X-ray surface brightness contours are overlaid on the Planck maps in the left-hand panels of Fig. 12. For both sources, the XMM-Newton observation revealed three extended X-ray components; their extended nature is evident in the surface brightness profiles shown in the right-hand panels.
7.2.1. PLCK G214.6+37.0
The Planck SZ source candidate position is located ~5′ from the two southern components (A and B). A third component, C, lies approximately 7′ to the North (Fig. 12, top panels). X-ray spectral analysis of the Fe K line indicates a redshift of zFe ~ 0.45 for the brightest component. None of the sources is particularly hot, luminous, or massive (i.e. M500 < 2.5 × 10¹⁴ M⊙). A RASS-FSC source lies in the South-East and its counterpart is easily seen with XMM-Newton. It is associated with a point source and is unassociated with the SZ emission.
PLCKG214.6+37.0 falls in the SDSS area. We investigated the SDSS-DR7 database using refined positional information from the XMM-Newton observation. We identified two bright galaxies with spectroscopic redshifts of z = 0.45 whose positions coincide with the peak of components A and C, respectively. Furthermore, a bright galaxy with a photometric redshift of 0.46 lies very close to the B X-ray peak. We also ran a dedicated algorithm (Fromenteau et al., in prep.) to search for an overdensity of SDSS galaxies at the location of the Planck SZ source. While we were unable to differentiate the three sub-structures, the analysis suggests the presence of a massive structure (~1015 M⊙) at z ~ 0.45 around A and B. A further cross-correlation with SDSS-DR7 LRGs and the SCs catalogue from the SDSS-DR7 (Liivamägi et al. 2010) hints that this triple system is encompassed within a very large-scale structure located at z ~ 0.45, and whose centroid lies about 2° to the South (see Appendix B for further details).
Thus there is good agreement between all redshift estimates, including the redshift of component A estimated from the XMM-Newton observation, the optical SDSS redshifts of the three components, and that of the larger-scale environment. This agreement strongly argues in favour of a real structure of (at least) three clusters, likely forming the core of a larger-scale super cluster.
7.2.2. PLCK G334.8−38.0
Two extended X-ray components separated by 7′ are clearly visible in the XMM-Newton image (denoted A and B in Fig. 12, bottom panels). The Planck SZ source candidate position lies between and slightly to the south of the components. A third fainter component, C, is seen 5′ to the South. The spectral analysis of component A suggests a redshift of zFe ~ 0.35. Although, this estimate, based on the Fe L complex detection, has to be taken with caution, we adopted it as the redshift for all three X-ray components. Despite limited statistics, we derived temperatures of (2–3)keV (with large uncertainties for cluster C), suggesting masses of (0.5–1) × 1014 M⊙. The only RASS source found in the vicinity of the SZ source is clearly not associated with the three XMM-Newton components, and coincides with an off-axis point source seen in the XMM-Newton image.
7.3. Comparison of X-ray and SZ properties
As a first comparison of the X-ray and SZ properties, we simply compared the Y500Planck measurement with the predicted value from the summed contribution of the various components, derived from their estimated YX values.
For PLCKG308.3−20.2, the predicted summed contribution from A and B represents 46% of the total measured SZ signal (with 40% from A alone). In the case of PLCK G337.1−26.0, this amounts to 76% of the measured Y500 (with 62% coming from component A). The presence of component B marginally enhances the expected SZ signal. As the two clusters are not physically connected, no enhanced SZ emission is expected from their surrounding (i.e., due to mergers, shocks, etc.). We recall that the reconstruction error in the SZ position for Planck blind SZ detections is 2′ on average (Melin et al. 2011). The fact that the Planck SZ position lies almost in the middle of the two components (i.e. 3.3′ and 4.7′ from A and B, respectively) is probably coincidental.
The PlanckY500 values of PLCK G214.6+37.0 and PLCK G334.8−38.0 were recomputed at a fixed “barycentric” position of the three components (black cross in Fig. 12). The sum over the three components of PLCK G214.6+37.0 yields Y500,pred = 3.2 × 10⁻⁴ arcmin2, i.e. 25% of the measured value. It is 35% of the 1σ lower limit of Y500, and consistent within its 3σ error range.
In the case of PLCK G334.8−38.0, Y500,pred = 1.4 × 10⁻⁴ arcmin2 accounts for only ~21% of the measured SZ signal and 29% of its 1σ lower limit. However, the predicted value is consistent within the 3σ error range of the Planck value, that includes uncertainties on the structure size. We also note that a fortuitous association between a spurious detection by Planck and such an association of extended X-ray sources is quite unlikely. Indeed, such a configuration of multiple massive halos either physically connected or associated by projection effect is not usual, making this source even more puzzling. The formal discrepancy between the SZ and X-ray signal is likely partly due to lack of constraints on the structure size in the SZ measurement, even when the position is fixed to the X-ray position. It could also be the result of an under-estimate of the structure’s redshift. Redshift measurements of various components are definitively required to assess the nature of this association and the Planck source.
For all systems, the cumulative contribution predicted by the YX measurements does not match the measured SZ signal, although it is compatible in all cases within the 3σ uncertainty on Y500. However, the SZ flux is estimated assuming a single component that follows the universal pressure profile, an inadequate approach for these systems. Due to its moderate spatial resolution at SZ frequencies (i.e., 5–10′), Planck cannot separate the emission of the two or three components contributing to the overall signal. Nevertheless, a proper multi-component analysis can be carried out in the future. From the X-ray constraints on the system geometry, a spatial template can be built to improve extraction of the Y500 signal for each component. Indeed, such a detailed study might allow us to ascertain whether SZ or X-ray emission emanates from the regions between the main system components. The current XMM-Newton snapshot observations are not deep enough to build such an accurate template (i.e., measurement of the pressure profiles of the individual components). Together with accurate redshift measurements, deeper X-ray observations are needed to derive the pressure profile of individual clusters.
8. Conclusion and perspectives
In the framework of an XMM-Newton DDT validation programme, the first 21 new SZ-detected clusters in the Planck survey have been confirmed. Six of these were confirmed in an initial Pilot programme, the results of which were used to improve the quality assessment and selection processes of cluster candidates. The Pilot programme also clearly demonstrated the efficiency of XMM-Newton for Planck candidate confirmation. Based on the detection of extended emission, snapshot exposures have been shown to be sufficient for unambiguous discrimination between clusters and false candidates. Importantly, for redshifts at least up to z = 1.5, the spurious association of Planck candidates with faint extended sources in the position error box can be distinguished via a consistency check between the X-ray and SZ flux. A further 15 candidates were confirmed in a second programme focussed on high S/N detections. The 100% success rate above S/N = 5 is the first illustration of the capability of the Planck survey to detect new clusters via their SZ signature.
Except for two clusters, all confirmed single or double clusters are associated with RASS-BSC or FSC sources. The two non-associations are in fact detected in RASS, but at a low S/N of 2–3. The presence of significant RASS emission is thus a positive indicator of the validity of a Planck cluster candidate in the presently-covered z range. However, association with a RASS source within the position error box is not, by itself, sufficient for cluster candidate confirmation. Two of the false candidates in the Pilot programme, as well as one of the confirmed triple systems, were each associated with a single RASS-FSC source that XMM-Newton subsequently revealed to be a point source. Furthermore such spurious association, and also the number of real candidates not detected in RASS, is expected to increase when probing higher z, i.e., at lower Planck S/N, or later in the mission.
The XMM-Newton validation programme brings clear added value to simple candidate confirmation. The X-ray flux measurement and refined position is essential information for optimisation of deeper follow-up observations for detailed X-ray studies. The refined position is also useful for optical follow-up, such as for redshift measurements. Importantly, the determination of the exact cluster centre and extent allows a refined estimate of the SZ flux from Planck data. For the X-ray brightest objects, XMM-Newton can directly provide the source redshift from the Fe K line in the spectrum. For the present sample of confirmed candidates, 17 of 27 individual clusters (including those in multiple systems) have high quality redshift measurements. The new clusters span the redshift range 0.09 < z < 0.54, with a median redshift of z = 0.37.
In addition, the XMM-Newton validation programme has provided a preview of the properties of the new clusters that Planck is discovering. Of the 21 confirmed candidates, 17 are single clusters, most of which are found to have highly irregular and/or disturbed morphologies (i.e. ~70% from visual check). Two more confirmed candidates were revealed to be double systems, one of which is a projection of two physically independent clusters at different redshifts. More unexpected are two further newly-discovered triple systems that were not resolved by Planck. One of these is a true cluster association at z ~ 0.45, as confirmed both from the XMM-Newton data and in our subsequent analysis of SDSS data. It likely forms the core of a larger-scale supercluster, and is the first supercluster to be discovered via the SZ effect. Theoretically, the SZ signal from such a supercluster is expected to arise from the sum of the signal from the individual clusters, plus a possible additional contribution from a filamentary inter-cluster gas structure, the existence of which has not yet been observationally proven. This Planck-XMM-Newton discovery may open the way to constrain the existence and properties of such filamentary matter, via deeper combined Planck SZ and X-ray studies. The current XMM-Newton snapshot observations do not allow conclusive comparison between the SZ and X-ray signals. Deeper observations are needed, sufficient to determine the pressure profile of individual subclusters.
The Planck SZ survey has already started to complement existing X-ray surveys, particularly above z ~ 0.3. Notably, it is finding new clusters below the flux limit of catalogues based on extended RASS source detection, such as the REFLEX survey, and new clusters brighter than the flux limit of the MACS survey above z = 0.3. Such discoveries are due to a combination of larger effective sky coverage and the intrinsic limitations of a RASS-based cluster survey. In practice, surveys considering extended RASS sources, such as REFLEX, have a higher flux limit than that corresponding to Planck’s sensitivity. By considering RASS-BSC sources without extent criteria, the MACS survey reaches a lower flux limit, at the price of extensive optical confirmation follow-up that does not cover the whole sky. Furthermore, the RASS-BSC detection algorithm was primarily designed for point source detection and can miss very diffuse sources similar to the clusters with flat morphology that Planck is revealing. Four of our confirmed clusters are above the MACS limit but are not associated with a RASS-BSC source.
For the single-component clusters, we have been able to derive the first estimates of their physical properties such as L500, YX (with M500 estimated using YX as a mass proxy), and density profiles. These properties suggest that the new clusters are massive, dynamically-complex, objects. These SZ-selected objects have, on average, lower luminosities, flatter density profiles, and a more disturbed morphology than their X-ray selected counterparts. As a result, the dispersion around the M–L relation may be larger than previously thought, with new clusters like PLCK G292.5+22.0 at z = 0.3 barely reaching the MACS flux limit for an estimated mass of M500 ~ 1015 M⊙. This suggests that there is a non-negligible population of massive, dynamically perturbed (merging) clusters that do not appear in all-sky X-ray surveys. Furthermore, as the bulk of cluster cosmology is currently undertaken using X-ray-selected samples, the lack of these clusters may have implications for measures of the cosmologically-sensitive exponential end of the mass function.
The above preview of newly-detected Planck cluster properties must be confirmed with deeper, multi-wavelength, follow-up observations. Such observations include optical redshift confirmation (see the ENO observations presented here), detailed pressure profiles from deeper XMM-Newton observations and mass estimates. The latter require the combination of lensing, optical and X-ray data, in view of the highly unrelaxed nature of the objects.
Continuation of the confirmation of Planck candidates and the characterisation of the Planck selection function constitutes a major effort, and requires a good understanding of the properties of the newly-discovered clusters. As we have shown in this paper, XMM-Newton can play a major role in this process. The XMM-Newton validation programme is presently ongoing. It is currently focussed on Planck detections both in the S/N > 5 range and at lower S/N, thus potentially leading to the discovery of more distant clusters.
Planck (http://www.esa.int/Planck) is a project of the European Space Agency (ESA) with instruments provided by two scientific consortia funded by ESA member states (in particular the lead countries: France and Italy) with contributions from NASA (USA), and telescope reflectors provided in a collaboration between ESA and a scientific consortium led and funded by Denmark.
Results from other methods have been cross-compared to those from the MMF search, including from the PowellSnakes-based algorithm (Carvalho et al. 2009).
See http://xmm.esac.esa.int/sas/current/doc/emldetect/node3.html for more details
Acknowledgments
The Planck Collaboration thanks Norbert Schartel for his support to the validation process and granting discretionary time for the observation of Planck cluster candidates. The present work is based: on observations obtained with XMM-Newton, an ESA science mission with instruments and contributions directly funded by ESA Member States and the USA (NASA); and on observations made with the IAC80 telescope operated on the island of Tenerife by the Instituto de Astrofísica de Canarias (IAC) in the Spanish Observatorio del Teide. This research has made use of the following databases: SIMBAD, operated at CDS, Strasbourg, France; the NED database, which is operated by the Jet Propulsion Laboratory, California Institute of Technology, under contract with the National Aeronautics and Space Administration; BAX, which is operated by the Laboratoire d’Astrophysique de Tarbes-Toulouse (LATT), under contract with the Centre National d’Études Spatiales (CNES); and the SZ repository operated by IAS Data and Operation Center (IDOC) under contract with CNES. A description of the Planck Collaboration and a list of its members, indicating which technical or scientific activities they have been involved in, can be found at http://www.rssd.esa.int/Planck_Collaboration. The Planck Collaboration acknowledges the support of: ESA; CNES and CNRS/INSU-IN2P3-INP (France); ASI, CNR, and INAF (Italy); NASA and DoE (USA); STFC and UKSA (UK); CSIC, MICINN and JA (Spain); Tekes, AoF and CSC (Finland); DLR and MPG (Germany); CSA (Canada); DTU Space (Denmark); SER/SSO (Switzerland); RCN (Norway); SFI (Ireland); FCT/MCTES (Portugal); and DEISA (EU).
References
- Allen, S. W., Rapetti, D. A., Schmidt, R. W., et al. 2008, MNRAS, 383, 879 [NASA ADS] [CrossRef] [Google Scholar]
- Anders, E., & Grevesse, N. 1989, Geochim. Cosmochim. Acta, 53, 197 [Google Scholar]
- Arnaud, K. A. 1996, in Astronomical Data Analysis Software and Systems V, ed. G. H. Jacoby, & J. Barnes, ASP Conf. Ser., 101, 17 [Google Scholar]
- Arnaud, M., Aghanim, N., & Neumann, D. M. 2002, A&A, 389, 1 [NASA ADS] [CrossRef] [EDP Sciences] [Google Scholar]
- Arnaud, M., Pratt, G. W., Piffaretti, R., et al. 2010, A&A, 517, A92 [NASA ADS] [CrossRef] [EDP Sciences] [Google Scholar]
- Balestra, I., Tozzi, P., Ettori, S., et al. 2007, A&A, 462, 429 [NASA ADS] [CrossRef] [EDP Sciences] [Google Scholar]
- Benítez, N. 2000, ApJ, 536, 571 [NASA ADS] [CrossRef] [Google Scholar]
- Bersanelli, M., Mandolesi, N., Butler, R. C., et al. 2010, A&A, 520, A4 [NASA ADS] [CrossRef] [EDP Sciences] [Google Scholar]
- Bertin, E., & Arnouts, S. 1996, A&AS, 117, 393 [NASA ADS] [CrossRef] [EDP Sciences] [Google Scholar]
- Böhringer, H., Voges, W., Huchra, J. P., et al. 2000, ApJS, 129, 435 [NASA ADS] [CrossRef] [Google Scholar]
- Böhringer, H., Schuecker, P., Guzzo, L., et al. 2001, A&A, 369, 826 [NASA ADS] [CrossRef] [EDP Sciences] [Google Scholar]
- Böhringer, H., Schuecker, P., Guzzo, L., et al. 2004, A&A, 425, 367 [NASA ADS] [CrossRef] [EDP Sciences] [Google Scholar]
- Böhringer, H., Schuecker, P., Pratt, G. W., et al. 2007, A&A, 469, 363 [NASA ADS] [CrossRef] [EDP Sciences] [Google Scholar]
- Boulanger, F., Abergel, A., Bernard, J., et al. 1996, A&A, 312, 256 [NASA ADS] [Google Scholar]
- Carvalho, P., Rocha, G., & Hobson, M. P. 2009, MNRAS, 393, 681 [NASA ADS] [CrossRef] [Google Scholar]
- Croston, J. H., Pratt, G. W., Böhringer, H., et al. 2008, A&A, 487, 431 [NASA ADS] [CrossRef] [EDP Sciences] [Google Scholar]
- da Silva, A. C., Kay, S. T., Liddle, A. R., & Thomas, P. A. 2004, MNRAS, 348, 1401 [NASA ADS] [CrossRef] [Google Scholar]
- De Luca, A., & Molendi, S. 2004, A&A, 419, 837 [NASA ADS] [CrossRef] [EDP Sciences] [Google Scholar]
- Dickey, J. M., & Lockman, F. J. 1990, ARA&A, 28, 215 [NASA ADS] [CrossRef] [MathSciNet] [Google Scholar]
- Ebeling, H., Edge, A. C., Bohringer, H., et al. 1998, MNRAS, 301, 881 [NASA ADS] [CrossRef] [Google Scholar]
- Ebeling, H., Edge, A. C., Allen, S. W., et al. 2000, MNRAS, 318, 333 [NASA ADS] [CrossRef] [Google Scholar]
- Ebeling, H., Edge, A. C., & Henry, J. P. 2001, ApJ, 553, 668 [Google Scholar]
- Ebeling, H., Barrett, E., Donovan, D., et al. 2007, ApJ, 661, L33 [NASA ADS] [CrossRef] [Google Scholar]
- Ebeling, H., Edge, A. C., Mantz, A., et al. 2010, MNRAS, 407, 83 [NASA ADS] [CrossRef] [Google Scholar]
- Jansen, F., Lumb, D., Altieri, B., et al. 2001, A&A, 365, L1 [NASA ADS] [CrossRef] [EDP Sciences] [Google Scholar]
- Johnston, H. M., Verbunt, F., & Hasinger, G. 1994, A&A, 289, 763 [NASA ADS] [Google Scholar]
- Lamarre, J., Puget, J., Ade, P. A. R., et al. 2010, A&A, 520, A9 [NASA ADS] [CrossRef] [EDP Sciences] [Google Scholar]
- Leahy, J. P., Bersanelli, M., D’Arcangelo, O., et al. 2010, A&A, 520, A8 [NASA ADS] [CrossRef] [EDP Sciences] [Google Scholar]
- Leccardi, A., & Molendi, S. 2008, A&A, 487, 461 [NASA ADS] [CrossRef] [EDP Sciences] [Google Scholar]
- Liivamägi, L. J., Tempel, E., & Saar, E. 2010, A&A, submitted [arXiv:1012.1989] [Google Scholar]
- Mandolesi, N., Bersanelli, M., Butler, R. C., et al. 2010, A&A, 520, A3 [Google Scholar]
- Maughan, B. J., Jones, C., Forman, W., & Van Speybroeck, L. 2008, ApJS, 174, 117 [NASA ADS] [CrossRef] [Google Scholar]
- Melin, J., Bartlett, J. G., & Delabrouille, J. 2006, A&A, 459, 341 [NASA ADS] [CrossRef] [EDP Sciences] [Google Scholar]
- Melin, J., Aghanim, N., Bartelman, M., et al. 2011, A&A, submitted [Google Scholar]
- Menanteau, F., Gonzalez, J., Juin, J.-B., et al. 2010, ApJ, 723, 1523 [NASA ADS] [CrossRef] [Google Scholar]
- Mennella, A., Butler, R. C., Curto, A., et al. 2011, A&A, 536, A3 [NASA ADS] [CrossRef] [EDP Sciences] [Google Scholar]
- Miville-Deschênes, M., & Lagache, G. 2005, ApJS, 157, 302 [NASA ADS] [CrossRef] [Google Scholar]
- Pacaud, F., Pierre, M., Adami, C., et al. 2007, MNRAS, 382, 1289 [NASA ADS] [CrossRef] [Google Scholar]
- Piffaretti, R., Arnaud, M., Pratt, G. W., Pointecouteau, E., & Melin, J. 2011, A&A, 534, A109 [NASA ADS] [CrossRef] [EDP Sciences] [Google Scholar]
- Planck Collaboration 2011a, A&A, 536, A1 [NASA ADS] [CrossRef] [EDP Sciences] [Google Scholar]
- Planck Collaboration 2011b, A&A, 536, A2 [NASA ADS] [CrossRef] [EDP Sciences] [Google Scholar]
- Planck Collaboration 2011c, A&A, 536, A7 [NASA ADS] [CrossRef] [EDP Sciences] [Google Scholar]
- Planck Collaboration 2011d, A&A, 536, A8 [NASA ADS] [CrossRef] [EDP Sciences] [Google Scholar]
- Planck Collaboration 2011e, A&A, 536, A9 [NASA ADS] [CrossRef] [EDP Sciences] [Google Scholar]
- Planck Collaboration 2011f, A&A, 536, A10 [NASA ADS] [CrossRef] [EDP Sciences] [Google Scholar]
- Planck Collaboration 2011g, A&A, 536, A11 [NASA ADS] [CrossRef] [EDP Sciences] [Google Scholar]
- Planck Collaboration 2011h, A&A, 536, A12 [NASA ADS] [CrossRef] [EDP Sciences] [Google Scholar]
- Planck Collaboration 2011i, A&A, 536, A13 [NASA ADS] [CrossRef] [EDP Sciences] [Google Scholar]
- Planck Collaboration 2011j, A&A, 536, A14 [NASA ADS] [CrossRef] [EDP Sciences] [Google Scholar]
- Planck Collaboration 2011k, A&A, 536, A15 [NASA ADS] [CrossRef] [EDP Sciences] [Google Scholar]
- Planck Collaboration 2011l, A&A, 536, A16 [NASA ADS] [CrossRef] [EDP Sciences] [Google Scholar]
- Planck Collaboration 2011m, A&A, 536, A17 [NASA ADS] [CrossRef] [EDP Sciences] [Google Scholar]
- Planck Collaboration 2011n, A&A, 536, A18 [NASA ADS] [CrossRef] [EDP Sciences] [Google Scholar]
- Planck Collaboration 2011o, A&A, 536, A19 [NASA ADS] [CrossRef] [EDP Sciences] [Google Scholar]
- Planck Collaboration 2011p, A&A, 536, A20 [NASA ADS] [CrossRef] [EDP Sciences] [Google Scholar]
- Planck Collaboration 2011q, A&A, 536, A21 [NASA ADS] [CrossRef] [EDP Sciences] [Google Scholar]
- Planck Collaboration 2011r, A&A, 536, A22 [NASA ADS] [CrossRef] [EDP Sciences] [Google Scholar]
- Planck Collaboration 2011s, A&A, 536, A23 [NASA ADS] [CrossRef] [EDP Sciences] [Google Scholar]
- Planck Collaboration 2011t, A&A, 536, A24 [Google Scholar]
- Planck Collaboration 2011u, A&A, 536, A25 [NASA ADS] [CrossRef] [EDP Sciences] [Google Scholar]
- Planck Collaboration 2011v, The Explanatory Supplement to the Planck Early Release Compact Source Catalogue (ESA) [Google Scholar]
- Planck Collaboration 2011w, A&A, 536, A26 [NASA ADS] [CrossRef] [EDP Sciences] [Google Scholar]
- Planck HFI Core Team 2011a, A&A, 536, A4 [NASA ADS] [CrossRef] [EDP Sciences] [Google Scholar]
- Planck HFI Core Team 2011b, A&A, 536, A6 [NASA ADS] [CrossRef] [EDP Sciences] [Google Scholar]
- Pointecouteau, E., Arnaud, M., Kaastra, J., & de Plaa, J. 2004, A&A, 423, 33 [NASA ADS] [CrossRef] [EDP Sciences] [Google Scholar]
- Pratt, G. W., & Arnaud, M. 2002, A&A, 394, 375 [NASA ADS] [CrossRef] [EDP Sciences] [Google Scholar]
- Pratt, G. W., Böhringer, H., Croston, J. H., et al. 2007, A&A, 461, 71 [NASA ADS] [CrossRef] [EDP Sciences] [Google Scholar]
- Pratt, G. W., Croston, J. H., Arnaud, M., & Böhringer, H. 2009, A&A, 498, 361 [NASA ADS] [CrossRef] [EDP Sciences] [Google Scholar]
- Pratt, G. W., Arnaud, M., Piffaretti, R., et al. 2010, A&A, 511, A85 [NASA ADS] [CrossRef] [EDP Sciences] [Google Scholar]
- Read, A. M., & Ponman, T. J. 2003, A&A, 409, 395 [NASA ADS] [CrossRef] [EDP Sciences] [Google Scholar]
- Reiprich, T. H., & Böhringer, H. 2002, ApJ, 567, 716 [NASA ADS] [CrossRef] [Google Scholar]
- Rosset, C., Tristram, M., Ponthieu, N., et al. 2010, A&A, 520, A13 [NASA ADS] [CrossRef] [EDP Sciences] [Google Scholar]
- Rothenflug, R., & Arnaud, M. 1985, A&A, 144, 431 [NASA ADS] [Google Scholar]
- Scharf, C. 2002, ApJ, 572, 157 [NASA ADS] [CrossRef] [Google Scholar]
- Snowden, S. L., Egger, R., Freyberg, M. J., et al. 1997, ApJ, 485, 125 [NASA ADS] [CrossRef] [Google Scholar]
- Strüder, L., Briel, U., Dennerl, K., et al. 2001, A&A, 365, L18 [NASA ADS] [CrossRef] [EDP Sciences] [Google Scholar]
- Sunyaev, R. A., & Zeldovich, Y. B. 1972, Comm. Astrophys. Space Phys., 4, 173 [Google Scholar]
- Tauber, J. A., Mandolesi, N., Puget, J., et al. 2010, A&A, 520, A1 [NASA ADS] [CrossRef] [EDP Sciences] [Google Scholar]
- Turner, M. J. L., Abbey, A., Arnaud, M., et al. 2001, A&A, 365, L27 [NASA ADS] [CrossRef] [EDP Sciences] [Google Scholar]
- Šuhada, R., Song, J., Böhringer, H., et al. 2010, A&A, 514, L3+ [NASA ADS] [CrossRef] [EDP Sciences] [Google Scholar]
- Voges, W., Aschenbach, B., Boller, T., et al. 1999, A&A, 349, 389 [NASA ADS] [Google Scholar]
- Voges, W., Aschenbach, B., Boller, T., et al. 2000, VizieR Online Data Catalog, 9029, [Google Scholar]
- Voit, G. M. 2005, Rev. Mod. Phys., 77, 207 [NASA ADS] [CrossRef] [Google Scholar]
- Zacchei, A., Maino, D., Baccigalupi, C., et al. 2011, A&A, 536, A5 [NASA ADS] [CrossRef] [EDP Sciences] [Google Scholar]
- Zhang, Y., Böhringer, H., Finoguenov, A., et al. 2006, A&A, 456, 55 [NASA ADS] [CrossRef] [EDP Sciences] [Google Scholar]
Appendix A: Redshift determination based on optical counterparts
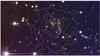 |
Fig.A.1 RGB colour–composite image of the optical counterpart of cluster PLCK G100.2-30.4, as obtained with the IAC80 telescope. R, G, B colours are g,r and i-band Sloan filters, respectively. Although the IAC80 field of view is 7′, this image is trimmed to 4.8′ × 2.7′, and is centred at the XMM-Newton counterpart (white iso-contours). Red galaxies defining the red-sequence of the cluster are clearly seen at the centre of the image. |
A.1. PLCK G100.2−30.4
We observed PLCK G100.2−30.4 with the CAMELOT camera on the 0.82-m IAC80 telescope at
the Observatorio del Teide (Tenerife, Spain), as part of a validation campaign for newly
detected Planck clusters that started in semester 2010A. We obtained
four images in the Sloan g,r,i and z-bands, all
centred at the location of the Planck cluster candidate, with a field
of view of 7′ and a pixel scale of  . The integration time
achieved in each filter was approximately 3ks, yielding a limiting magnitude of 22.9,
21.7, 20.1 and 20.2 for g,r,i and z, respectively, for
a 6σ detection.
. The integration time
achieved in each filter was approximately 3ks, yielding a limiting magnitude of 22.9,
21.7, 20.1 and 20.2 for g,r,i and z, respectively, for
a 6σ detection.
Image data reduction was undertaken using standard iraf routines. The source detection, catalogue extraction and photometry measurements on the processed images were performed using SExtractor (Bertin & Arnouts 1996). Sources were identified independently in the four bands using a 1.5σ SExtractor detection threshold in the filtered maps (i.e. equivalent to S/N ~ 3). The colour-composite image of the g,r and i filters (see Fig. A.1) clearly shows an excess of red galaxies at the location of the X-ray detection.
We have obtained photometric redshifts for all galaxies in the field using the bpz code (Benítez 2000). We use the photometry information from the g,r and i-bands, as they provide more reliable redshift estimates. From the final galaxy catalogue, we identify eight galaxies located within a radius of 1.5′ from the peak of the X-ray emission which all have a photometric redshift estimate of about 0.38. Based on this information, we estimate the photometric redshift of the cluster to be zphot = 0.38 ± 0.04.
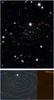 |
Fig.A.2 Reduced images for PLCK G285.0−23.7, based on archival data. Top: combined V and R-band images taken from ESO archives (SUSI2 data). Bottom: combined F814W and F606W images taken from WFPC2 archival data. The XMM-Newton iso-contours are overlaid. |
A.2. PLCK G285.0−23.7
After a detailed search in the ESO archive5 of all existing observations within 5′ around the location of PLCK G285.0−23.7, we found ten images taken with SUSI2 and three spectra taken with EMMI, all obtained at the ESO-NTT 3.5 m telescope6. The first panel in Fig. A.2 shows the resulting colour composite of the central region of this cluster, based on V (1600 s) and R band (1680 s) images with the SUSI2 instrument at NTT.
Publicly-available WFPC2 images for this region also exist in the HST archive7. The second panel in Fig. A.2 shows the reduced colour composite based on the F814W and F606W filter images. Both images have an integration time of 1200 s. From the colour–redshift relation for those images, we derived a redshift for this cluster of z ~ 0.37.
A.3. PLCK G286.3−38.4
After a detailed search in the ESO archive of all existing observations within 5′ around the location of PLCK G286.3−38.4, nine images (NTT/SUSI2), and three spectra (NTT/EMMI) were found. The spectroscopic data from NTT/EMMI are associated with a proposal to characterise the optical counterpart of a potential galaxy cluster associated with the X-ray source RXJ0359.1−7205.
We undertook data reduction of the three EMMI spectra using standard iraf routines. Figure A.3 shows the combined final spectrum. Although this spectrum has a very low signal-to-noise ratio, a preliminary redshift estimate could be obtained from cross-correlating the reduced spectrum with a reference template spectrum for an early-type galaxy (taken from http://www.arcetri.astro.it/~k20/), using the iraf routine fxcor. The derived redshift estimate is z = 0.307 ± 0.003, although the significance of the cross-correlation peak is very low. Nevertheless, this redshift estimate is apparently compatible with the preliminary identification of two absorption features (Hβ and Mg-I) in the reduced spectrum (see Fig. A.3), which gives us more confidence in the result.
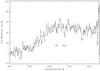 |
Fig.A.3 Reduced spectrum for PLCK286.0-38.4, based on the EMMI data obtained from ESO archives. A cross-correlation analysis yields a redshift of z = 0.307, which is consistent with the preliminary estimate of the two absorption features Hβ and Mgi which are also indicated in the figure. |
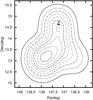 |
Fig.B.1 Projected luminosity density map for the best supercluster candidate. The X-ray sources are marked by triangles, the SZ source by the cross. The minimum density level and the level step are 1011 L⊙ per square degree. |
Appendix B: Search for large scale structure in the field of PLCK G214.6+36.9 using SDSS
We searched for superclusters in the direction of PLCK G214.6+36.9 by calculating the luminosity density field of the spectroscopic sample of luminous red galaxies (LRG) from the SDSS DR7. To correct for the finite width of the survey magnitude window, galaxy luminosities were weighted. Superclusters are delineated by an appropriate luminosity density level. For the LRG superclusters, we set this level at 3.0 times the mean density. This level was obtained by comparing the SDSS main galaxy sample superclusters with those in the LRG sample in the volume where these samples overlap. The procedure is explained in detail in Liivamägi et al. (2010).
The best candidate is a supercluster containing 10 LRGs with a mass centre at RA = 137°̣5, Dec = 13°̣6, lying at z = 0.45. Since each LRG likely indicates the presence of a galaxy cluster (like the two LRGs that lie in the observed X-ray clusters) the supercluster is likely to contain 10 clusters. The estimated total luminosity of the supercluster is 3 × 10¹²L⊙, the maximum extent about 70 h-1 Mpc. The co-moving distance along the line-of-sight between the two LRGs hosted by the X-ray clusters is about 4.1 h-1 Mpc. Using a M/L value of 200 (in solar units), the total mass of the supercluster is about 1015 M⊙. This supercluster is typical among other LRG superclusters at that distance. Figure 12 shows the projected luminosity density contours of the candidate supercluster, together with the location of the PLCK G214.6+36.9 and the X-ray clusters.
All Tables
All Figures
|
Fig.1 Sensitivity of XMM-Newton observations to typical Planck SZ sources. The expected signal-to-noise ratio (S/N) of the cluster detection in the [0.3–2] keV energy band with the epic camera is plotted as a function of redshift for an exposure time of 10 ks assuming two typical SZ fluxes. See text for details of the model assumed to convert SZ to X-ray flux and count rate. The dash-dotted line indicates the S/N required for 10% uncertainty on the temperature measurement of an 8 keV cluster. |
| In the text | |
|
Fig.2 Surface brightness profile of PLCK G4.5-19.5 at z = 0.54, the highest-z cluster of the sample, as measured with XMM-Newton. The data of the emos12 and epn camera in the [0.3–2.] keV energy band are combined. The green line indicates the best fitting model (see text); the red line is the best fitting model convolved with the point spread function (PSF) of XMM-Newton and the dashed line is the on axis XMM/PSF, normalised to the central intensity. The source is clearly extended. |
| In the text | |
|
Fig.3 XMM-Newton images of all confirmed cluster candidates, except for the two triple systems which are shown on Fig. 12 and discussed in Sect. 7, in the [0.3–2] keV energy band. The observations of PLCK G272.9+48.8 and PLCK G250.0+24.1 suffer from high background that has only been crudely subtracted. Image sizes are 3θ500 on a side, where θ500 is estimated from the M500–YX relation (see Sect. 5.1). Images are corrected for surface brightness dimming with z, divided by the emissivity in the energy band, taking into account galactic absorption and instrument response, and scaled according to the self-similar model. The colour table is the same for all clusters, so that the images would be identical if clusters obeyed strict self-similarity. The majority of the objects show evidence for significant morphological disturbance. A yellow cross indicates the Planck position and a red/green plus sign the position of a RASS-BSC/FSC source. |
| In the text | |
|
Fig.4 Illustration of the XMM-Newton validation procedure results for a false candidate, PLCK G226.1−16.9. Top panels: sum of the emos and epn raw image (left) and reconstructed epn image (right) in the soft band. The circle of 5′ radius centred on the Planck position (green cross) corresponds to the conservative position error box. The RASS-FSC source is clearly detected (red cross) as a point source: its surface brightness profile (black points in left bottom panel) is well fitted by the XMM-Newton PSF (red line). Two extended sources labelled A and B are also detected. Bottom right panel: same as Fig. 2 for source B. |
| In the text | |
|
Fig.5 Top row: redshift determination from XMM-Newton spectroscopy in the kT-z plane. Red, green and blue contours trace 68, 95 and 99.9 percent confidence levels, respectively. The black error point shows the final best-fitting spectral results with associated statistical errors. Bottom row: epicemos12 (red and black points) and epn (green points) spectra. Only the data points above 2keV are shown for clarity but data down to 0.3keV are used in the spectral fitting. The line is the thermal model for the best-fitting redshift. The position of the redshifted Fe K line is marked. From left to right the figures are for sources PLCK G100.2−30.4, PLCK G277.8−51.7 and PLCK G241.2−28.7. |
| In the text | |
|
Fig.6 Distance of blind SZ position to X-ray position, DSZ−X, as a function of DSZ−X, normalised to the cluster size θ500,X for single confirmed systems. The clusters are colour-coded according to redshift. Note that the offset is typically less than 2′ and always less than θ500. |
| In the text | |
|
Fig.7 Comparison of the Planck blind and X-ray constrained Y500 measurements for single confirmed systems (see text, Sect. 5.2). The ratio is correlated with the ratio of the corresponding characteristic size, θ500. |
| In the text | |
|
Fig.8 Unabsorbed RASS flux versus XMM-Newton flux for the 17 confirmed single-component clusters. The [0.1–2.4] keV flux is measured within an aperture of θ500. Clusters coincident with a RASS-BSC or a RASS-FSC source are marked with red squares and green diamonds, respectively. The most significant outlier at high flux is PLCK G18.7+23.6 at z = 0.09 (see Sects. 6.1 and 6.2 for discussion). |
| In the text | |
|
Fig.9 The new SZ-discovered Planck clusters compared to clusters from the ROSAT All-Sky Survey catalogues in the LX–z plane. The X-ray luminosity is that in the [0.1–2.4] keV band. Catalogues shown are the REFLEX, NORAS, BCS, eBCS and published MACS catalogues. The solid line is the REFLEX flux limit of 3 × 10-12 ergs-1 cm-2, similar to that of the BCS+eBCS catalogues. The dotted line is the HIFLUCGS flux limit of 2 × 10-11 ergs-1 cm-2 and the dashed line is from the MACS flux limits. See Sect. 6.2 for references and details. |
| In the text | |
|
Fig.10 Scaled density profiles of the new Planck SZ clusters compared to those of similar mass systems from the representative X-ray samples REXCESS (Böhringer et al. 2007) and EXCPRES (Arnaud et al., in prep.). R500 is estimated from the M500–YX relation of Arnaud et al. (2010). Thick lines show the mean profile of each sample. The density profiles of the Planck SZ-selected clusters are on average shallower than those of the X-ray selected clusters of the same mass. |
| In the text | |
|
Fig.11 Scaling relations for the 17 new confirmed single-component clusters (red symbols).
Black points show clusters in the Planck-ESZ sample with
XMM-Newton archival data as presented in Planck Collaboration (2011g). The solid black line denotes the
corresponding scaling relation fits in each panel. The blue lines in the top
and bottom right panels denote the predicted
Y500 scaling relations from the REXCESS X-ray
observations (Arnaud et al. 2010). The blue
line in the bottom left panel is the Malmquist bias corrected
M–L relation from the REXCESS sample (Pratt et al. 2009; Arnaud et al. 2010). In all figures,
R500 and M500 are
estimated from the M500–YX
relation of Arnaud et al. (2010). Top
row: relation between apparent SZ signal
(Y500, left) or intrinsic Compton
parameter ( |
| In the text | |
|
Fig.12 The triple systems PLCK G214.6+37.0 (top) and PLCK G334.8−38.0 (bottom). The left panels show the PlanckYSZ map (derived from an Internal Linear Combination method) with contours from the XMM-Newton wavelet filtered [0.3–2] keV image (middle panels) overlaid in white. The cross marks the position of the re-extraction centre for flux re-analysis. Extended components found in the XMM-Newton image are marked with letters (see text and Table 2). The circles in each XMM-Newton image denote the estimated R500 radius for each component. The right panels show the X-ray surface brightness profiles of the three components for each super cluster (points with uncertainties), and the best-fitting β-model (solid lines) compared to the profile of the PSF normalised at the central level (dashed lines). |
| In the text | |
|
Fig.A.1 RGB colour–composite image of the optical counterpart of cluster PLCK G100.2-30.4, as obtained with the IAC80 telescope. R, G, B colours are g,r and i-band Sloan filters, respectively. Although the IAC80 field of view is 7′, this image is trimmed to 4.8′ × 2.7′, and is centred at the XMM-Newton counterpart (white iso-contours). Red galaxies defining the red-sequence of the cluster are clearly seen at the centre of the image. |
| In the text | |
|
Fig.A.2 Reduced images for PLCK G285.0−23.7, based on archival data. Top: combined V and R-band images taken from ESO archives (SUSI2 data). Bottom: combined F814W and F606W images taken from WFPC2 archival data. The XMM-Newton iso-contours are overlaid. |
| In the text | |
|
Fig.A.3 Reduced spectrum for PLCK286.0-38.4, based on the EMMI data obtained from ESO archives. A cross-correlation analysis yields a redshift of z = 0.307, which is consistent with the preliminary estimate of the two absorption features Hβ and Mgi which are also indicated in the figure. |
| In the text | |
|
Fig.B.1 Projected luminosity density map for the best supercluster candidate. The X-ray sources are marked by triangles, the SZ source by the cross. The minimum density level and the level step are 1011 L⊙ per square degree. |
| In the text | |
Current usage metrics show cumulative count of Article Views (full-text article views including HTML views, PDF and ePub downloads, according to the available data) and Abstracts Views on Vision4Press platform.
Data correspond to usage on the plateform after 2015. The current usage metrics is available 48-96 hours after online publication and is updated daily on week days.
Initial download of the metrics may take a while.