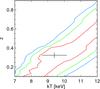
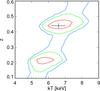
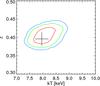
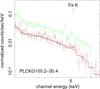
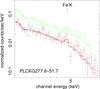
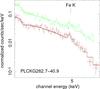
Fig.5

Top row: redshift determination from XMM-Newton spectroscopy in the kT-z plane. Red, green and blue contours trace 68, 95 and 99.9 percent confidence levels, respectively. The black error point shows the final best-fitting spectral results with associated statistical errors. Bottom row: epicemos12 (red and black points) and epn (green points) spectra. Only the data points above 2keV are shown for clarity but data down to 0.3keV are used in the spectral fitting. The line is the thermal model for the best-fitting redshift. The position of the redshifted Fe K line is marked. From left to right the figures are for sources PLCK G100.2−30.4, PLCK G277.8−51.7 and PLCK G241.2−28.7.
Current usage metrics show cumulative count of Article Views (full-text article views including HTML views, PDF and ePub downloads, according to the available data) and Abstracts Views on Vision4Press platform.
Data correspond to usage on the plateform after 2015. The current usage metrics is available 48-96 hours after online publication and is updated daily on week days.
Initial download of the metrics may take a while.