| Issue |
A&A
Volume 699, July 2025
|
|
|---|---|---|
| Article Number | A334 | |
| Number of page(s) | 17 | |
| Section | Extragalactic astronomy | |
| DOI | https://doi.org/10.1051/0004-6361/202554823 | |
| Published online | 18 July 2025 | |
MICONIC: JWST/MIRI MRS reveals a fast ionized gas outflow in the central region of Centaurus A
1
Centro de Astrobiología (CAB), CSIC-INTA, Camino Bajo del Castillo s/n, E-28692 Villanueva de la Cañada, Madrid, Spain
2
Telespazio UK for the European Space Agency (ESA), ESAC, Camino Bajo del Castillo s/n, 28692 Villanueva de la Cañada, Spain
3
Sorbonne Université, CNRS, UMR 7095, Institut d’Astrophysique de Paris, 98bis bd Arago, 75014 Paris, France
4
Institut Universitaire de France, Ministère de l’Enseignement Supérieur et de la Recherche, 1 rue Descartes, 75231 Paris Cedex 05, France
5
European Space Agency, c/o Space Telescope Science Institute, 3700 San Martin Drive, Baltimore MD 21218, USA
6
UK Astronomy Technology Centre, Royal Observatory, Blackford Hill Edinburgh, EH9 3HJ, Scotland, UK
7
Observatorio Astronómico Nacional (OAN-IGN)-Observatorio de Madrid, Alfonso XII, 3, 28014 Madrid, Spain
8
Sterrenkundig Observatorium, Universiteit Gent, Krijgslaan 281 S9, B-9000 Gent, Belgium
9
Leiden Observatory, Leiden University, PO Box 9513, 2300 RA Leiden, The Netherlands
10
Centro de Astrobiología (CAB), CSIC-INTA, Ctra. de Ajalvir km 4, Torrejón de Ardoz, 28850, Madrid, Spain
11
I. Physikalisches Institut der Universität zu Köln, Zülpicher Str. 77, D-50937 Köln, Germany
12
Max-Planck-Institut für Radioastronomie (MPIfR), Auf dem Hügel 69, D-53121 Bonn, Germany
13
Department of Astronomy, Stockholm University, The Oskar Klein Centre, AlbaNova, SE-106 91 Stockholm, Sweden
14
LIRA, Observatoire de Paris, Université PSL, Sorbonne Université, Université Paris Cité, CY Cergy Paris Université, CNRS, 92190 Meudon, France
15
Max Planck Institute for Astronomy, Königstuhl 17, 69117 Heidelberg, Germany
16
Centre for Extragalactic Astronomy, Durham University, South Road, Durham DH1 3LE, UK
17
Dept. of Astrophysics, University of Vienna, Türkenschanzstr. 17, A-1180 Vienna, Austria
18
ETH Zürich, Institute for Particle Physics and Astrophysics, Wolfgang-Pauli-Str. 27, 8093 Zürich, Switzerland
19
Université Paris-Saclay, Université Paris Cité, CEA, CNRS, AIM, 91191 Gif-Sur-Yvette, France
⋆ Corresponding author: This email address is being protected from spambots. You need JavaScript enabled to view it.
Received:
28
March
2025
Accepted:
27
May
2025
Abstract
We present a kinematical study of the ionized and molecular gas in the central region (∼7–14″∼100–200 pc) of the nearby radio galaxy Centaurus A (Cen A). We used JWST/MIRI MRS ∼5−28 μm observations taken as part of the Mid-Infrared Characterization of Nearby Iconic galaxy Centers (MICONIC) of the MIRI European Consortium. The two gas phases present contrasting morphologies and kinematics in Cen A. The brightest emission from the ionized gas, traced with a range of ionization potential (IP) lines analyzed here (from [Fe II] to [Ne VI]), is extended along the direction of the radio jet. We also detected emission from low IP emission lines and H2 transitions in the galaxy disk region mapped with MRS. Both gas phases present rotational motions in the disk but also complex kinematics. The MRS observations reveal several ionized gas kinematical features that are consistent with simulation predictions of a jet-driven bubble and outflow interacting with the galaxy interstellar medium. These include broad components in the nuclear line profiles (σ∼600 km s−1 in [Ar II] and [Ne III]), high velocities (reaching approximately +1000, −1400 km s−1) confined within the nuclear region, velocities of hundreds of kilometers per second in several directions in the central 2″, and enhanced velocity dispersions perpendicular to the radio jet. Moreover, we find evidence of shock excitation in the nuclear region of Cen A based on mid-infrared line ratios. We compared the ionized gas mass outflow rate with Cen A's active galactic nucleus (AGN) luminosity and radio jet power and demonstrate that both mechanisms provide sufficient energy to launch the outflow. The noncircular motions observed in the mid-infrared H2 lines can be reproduced with either a warped rotating disk model or a radial component. The latter might be to related to gas streamers detected in cold molecular gas. Notably, there is no clear indication of a fast nuclear H2 outflow in Cen A, only a weak blueshifted component in the line profiles. This could be due to a relatively low nuclear warm H2 column density and/or the limited geometrical coupling of Cen A's inner radio jet with the circumnuclear disk of the galaxy.
Key words: galaxies: active / galaxies: evolution / galaxies: ISM / galaxies: individual: Centaurus A / galaxies: nuclei
© The Authors 2025
 Open Access article, published by EDP Sciences, under the terms of the Creative Commons Attribution License (https://creativecommons.org/licenses/by/4.0), which permits unrestricted use, distribution, and reproduction in any medium, provided the original work is properly cited.
This article is published in open access under the Subscribe to Open model. This email address is being protected from spambots. You need JavaScript enabled to view it. to support open access publication.
1. Introduction
Low- and intermediate-power radio jets, Pjet∼ 1043−1044 erg s−1, are now being recognized as playing an important role in driving ionized and molecular outflows in active galactic nuclei (AGNs). There are many nearby examples of multiphase outflows in radio-quiet Seyferts and low luminosity AGNs (LLAGNs) where the radio jet may play an important role. Evidence for this is provided by optical (Cresci et al. 2015; Venturi et al. 2021; Cazzoli et al. 2022; Peralta de Arriba et al. 2023; Hermosa Muñoz et al. 2024b), infrared (Pereira-Santaella et al. 2022; Dasyra et al. 2024; Zhang et al. 2024), and (sub)millimeter (e.g., García-Burillo et al. 2014; Morganti et al. 2015; Audibert et al. 2019) observations. How radio jet driven outflows compare with those driven by AGN radiation, how significantly they modify the gas properties in their host galaxies, and how they affect their evolution via negative and/or positive feedback are still open questions (see the review by Harrison & Ramos Almeida 2024).
Centaurus A (hereafter Cen A, also known as NGC 5128) is the nearest (distance of 3.5 Mpc, 1″ = 17 pc, Neumayer et al. 2007) radio galaxy (see Israel 1998, for a review). It has a modest AGN bolometric luminosity Lbol(AGN)≃1−4×1043 erg s−1 (Israel 1998; Beckmann et al. 2011), and a large-scale radio jet extending over a few hundred kiloparsecs. On the nuclear scales of interest for this work (inner ∼200 pc), the jet is oriented at a position angle of PAjet = 51° and displays apparent subluminal motions (Clarke et al. 1992; Hardcastle et al. 2003). It appears to be nearly perpendicular to the disk on scales of the circumnuclear disk detected in cold molecular gas (projected size of 20″×10″, see Espada et al. 2017). The present-day power of its radio jet is estimated to be on the order of Pjet∼1−2×1043 erg s−1 (see e.g., Croston et al. 2009; Wykes et al. 2013; Neff et al. 2015).
Simulations of low-intermediate power radio jets similar to Cen A predict fast outflows in the hot and warm (ionized) gas, even when the jet is launched perpendicular to the disk of the galaxy. Jet-inflated bubbles can interact with the interstellar medium (ISM) in the galaxy disk, producing both inflows and outflows (see e.g., Mukherjee et al. 2016, 2018; Talbot et al. 2022; Meenakshi et al. 2022; Borodina et al. 2025). These studies also demonstrated that the jet-driven outflow properties depend strongly on the jet power, its relative orientation with respect to the galaxy disk, and surrounding ISM properties.
In this work we analyze spatially resolved kinematics of the ionized and warm molecular gas in the central (∼7−14″∼100–200 pc) region of Cen A. We used mid-infrared (mid-IR) observations obtained with the Mid-Infrared Spectrometer (MRS: Wells et al. 2015; Argyriou et al. 2023) of the Mid-InfraRed Instrument (MIRI: Rieke et al. 2015; Wright et al. 2015, 2023) on board the James Webb Space Telescope (JWST: Gardner et al. 2023). This work is part of the guaranteed time observations (GTO) program termed Mid-Infrared Characterization of Nearby Iconic galaxy Centers (MICONIC) of the MIRI European Consortium. The other targets in this program are Mrk 231 (Alonso Herrero et al. 2024), Arp 220 (Buiten et al. 2025, and also van der Werf et al. in prep.), NGC 6240 (Hermosa Muñoz et al. 2025), SBS0335-052, and the region surrounding SgrA*. Two companion papers with MIRI-MRS observations of Cen A study the distribution, temperature, and excitation of the warm molecular gas H2 (Evangelista et al. in prep.) and properties of the polycyclic aromatic hydrocarbons (PAH) features (Pantoni et al. in prep.).
The proximity of Cen A provides a unique opportunity to study the impact of the radio jet on the ionized and molecular gas, at physical scales relatively close to its launch region. Because Cen A is crossed by a prominent dust lane, most of the detailed morphological and kinematic studies of the gas in its central region (several hundreds of parsecs) have utilized near-infrared (near-IR) and (sub)millimeter observations (see e.g., Marconi et al. 2000; Neumayer et al. 2007; Krajnović et al. 2007; Espada et al. 2009, 2017). Within the inner ∼20″, the cold molecular gas is distributed in several components, including a circumnuclear disk (CND) with a projected size of 20″×10″, a 9″×6″ nuclear ring that is approximately covered by our MRS observations, nuclear filaments within this ring, and a nuclear disk of a few parsecs in size (Espada et al. 2017). On these scales, the hot and cold molecular gas, as traced with the H2 J = 1–0 S(1) 2.12 μm and CO(3–2) transitions, respectively, shows rotational motions together with complex noncircular motions. The latter were attributed to different processes, including the presence of a nuclear warped disk (Neumayer et al. 2007) or streaming motions, which might be produced by a putative nuclear bar (Espada et al. 2017). The emission of the near-IR high excitation line [Si VI] was found to be extended along the direction of the radio jet, and its kinematics were explained by a backflow of gas accelerated by the radio jet (Neumayer et al. 2007). Other mechanisms, such as a nuclear outflow, a warp, or non-axisymmetric perturbations, were also proposed to explain the kinematics of the near-IR [Fe II] line (Krajnović et al. 2007). Previous Spitzer/IRS spectral mapping with limited angular resolution revealed that the emission of mid-IR high ionization lines, such as, [O IV] and [Ne V], is extended over 20–25″ on each side of the AGN and at an orientation near the radio jet (Quillen et al. 2008) but had limited spatial resolution. With the high angular resolution and sensitivity achieved with MIRI-MRS, in this work we study Cen A's gas kinematics in the mid-IR with physical resolutions of approximately 5-10 pc.
This paper is organized as follows. Section 2 describes the MIRI-MRS observations and data analysis. In Sect. 3 we present the results for the nuclear emission, the extended emission, and the modeling of the molecular and ionized gas kinematics. We discuss and summarize the main results in Sect. 4.
2. MIRI-MRS observations
2.1. Data reduction
The MIRI-MRS observations were taken as part of program ID 1269 covering the full ≃5−28 μm spectral range and consisted of a 2×1 mosaic (see Fig. 1). We used a four point dither pattern for extended sources in each of the mosaic pointings, with a total integration time of 600 s per mosaic pointing, in FASTR1 readout mode. We also obtained background observations with a two point dither, extended source pattern, with a 300 s of total integration time. We reduced the MRS data using version 1.13.4 of the JWST Science Calibration Pipeline (Bushouse et al. 2023), and the files from context 1185 of the Calibration References Data System (CRDS). We followed the standard MRS pipeline procedure (Dicken et al. 2022; Morrison et al. 2023; Argyriou et al. 2023; Gasman et al. 2023; Patapis et al. 2024) for the galaxy and background observations and produced drizzled data cubes (Law et al. 2023) with the default spaxel scales of 0.13, 0.17, 0.20, and 0.35″ for channels 1, 2, 3, and 4 (ch1, ch2, ch3, and ch4, hereafter).
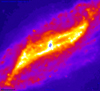 |
Fig. 1. Spitzer/IRAC image at 8 μm of the central ∼3.7′×3.4′ region of Cen A. The footprints of the MIRI-MRS observations (blue rectangles) are shown. Orientation is north up, east to the left. Figure generated with the Astronomer's Proposal Tool (APT) version 2025.1. |
During the pipeline reduction, we switched off the background corrections and sky matching. Following Pereira-Santaella et al. (2022), we created a background image per spectral element by computing the median of all the spaxels of the fully reduced background cubes, which we then subtracted from the on-source cubes on a spaxel-by-spaxel basis. We generated the reconstructed data cubes with the usual orientation of north up, and east to the left. The resulting fields of view (FoV) cover approximately the central ≃6.6″×8.5″ to 13″×14.4″ for ch1 and ch4, respectively. In Fig. 1 we overlay the ch4 FoV on the Spitzer/IRAC 8 μm image showing the dusty parallelogram-shape structure (see Quillen et al. 2006).
2.2. Data analysis
Cen A shows a strong point-like continuum source at the AGN position with a full width at-half-maximum (FWHM) in ch1-short of 0.3″. Thus, to isolate the nuclear unresolved emission, we extracted spectra using an aperture of 2×FWHM and applied the corresponding point source correction. The resulting spectra are plotted separately for each channel in Fig. 2 and the full spectrum in Fig. A.1. We only needed to apply a small scaling factor to stitch together the ch1-short portion with that of ch1-medium. We marked the numerous fine structure lines and H2 0–0 S(1) to S(8) transitions detected in the nuclear region of Cen A. For the analysis of the excitation properties of the ionized gas in the nuclear region of Cen A (Sect. 3.3) we fit the lines using only a single Gaussian and a local continuum. The fluxes and FWHM of the fine (FWHMline) structure lines analyzed in this work are presented in Table 1.
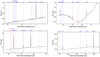 |
Fig. 2. MIRI-MRS spectra of Cen A extracted as a point source for ch1 (upper left), ch2 (upper right), ch3 (lower left), and ch4 (lower right). The lines mark fine-structure emission lines (blue and green), hydrogen recombination lines (red), and rotational H2 0–0 lines (magenta). |
Fine-structure lines.
The fine-structure lines from the unresolved region are not fully accounted for with a single Gaussian component. We thus performed additional fits using a local continuum and a maximum of three Gaussian components. Details of the method are discussed by Hermosa Muñoz et al. (2024b,a). To determine statistically the number of Gaussians needed to improve a fit, we computed the ratio between the standard deviations of the continuum underneath the line after subtracting the Gaussian modeling and that of the continuum adjacent to the line, ϵ. As reference, values of ϵ>3 are generally taken as an indication that an extra component is needed for the fit (see Cazzoli et al. 2018; Hermosa Muñoz et al. 2024b). We show in Figs. 3 and 4 the results for the brightest lines in ch1 ([Ar II] and H2 S(5) at 6.909 μ) which has the highest spectral resolution as well as for ch3 line [Ne III] in Fig. A.2.
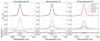 |
Fig. 3. Parametric fits of the [Ar II] line profile from the spectrum extracted as a point source. Fits are (left to right) with one, two, and three Gaussians plus a local continuum. The top panel shows the total fit and the individual Gaussians and the bottom the residuals of the fit. The vertical lines in the main panel indicate the continuum regions and the horizontal lines in the bottom panel ±3×scont, where scont is the local continuum standard deviation. The corresponding parameters of each fit are listed in Table A.1. |
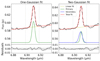 |
Fig. 4. Same as Fig. 3, but for H2 S(5) and fits only with one and two Gaussians (see text and Table A.1 for more details). |
For the brightest fine structure lines and the H2 transitions we generated maps using the Python tool ALUCINE (Peralta de Arriba et al. 2023). This tool fits, on a spaxel-by-spaxel basis, the selected line using a user-specified number of Gaussian components and a local continuum. We started by smoothing the fully reduced data cubes with a 2×2 spaxel average box to increase the signal-to-noise ratio before fitting the lines. For this analysis we used one and two Gaussians for the fits and specified a threshold value of amplitude over noise of 3 for the line detection. The outputs are maps of the fit line intensity, velocity peak of the line (mean velocity field), and velocity dispersion. We corrected the last quantity by subtracting in quadrature the instrumental resolving powers (σinst) at the corresponding line wavelength for ch1 and ch2 (Argyriou et al. 2023) and the updated values for ch3 and ch4 (Pontoppidan et al. 2024; Banzatti et al. 2025). The velocity fields are computed using a redshift value of z = 0.001825 or a corresponding value of the systemic velocity of vsys = 547 km s−1. Maps produced with a single Gaussian for H2 S(5) and H2 S(1) are in Fig. 5 and for [Ar II], [Ne VI], [Ne III], and [O IV] in Fig. 6, while other lines of interest, namely, [Fe II] at λrest = 5.34 μm, [Ne II], [S IV], [Ne V] at λrest = 14.32 μm, and [S III] are in Fig. A.3. We show the [Ar II] maps fit with two Gaussians in Fig. A.4.
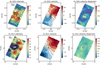 |
Fig. 5. Maps of H2 S(5) at 6.909 μm (top) and H2 S(1) at 17.03 μm (bottom) constructed as explained in Sect. 2.2. Panels show the intensity and contours in a square root scale in arbitrary units (left), the mean-velocity field in units of km s−1 (middle), and the velocity dispersion map σ (corrected for instrumental resolution) in units of km s−1 (right). The velocity contours are in a linear scale (solid lines positive values and dashed lines negative values). The star symbol marks the peak of the continuum adjacent to the line, that is, the AGN position. The 0,0 point on the axes refers to the center of the corresponding sub-channel array. North is up and east to the left. |
3. Results
3.1. Line profiles
For the line profiles from the spectra extracted as a point source (this section) and the kinematics modeling (Sect. 3.4) of the fine structure lines, we focus on [Ar II] and [Ne III] because other bright lines, such as, [Ne II], [Ne V], [O IV], have nearby features, that is, the 12.7 μm PAH feature (although it is not detected or is faint in the nuclear region), [Cl II] at λrest = 14.37 μm, and [Fe II] at λrest = 25.99 μm, respectively.
Fits with three Gaussians are preferred to those with one or two components for both [Ar II] and [Ne III], in terms of a visual inspection of the residuals (Figs. 3 and A.2) and the ϵ parameter (see Table A.1). The broadest components (corrected for instrumental broadening) have FWHMline≃1425−1650 km s−1. To our knowledge, the recent work by Marconcini et al. (2025) and this paper report, for the first time, ionized gas broad lines for Cen A, which are likely associated with an outflow driven by the radio-jet and/or the AGN (see Sect. 3.5). These FWHM values are larger than in some Seyfert galaxies, which have typically FWHMline≪1000 km s−1 for the low ionization potential (IP) lines (Pereira-Santaella et al. 2022; Álvarez-Márquez et al. 2023; Armus et al. 2023) observed with MIRI MRS. On the other hand, such broad components are present in two local LLAGNs (Goold et al. 2024), several regions close to the radio lobes (scales of ∼1 kpc) and along the jet (scales of hundreds of parsecs) in the radio galaxy and Seyfert IC 5063 (Dasyra et al. 2024) as well as the z∼4 luminous radio galaxy TNJ1338-1942 (Roy et al. 2024).
In contrast to the ionized gas, the nuclear H2 S(5) line profile of Cen A is well fit with a single Gaussian with σ = 83 km s−1 (left panel of Fig. 4). While adding an extra component improves slightly the fit, it would not be deemed necessary according to the ϵ criterium. A similar behavior for the line widths in Cen A was already noted in the near-IR by Neumayer et al. (2007) and has been observed in radio-loud AGNs with fast nuclear ionized outflows (e.g., UGC 8782, Costa-Souza et al. 2024) and the LLAGN NGC 4395 (Nandi et al. in prep.).
3.2. Spatially resolved gas morphology and kinematics
In this section we describe the morphology and kinematics of the extended emission of the ionized and molecular gas.
3.2.1. Results from single Gaussian fits
The intensity maps of the H2 transitions and the fine structure lines are strikingly different, as can be seen from Figs. 5 and 6 (also Fig. A.3). The warm molecular gas traced by H2 S(1) appears to be distributed in a ring-like structure with some bright knots and is approximately coincident with the nuclear ring identified in cold molecular gas, which has a size of 9″×6″ (Espada et al. 2017). However, the higher excitation S(5) transition bright clumps are mostly within the ring seen in S(1), which might be associated with the 2″-diameter nuclear disk (Espada et al. 2017). We refer the reader Evangelista to et al. (in prep.) for a detailed analysis of the H2 emission. On the other hand, the brightest emission of the ionized gas lines, from the coronal line [Ne VI] to the low IP [Ar II] line (Fig. 6), has an ionization-cone-like morphology. It is clearly oriented in the direction of the radio jet on these scales (PAjet = 51o, Clarke et al. 1992), as found for other lines in the near-IR (Marconi et al. 2000; Krajnović et al. 2007; Neumayer et al. 2007). The [Fe II] emission (Fig. A.3, top) shows bright emission coming from an unresolved source centered at the AGN position and extended emission along the cone and galaxy disk.
The [O IV] line emission map fills the entire MRS FoV along the jet direction with a projected size along the cone axis of approximately 6″ or 100 pc (see Fig. 6). Some of the extended [O IV] and [S III] morphology to the north of the AGN position resembles the Paα and Paβ knots detected at approximately 2 and 3″ away from the nucleus (see Marconi et al. 2000; Krajnović et al. 2007). The region mapped with MRS is only a portion of a much larger ionized gas structure observed in Spitzer/IRS spectral maps of [O IV] and [Ne V] at λrest = 24.32 μm, which extends over at least 45″ or 765 pc (Quillen et al. 2008). Low IP bright lines (e.g., [Ar II], [Ne III], [S III]) present additional emission in the galaxy disk region, covering an approximate projected size of up to 11 ″ (185 pc) along the major axis. Again, this is only the inner part of the much larger scale star-forming warped disk (Quillen et al. 2008).
We also constructed [Ne V]/[Ne II] and [Ne III]/[Ne II] line ratio maps (see Fig. 7). At the AGN position, the ratios are lower than in the direction of the radio jet, including the Paα and Paβ knots. These values are closer to those observed in some Seyfert nuclei where AGN photoionization might dominate (see Fig. 8 and next section). This might indicate that several gas excitation mechanisms are at work. Along the inner part of Cen A disk along the galaxy major axis, [Ne III]/[Ne II] varies between approximately 0.7 and 0.3, which are similar to values observed in disks of nearby Seyfert galaxies (Hermosa Muñoz et al. 2024a; García-Bernete et al. 2024).
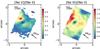 |
Fig. 7. Maps of the [Ne V]/[Ne II] (left) and [Ne III]/[Ne II] (right) ratios from the ALUCINE intensity maps computed with a single Gaussian. Some structure in the form of diffraction rings from the unresolved emission can be seen around the AGN position. |
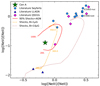 |
Fig. 8. Diagnostic diagram [Ne V]/[Ne II] versus [Ne III]/[Ne II] comparing Cen A's nuclear ratios with literature Seyferts, type 2 QSOs, and LLAGNs. For IC 5063 we include the nuclear and integrated 2–3 kpc ratios. The shock+AGN model track (solid red line) is from Feltre et al. (2023) and the two MAPPINGS V shock models with precursor with the parameters used in that work and two values of the transverse magnetic field of 1 and 10 μG are from Alarie & Morisset (2019) (dashed orange and dotted brown lines, respectively). Numbers next to the curves indicate the shock velocities. See text for more details. |
The mean-velocity fields of the ionized and warm molecular gas (middle panels of Figs. 5, 6, and A.3) display rotational motions, where the velocities vary within a range of approximately −140 km s−1 to +120 km s−1, depending on the line. There are however strong deviations from rotation, which are modeled in Sect. 3.4. The velocity dispersion maps are markedly different for the ionized gas and the warm H2 gas, both in terms of the values and the morphologies. The ionized gas velocity dispersion peaks at the AGN location and is increased in the direction perpendicular to the radio jet (Figs. 6 and A.3, right panels), as observed in several Seyfert galaxies in the optical (see e.g., Venturi et al. 2021) and in the mid-IR with MRS (see e.g., Davies et al. 2024; Zhang et al. 2024). The H2 lines (see Fig. 5) show lower values of the velocity dispersion, with several spaxels in the H2 S(5) map having values close to the instrument spectral resolution σinst≃35 km s−1 for this line1. Additionally, the H2 S(5) velocity dispersion map shows a spiral-like morphology, which might be an indication of material inflowing into the central region (see e.g. Maciejewski 2004, and Evangelista et al. in prep.). On the other hand, the regions with low velocity dispersion values are approximately coincident with the bright H2 S(5) knots.
3.2.2. Results from two Gaussian fits
As explained in Sect. 2.2, we also produced spatially resolved maps fitting the lines with two Gaussians. In general, interpreting this kind of fits can be challenging, since the ordering and classification of the components are not always straightforward. Nevertheless, for each spaxel we ordered them in terms of the line width, with the first component corresponding to the narrow component and the second to the broad one. Focussing on [Ar II] (Fig. A.4), the maps reveal that the central emission of the broad component resembles the shape of this channel point source. This suggests that this component, which has typical values of σ≃230−330 km s−1, originates mostly from an unresolved region. At the MRS ch1-long spatial resolution, this corresponds to a FWHM of approximately 0.35″ or 6 pc for the assumed distance to Cen A. The velocity dispersion of the [Ar II] narrow component retains increased values in regions perpendicular to the radio jet. The results for [Ne III] (not shown) are similar, although the broad component appears to be more extended than in [Ar II].
3.3. Mid-IR line ratios at the AGN position
The nature of the excitation mechanism(s) of the ionized gas in the central region of Cen A has been investigated in several works. The NASA/IPAC Extragalactic Database (NED) gives an optical classification as a Seyfert 2, while optical and near-IR line ratios of the nuclear region seem to indicate low ionization nuclear emission line region (LINER) activity (Storchi-Bergmann et al. 1997; Simpson & Meadows 1998). On the other hand, Bicknell et al. (2013) showed that the near-IR ratios of high IP lines of a blueshifted cloud located a few parsecs away from Cen A nucleus (identified by Neumayer et al. 2007, see also the discussion in Sect. 3.4) cannot be explained with shocks alone and require photoionization by X-ray and UV emission arising from the AGN. We make use of several mid-IR line ratios to assess the ionization mechanism in Cen A's central region.
Figure 8 shows a [Ne V]/[Ne II] versus [Ne III]/[Ne II] diagram comparing Cen A's nuclear line ratios (i.e., those measured in the spectra extracted as a point source, Table 1) together with literature observations for Seyfert nuclei (Pereira-Santaella et al. 2022; Álvarez-Márquez et al. 2023; Armus et al. 2023; Hermosa Muñoz et al. 2024a; Zhang et al. 2024), radio-quiet type 2 QSOs (Ramos Almeida et al. 2025), and two LLAGNs (namely, NGC 1052 and the Sombrero galaxy, Goold et al. 2024). We also included the line ratios integrated over the inner 2−3 kpc of the radio galaxy IC 5063 (Dasyra et al. 2024), as well as our own measurements of the ratios of its nuclear region (log([Ne V]/[Ne II]) = 0.27 and log([Ne III]/[Ne II]) = 0.45). This figure clearly demonstrates that Cen A's nuclear line ratios are intermediate between Seyfert and type 2 QSO nuclei2 and those of LLAGNs. For reference, the outflow regions of some Seyfert galaxies present lower [Ne V]/[Ne II] and [Ne III]/[Ne II] than the nuclear regions (see Pereira-Santaella et al. 2022; Hermosa Muñoz et al. 2024a; Zhang et al. 2024). This may indicate an extra contribution from shocks to the gas excitation. Conversely, the increased neon line ratios in the cone region of Cen A compared with the nuclear values (see Fig. 7) suggests that AGN photoionization might have a higher contribution there.
Notably, the two radio galaxies IC 5063 and Cen A do not present similar neon line ratios, which would suggest different gas excitation mechanisms. Dasyra et al. (2024) concluded that overall the jet has a more important contribution than the AGN radiation for the excitation of the ionized gas in IC 5063, although they did not rule out that the latter mechanism might have a role in the gas excitation in regions previously cleared by the passage of the jet and/or regions being directly impacted by the radio jet. However, Cen A and IC 5063 have Lbol(AGN)/Pjet values of 0.5−4 (see Sect. 1) and 9−16 (Morganti et al. 2015), respectively, which might explain the different neon line ratios. We also note that Cen A is variable in X-rays with a long-term mean AGN bolometric luminosity of 1043 erg s−1, although in the 2015-2020 period it has been in a low luminosity state (see Fig. 5 of Borkar et al. 2021).
We also display in Fig. 8 the AGN+shock model track from Feltre et al. (2023). These models have a 90% contribution to Hβ from fast shocks with velocities from 200 to 1000 km s−1. The shock models were computed by Alarie & Morisset (2019) with the MAPPINGS code (version V, Allen et al. 2008) for a metallicity Z = 0.017, a pre-shock density of nH = 102 cm−3, and a transverse magnetic field strength of 1 μG, and include the contribution of a precursor H II region. We also plot shock models alone (Alarie & Morisset 2019) corresponding to this value of the magnetic field as well as 10 μG. As can be seen from this figure, the shock track with the higher magnetic field extends to the region occupied by Seyfert galaxies. For reference, the extensive AGN photoionization model grid computed by Feltre et al. (2023) covers most of the region in this diagram with log([Ne III]/[Ne II]) > 0 and log([Ne V]/[Ne II]) > −0.5. Cen A's nuclear line ratios are closer to models with an important shock contribution than local Seyferts. One relevant unknown factor in this comparison between observations and shock models with precursor is the strength of the transverse magnetic field.
Enhanced near-IR [Fe II] to hydrogen recombination line ratios have been used to identify shocked regions in galaxies (see e.g., Alonso-Herrero et al. 1997; Rodríguez-Ardila et al. 2005; Colina et al. 2015), which could be associated with supernova remnants or radio jets. We compiled MRS [Fe II]5.34 μm/Pfα line ratios from the literature for Seyfert nuclei (Pereira-Santaella et al. 2022; Álvarez-Márquez et al. 2023; Zhang et al. 2024; Dasyra et al. 2024), LLAGNs (Goold et al. 2024), and circumnuclear shocked regions identified in NGC 7469 (U et al. 2022) and NGC 7319 (Pereira-Santaella et al. 2022). Figure 9 presents the statistical results, where we included the nuclear ratio of Cen A ([Fe II]5.34 μm/Pfα = 4.5, see Table 1) in the LLAGN category. As can be seen from this figure, the nuclear ratio of Cen A appears to be closer to LLAGN and shocked regions than Seyfert nuclei, as infered from the neon line ratios.
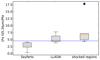 |
Fig. 9. [Fe II]/Pfα box plot for Seyfert nuclei, LLAGNs including Cen A's nuclear region, and shocked regions. The boxes comprise values from the first to the third quartiles of the distribution, the line inside the box is the median value, and the vertical lines contain 99.3% of the distribution. The outlier point in the shocked region class is the N2 jet impacted region of NGC 7319 (Pereira-Santaella et al. 2022). The blue dashed line represents the nuclear value for Cen A. The rest of references for the literature data are in text. |
From this empirical comparison based on mid-IR line ratios, we conclude that both shocks and AGN photoionization contribute to the gas excitation in the nuclear region and along the jet direction of Cen A in the inner ∼100 pc, although the former mechanism might have a more relevant role when compared with some local Seyfert nuclei.
3.4. Modeling of the gas kinematics
To model the gas kinematics we used the 3DBAROLO code (Di Teodoro & Fraternali 2015) to fit line emission data cubes with disk models with 3D tilted rings, which is needed owing to the presence of a warped gaseous dusty disk on different physical scales (see e.g., Bland et al. 1987; Quillen et al. 1992, 2006; Eckart et al. 1999; Neumayer et al. 2007; Espada et al. 2009). This code has already been successfully applied to MRS observations of the nearby Seyfert galaxy MCG–05-23-16 (see e.g., Esparza-Arredondo et al. 2025). In this section, we focus on the molecular gas H2 S(5) and S(1) transitions and the ionized gas lines [Ar II] and [Ne III]. The free parameters of a 3DBAROLO disk model are: the kinematic center, vsys, the disk inclination (i), PA of the major axis (PAmaj), the scale height of the disk, the circular velocity (vrot), and the velocity dispersion (σgas). It also accounts for effects related to the beam smearing in the definition of the best-fit model for a given spatial resolution. For each MRS data set, we used the measured spatial FWHM of the smoothed data cubes (Sect. 2.2) as the beam value. For this analysis, we used the continuum subtracted data cubes around the lines produced with the ALUCINE tool (see Sect. 2.2).
The 3DBAROLO code allows the user to fix any of the above parameters. For the kinematic center we took the position of the continuum peak and fixed the scale height of the disk to 0.5″ (20 pc). The latter is within the range estimated by Espada et al. (2017) for Cen A on similar physical scales. The minimum value of σgas was set to the instrumental resolution at the line wavelength. After the first run, we fixed vsys and fit PAmaj, i, vrot, and σgas again. This code also generates maps of the velocity-integrated intensity (moment 0), the mean-velocity field (moment 1), and velocity dispersion field (moment 2) of the observations and best-fit model, as well as position-velocity (p-v) diagrams along the major and minor kinematic axes.
3.4.1. Results for H2 S(5) and H2 S(1)
We started by modeling the H2 S(5) and H2 S(1) transitions because these generally present smaller deviations from rotation than ionized gas lines (see e.g., Davies et al. 2024). For the initial estimates of the PAmaj and i we took values comprised within those compiled by Quillen et al. (2010) in the radial distance range of our observations and let them to vary by ±25o. The H2 S(5) model mean velocity field and residuals computed by subtracting it from the 3DBAROLO moment 1 map are in Fig. 10, left and right top panels, respectively. The latter reveals some deviations from rotational motions, reminiscent of an S-shape centered at the AGN position and more prominent deviations to the northwest (NW). These may be related to gas streamers or filaments detected in cold molecular gas, which connect the CND, which is beyond our MRS observations, and the nuclear ring (see Fig. 4 of Espada et al. 2017). We note that some of the distorsions of the observed velocity field are accounted for with the fit model since there are some variations of the kinematical PAmaj and i (Fig. A.5). These are similar to those of the warped disk model used to explain the kinematics of the hot molecular gas on comparable scales (see Neumayer et al. 2007; Quillen et al. 2010).
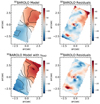 |
Fig. 10. Top: Velocity field of the 3DBAROLO rotating disk model (left) fit to the H2 S(5) transition and residuals computed by subtracting the model from the 3DBAROLO moment 1 map (right). Bottom: Same as top but including a vRAD component in the model. Orientation, color scale, and contours for the velocity models are as in Fig. 5. |
The p–v diagrams along the mean fit kinematic major and minor axes of the nuclear H2 S(5) disk show emission spreading over a range of velocities around vsys of [–150, +180] km s−1 (see Fig. 11). It is noticeable that the minor axis p–v diagram does not present strong deviations from rotation. Within the central ±0.5″, some of the observed velocity structure, which is not reproduced by the model, might be artefacts left from the subtraction of the strong continuum associated with the AGN.
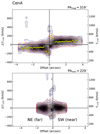 |
Fig. 11. H2 S(5) p–v diagrams extracted along the kinematic major (top) and minor axes (bottom). The gray scale and blue contours are the observations, and red contours represent the fit 3DBAROLO rotating disk model. Yellow dots show the fit rotation curve. In the central ±0.5″, some of the blueshifted velocity structure might be due to residuals left from subtracting the AGN strong continuum. PAmaj is measured from north, counterclockwise, and on the receding half of the galaxy disk. |
To account for the velocity deviations seen between model and observations, we fit a new 3DBAROLO model including a radial velocity (vRAD) component. We allowed this parameter as well as PAmaj, i, vrot, and σgas to vary. We note that a scenario with radial motions over a pure warping of the disk was favored by Espada et al. (2017). The resulting new velocity model and corresponding residuals are presented in Fig. 10 (lower panels). Assuming that the galaxy near side in the inner region of Cen A is to the southwest (SW, see Quillen et al. 2006) and the modeled radial motions are in the disk of the galaxy, this would imply streaming (inflows) motions toward the center of the galaxy, as were suggested by the S-shape seen in the velocity dispersion map (Fig. 5). The residual velocities are slightly smaller when compared with the warped model with no vRAD, except along the minor axis of the galaxy. Nevertheless, the vRAD model reproduces fairly well the emission seen along the minor axis p–v diagram (see Fig. 12, bottom). It is possible that part of the nuclear noncircular motions are also taking place outside the plane of the galaxy. However, these are not strong, given the weak blueshifted components seen in the nuclear H2 line profiles (Fig. 4).
We performed the same analysis for the H2 S(1) line. The residuals left after subtracting 3DBAROLO models without and with a vRAD component (Fig. 13) show that the latter appears to reproduce better the S-like shape distorsion to the NW of the AGN. However, this also produces more blueshifted residuals to the SW. The p-v diagrams (Fig. A.6) are strongly affected by the imperfect continuum subtraction in the inner 2″. Further away, the model without vRAD fits the circular motions along the major axis of the galaxy relatively well, but deviations are present to the southeast of the AGN.
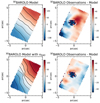 |
Fig. 13. Same as Fig. 10 but for the velocity fields of H2 S(1). Orientation, color scale, and contours for the velocity models are as in Fig. 5. |
In summary, the warm molecular gas kinematics reveal rotation but they are strongly affected by complex noncircular motions. Some can be fit either with a nuclear warped disk or by including a vRAD component (or a combination of both), but some velocity residuals still remain. The radial motions are likely associated with gas streamers towards the center of the galaxy seen in the cold molecular gas (Espada et al. 2017).
3.4.2. Results for [Ar II] and [Ne III]
In this section we fit 3DBAROLO models to the bright ionized gas emission lines [Ar II] and [Ne III]. As for the molecular gas, we fixed the kinematic center, vsys, and in this case, PAmaj and i were only allowed to vary within ±10° of the average values obtained for the H2 S(5) and S(1) line fits without vRAD (Fig. A.5). We fit these two parameters as well as the σgas and vrot.
The residual velocity map after subtracting the fit 3DBAROLO model reveals velocities with strong deviations from a purely rotating disk (see Fig. 14 for [Ar II] and Fig. A.7 for [Ne III]). The velocity residuals resemble the mean-velocity fields of the high IP lines [Ne VI] and [Ne V] (see Figs. 6 and A.3), which likely have a very low rotational component. These are readily understood by inspecting the p–v diagrams (Figs. 15 and A.8) extracted along the kinematic major and minor axes. As already inferred from the nuclear profiles of the two lines (Figs. 3 and A.2), at the AGN position the ionized gas presents fast velocities reaching approximately +1000 km s−1 and −1400 km s−1 along both kinematic axes. These are similar to values detected in the ionized gas of IC 5063 (see Fig. 10 of Dasyra et al. 2024). The fast ionized gas velocities in Cen A are associated with the unresolved second component derived from our spaxel-by-spaxel analysis of the [Ar II] line, which can be seen in the central 2″, approximately (bottom panels of Fig. A.4).
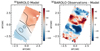 |
Fig. 14. Same as Fig. 10 (top) but for the velocity fields of [Ar II]. Orientation, color scale, and contours for the velocity models as in Fig. 5. |
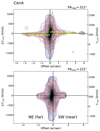 |
Fig. 15. P-v diagrams extracted along the kinematic major axis (top) and minor axis (bottom) for [Ar II]. The disk model does not include a vRAD component. Colors and contours as in Fig. 11. |
At the AGN position, the 3DBAROLO model for [Ar II] reproduces velocities of up to ∼±900 km s−1 by fitting values of σgas∼300 km s−1. At approximate radial distances of 1–2″, and for both lines, there are further deviations from the model circular motions, both blueshifted and redshifted, with velocities of up to 500 km s−1 in the p–v diagrams. This indicates that noncircular motions are probably both in the plane of the galaxy and outside. Finally, along the kinematic major axis at radial distances greater than ≃2″, the gas is rotating with low velocity dispersions compared with the nuclear region.
Neumayer et al. (2007) identified non-rotational motions in the central 1″ of Cen A with the near-IR line [Si VI], which appeared to be more prominent to the SW of the AGN. Indeed, our [Ne VI] mean-velocity map (Fig. 6, second panel from the top) is virtually identical to the coronal line [Si VI] velocity field (their figure 3). These authors interpreted the blueshifted component as a backflow of gas which was accelerated by the radio jet. Furthermore, they pointed out that such behavior is predicted by jet simulations on larger physical scales. From these new MRS observations, we conclude that the majority of noncircular motions of several hundreds of kilometers per second in the ionized gas, which are observed in several directions within the inner region, are likely indicating gas outflowing both in the disk and outside the plane of the galaxy. They resemble the motions of an expanding bubble, possibly induced by the passage of the intermediate-power radio jet of Cen A through the galaxy ISM (see e.g., Mukherjee et al. 2016). Although on very different physical scales, a similar scenario was proposed for the luminous quasar 3C273 (Husemann et al. 2019).
3.5. Energetics of the nuclear ionized gas outflow
In previous sections we established the presence of a nuclear fast ionized gas outflow. To estimate its properties we follow the methodology applied to MRS observations by Hermosa Muñoz et al. (2025). Briefly, we first derived the mass of ionized gas (Mout) in the nuclear region using the Pfα line (Table 1) and their equation (1). We estimated an electron density of ne = 868 cm−3 using the ratio between the two [Ne V] lines and PYNEB (Luridiana et al. 2015). Using the nuclear Pfα flux (Table 1), the mass of ionized gas in the nuclear (unresolved) region of Cen A is Mion≃104 M⊙. The Pfα line is broad and relatively faint against the bright continuum (see Fig. 2), which complicates an accurate kinematic decomposition. To estimate the ionized gas mass in the outflow we assumed that, similarly to [Ar II] and [Ne III], approximately half of the flux is in the broad component as derived from the fits to the lines with two Gaussians. Thus the outflowing ionized gas mass is Mout = 5×10³ M⊙, where the uncertainties include the Pfα flux error (10%) and the fraction of the line flux associated with the fast velocities. For the maximum outflow velocity, we took the expression vout−max=Δv+2×σbroad, where Δv is the shift (in absolute value) of the line with respect to vsys. Relying again on [Ar II] and [Ne III], we obtained estimates for the maximum outflow velocity of vout−max = 1183 and 652 km s−1, respectively. The lower value from [Ne III] comes, at least in part, from the fact that the two Gaussian fit does not account for the high velocity line wings (see middle panel of Fig. A.2).
Using dMout/dt = 3×Mout×vout−max/Rout (Hermosa Muñoz et al. 2025, and references therein) and the region radius (Rout) that of the nuclear source, we derived an ionized gas mass outflow rate of dMout/dt = 1.6−2.9 M⊙ yr−1. The quoted values take into account the different estimates for the outflow maximum velocity. This relatively large value results in part from the fact that the nuclear fast ionized gas outflow in Cen A stems from an extremely compact region. We note that the nuclear region is unresolved, and thus this mass outflow rate is a lower limit.
In Sects. 3.3 and 3.2 we presented evidence that both an AGN and shocks may contribute to the excitation of the gas. Moreover, the complex ionized and molecular gas kinematics suggest a strong interaction between the radio jet and the galaxy ISM on the nuclear scales of Cen A. The resulting ionized gas outflow might be driven by the jet and/or the AGN. As done for NGC 1068 by García-Burillo et al. (2014), we can evaluate whether both mechanisms can inject sufficient energy to launch the ionized gas outflow. The maximum kinetic energy of the outflow (Lkin = 1/2×dMout/dt×(vout)2) is approximately 1.3×1042 erg s−1, and thus the estimated jet power of Pjet∼2×1043 erg s−1 (see Sect. 1) would be sufficient. On the other hand, the momentum provided by AGN photons is generally computed as Lbol(AGN)/c. Thus Lbol(AGN) gives a momentum range of approximately 3×1032−1×1033 g cm s−2, while the maximum outflow momentum flux (dPout/dt=dMout/dt×vout) is of the order of 2×1034 g cm s−2. The momentum boost needed would be approximately 16–64, which is a reasonable factor according to numerical simulations (see Faucher-Giguère & Quataert 2012; García-Burillo et al. 2014). However, based on this analysis, we cannot determine which is the dominant mechanism. Nevertheless, Cen A's radio jet is traveling at subluminal apparent velocities (v∼0.5c, Hardcastle et al. 2003). Thus it is likely that it is the main influence on these scales.
4. Discussion and summary
We have analyzed MIRI-MRS 5−28 μm observations of the inner ≃7−14″ (≃100−200 pc) region of Cen A which we used to investigate in detail the kinematics of both the ionized and the warm molecular gas. This work is part of the MIRI GTO program MICONIC.
Morphology of the gas: The two gas phases explored with the MIRI-MRS observations present remarkably different morphologies in the central 100–200 pc region. The warm molecular gas traced with the H2 S(1) transition shows a ring-like shape with a more pronounced gas deficit at the AGN position than the S(5) line. The latter line probes warmer gas further inside the nuclear disk (Fig. 5). The fine structure lines show the brightest emission along the direction of the radio jet, extending over the ∼100 pc region mapped with MRS (Figs. 6 and A.3). This structure constitutes the base of the much larger ionization cone identified with Spitzer/IRS mapping observations of [O IV] and [Ne V] (Quillen et al. 2008). Emission from other lines (e.g., [Ar II], [Ne II], [Ne III], and [S III]), on the other hand, is also present in the disk of the galaxy.
Kinematics of the ionized gas: The fine-structure lines, from low IP ([Fe II] and [Ar II]) to high IP ([Ne VI]), as well as the warm molecular gas lines, show extremely complex kinematics. There is evidence for rotation, seen in both gas phases, from modeling the observations with tilted rotating rings using the 3DBAROLO tool (Di Teodoro & Fraternali 2015). More importantly, we detected several ionized gas kinematical features that agree with predictions from simulations of the passage of low-intermediate power radio jets (Mukherjee et al. 2016, 2018; Talbot et al. 2022; Meenakshi et al. 2022; Borodina et al. 2025) through the ISM of a galaxy. These include:
-
Fast velocities in the ionized gas are seen as broad line components in the nuclear profiles of [Ar II] and [Ne III] with σ≃600 km s−1 (Figs. 3 and A.2) and in p-v diagrams with values of up to approximately +1000 km s−1 and −1400 km s−1 (Figs. 15 and A.8). These appear to be confined within the unresolved nuclear region (size of ≃0.35″= 6 pc, FWHM) of Cen A. Velocities of hundreds of kilometers per second are also observed on slightly larger scales and in several directions, up to projected radial distances of ≃2″ = 35 pc. This is a clear observational signature of the presence of a jet-inflated bubble/outflow in the central region. Further out there are (perturbed) rotational motions in the disk of the galaxy, which are identified in the low IP emission lines (i.e., [Ar II] and [Ne III]).
-
Velocity dispersion enhancements are observed in all the fine-structure lines, both at the AGN position as well as extended over a few arcseconds in the direction perpendicular to the radio jet (Figs. 6 and A.3, right panels). In the radio jet simulations above these are explained by the lateral expansion of the jet as it interacts with the galaxy ISM. Observationally these have been found in other Seyfert galaxies with jets (Venturi et al. 2021; Peralta de Arriba et al. 2023; Davies et al. 2024; Zhang et al. 2024).
-
The nuclear [Ne V]/[Ne II], [Ne III]/[Ne II], and [Fe II]/Pfα ratios of Cen A are intermediate between those of Seyfert and type 2 QSO nuclei and those of LLAGNs and shocked regions (Figs. 8 and 9). Comparison of neon line ratios with fast shock models with and without a small contribution from AGN photoionization (Alarie & Morisset 2019; Feltre et al. 2023) shows that shocks are likely to play an important role in the excitation of the ionized gas of Cen A's nuclear region. Interestingly, in regions along the radio jet direction, just outside the very nuclear region, the neon line ratios become higher (Fig. 7), suggesting that the gas is also being illuminated by the AGN.
We derived an ionized gas mass outflow rate in the nuclear region (central 6 pc) of 1.6−2.9 M⊙ yr−1. Based on estimates for Lbol(AGN) (Israel 1998; Beckmann et al. 2011) and Pjet (Croston et al. 2009; Wykes et al. 2013; Neff et al. 2015), we concluded that both mechanisms can inject sufficient energy to launch the outflow.
Kinematics of the warm molecular gas: The mid-IR H2 line kinematics in the central region of Cen A are reproduced with a warped rotating disk model and/or a rotating disk with radial motions (Figs. 10 and 13, top and bottom panels, respectively). The latter could be associated with gas streamers detected in cold molecular gas (Espada et al. 2017), although some non-rotational motions could also take place outside the plane of the galaxy. Notably, there is no strong evidence for a fast nuclear molecular gas outflow in Cen A, only a weak blueshifted wing (see the H2 S(5) line profile in Fig. 4). This is unlike the nuclear warm molecular gas outflow detected in IC 5063 (Dasyra et al. 2024), although on much larger scales, which results from the radio jet crossing the galaxy disk. Several factors could influence the central region of Cen A. There is a deficit of molecular gas in that region, including the cold phase (see also Espada et al. 2017). Additionally, Cen A's jet is launched perpendicular to the galaxy disk, thus limiting the geometrical coupling, although simulations do predict some interaction with the galaxy ISM. Indeed, molecular outflows driven by a radio jet perpendicular to the disk have been observed, for example, in the Seyfert galaxy NGC 613 (Audibert et al. 2019). In contrast to Cen A, that galaxy has a high nuclear molecular gas concentration, both hot and cold, when compared to inner ∼200 pc region (García-Burillo et al. 2021, 2024).
In summary, our new MIRI-MRS observations of Cen A provide clear evidence of the presence of an ionized gas outflow whose fastest velocities (|v|>500 km s−1) originate from the central 6 pc. The noncircular motions and other properties of the ionized gas are consistent with an expanding bubble, likely induced by the passage of the intermediate-power radio jet through the galaxy ISM. The absence of an associated fast molecular gas outflow is probably due to a combination of a lack of large warm H2 column densities in the nuclear region and the fact that the inner radio jet appears to be perpendicular to the galaxy CND (Israel 1998). This may limit the coupling of the radio jet with the ISM on the physical scaled mapped with MIRI-MRS.
Acknowledgments
We thank the referee for a constructive report. We are grateful to Cristina Ramos Almeida and Lulu Zhang for sharing the model curves plotted in Fig. 8. AAH and LHM acknowledge support from grant PID2021-124665NB-I00 funded by the Spanish Ministry of Science and Innovation and the State Agency of Research MCIN/AEI/10.13039/501100011033 and ERDF A way of making Europe. LC acknowledges support by grant PIB2021-127718NB-100 from the Spanish Ministry of Science and Innovation/State Agency of Research MCIN/AEI/10.13039/501100011033 and by “ERDF A way of making Europe”. GÖ acknowledges support from the Swedish National Space Agency (SNSA). SGB acknowledges support from the Spanish grant PID2022-138560NB-I00, funded by MCIN/AEI/10.13039/501100011033/FEDER, EU. MIRI draws on the scientific and technical expertise of the following organisations: Ames Research Center, USA; Airbus Defence and Space, UK; CEA-Irfu, Saclay, France; Centre Spatial de Liége, Belgium; Consejo Superior de Investigaciones Científicas, Spain; Carl Zeiss Optronics, Germany; Chalmers University of Technology, Sweden; Danish Space Research Institute, Denmark; Dublin Institute for Advanced Studies, Ireland; European Space Agency, Netherlands; ETCA, Belgium; ETH Zurich, Switzerland; Goddard Space Flight Center, USA; Institute d’Astrophysique Spatiale, France; Instituto Nacional de Técnica Aeroespacial, Spain; Institute for Astronomy, Edinburgh, UK; Jet Propulsion Laboratory, USA; Laboratoire d’Astrophysique de Marseille (LAM), France; Leiden University, Netherlands; Lockheed Advanced Technology Center (USA); NOVA OptIR group at Dwingeloo, Netherlands; Northrop Grumman, USA; Max-Planck Institut für Astronomie (MPIA), Heidelberg, Germany; Laboratoire d’Etudes Spatiales et d’Instrumentation en Astrophysique (LESIA), France; Paul Scherrer Institut, Switzerland; Raytheon Vision Systems, USA; RUAG Aerospace, Switzerland; Rutherford Appleton Laboratory (RAL Space), UK; Space Telescope Science Institute, USA; Toegepast- Natuurwetenschappelijk Onderzoek (TNO-TPD), Netherlands; UK Astronomy Technology Centre, UK; University College London, UK; University of Amsterdam, Netherlands; University of Arizona, USA; University of Cardiff, UK; University of Cologne, Germany; University of Ghent; University of Groningen, Netherlands; University of Leicester, UK; University of Leuven, Belgium; University of Stockholm, Sweden; Utah State University, USA. A portion of this work was carried out at the Jet Propulsion Laboratory, California Institute of Technology, under a contract with the National Aeronautics and Space Administration. We would like to thank the following National and International Funding Agencies for their support of the MIRI development: NASA; ESA; Belgian Science Policy Office; Centre Nationale D’Etudes Spatiales (CNES); Danish National Space Centre; Deutsches Zentrum fur Luft-und Raumfahrt (DLR); Enterprise Ireland; Ministerio De Economía y Competitividad; Netherlands Research School for Astronomy (NOVA); Netherlands Organisation for Scientific Research (NWO); Science and Technology Facilities Council; Swiss Space Office; Swedish National Space Board; UK Space Agency. This work is based on observations made with the NASA/ESA/CSA James Webb Space Telescope. The data were obtained from the Mikulski Archive for Space Telescopes at the Space Telescope Science Institute, which is operated by the Association of Universities for Research in Astronomy, Inc., under NASA contract NAS 5-03127 for JWST; and from the European JWST archive (eJWST) operated by the ESDC. This research has made use of the NASA/IPAC Extragalactic Database (NED), which is operated by the Jet Propulsion Laboratory, California Institute of Technology, under contract with the National Aeronautics and Space Administration. This research made use of NumPy (Harris et al. 2020), Matplotlib (Hunter 2007) and Astropy (Astropy Collaboration 2013, 2018).
To produce the σ maps of H2 S(5) and for [Ar II], especially when using two Gaussians (next section) for the fit, we artificially decreased slightly the instrumental resolution, σinst, to avoid corrected σ values (after subtracting σinst in quadrature) of nearly zero in those spaxels where the line width is close to the instrumental value.
We note that the physical scales of the nuclear regions of these are much larger (at least a factor of 10 in linear scale) than those probed for Cen A.
References
- Alarie, A., & Morisset, C. 2019, Rev. Mex. Astron. Astrofis., 55, 377 [Google Scholar]
- Allen, M. G., Groves, B. A., Dopita, M. A., Sutherland, R. S., & Kewley, L. J. 2008, ApJS, 178, 20 [Google Scholar]
- Alonso Herrero, A., Hermosa Muñoz, L., Labiano, A., et al. 2024, A&A, 690, A95 [NASA ADS] [CrossRef] [EDP Sciences] [Google Scholar]
- Alonso-Herrero, A., Rieke, M. J., Rieke, G. H., & Ruiz, M. 1997, ApJ, 482, 747 [CrossRef] [Google Scholar]
- Álvarez-Márquez, J., Labiano, A., Guillard, P., et al. 2023, A&A, 672, A108 [NASA ADS] [CrossRef] [EDP Sciences] [Google Scholar]
- Argyriou, I., Glasse, A., Law, D. R., et al. 2023, A&A, 675, A111 [NASA ADS] [CrossRef] [EDP Sciences] [Google Scholar]
- Armus, L., Lai, T., U, V., et al. 2023, ApJ, 942, L37 [NASA ADS] [CrossRef] [Google Scholar]
- Astropy Collaboration (Robitaille, T. P., et al.) 2013, A&A, 558, A33 [NASA ADS] [CrossRef] [EDP Sciences] [Google Scholar]
- Astropy Collaboration (Price-Whelan, A. M., et al.) 2018, AJ, 156, 123 [Google Scholar]
- Audibert, A., Combes, F., García-Burillo, S., et al. 2019, A&A, 632, A33 [NASA ADS] [CrossRef] [EDP Sciences] [Google Scholar]
- Banzatti, A., Salyk, C., Pontoppidan, K. M., et al. 2025, AJ, 169, 165 [Google Scholar]
- Beckmann, V., Jean, P., Lubiński, P., Soldi, S., & Terrier, R. 2011, A&A, 531, A70 [NASA ADS] [CrossRef] [EDP Sciences] [Google Scholar]
- Bicknell, G. V., Sutherland, R. S., & Neumayer, N. 2013, ApJ, 766, 36 [Google Scholar]
- Bland, J., Taylor, K., Atherton, P. D., et al. 1987, MNRAS, 228, 595 [Google Scholar]
- Borkar, A., Adhikari, T. P., Różańska, A., et al. 2021, MNRAS, 500, 3536 [Google Scholar]
- Borodina, O., Ni, Y., Bennett, J. S., et al. 2025, ApJ, 981, 149 [Google Scholar]
- Buiten, V. A., van der Werf, P. P., Viti, S., et al. 2025, A&A, 699, A312 [Google Scholar]
- Bushouse, H., Eisenhamer, J., Dencheva, N., et al. 2023, https://doi.org/10.5281/zenodo.8404029 [Google Scholar]
- Cazzoli, S., Márquez, I., Masegosa, J., et al. 2018, MNRAS, 480, 1106 [Google Scholar]
- Cazzoli, S., Hermosa Muñoz, L., Márquez, I., et al. 2022, A&A, 664, A135 [NASA ADS] [CrossRef] [EDP Sciences] [Google Scholar]
- Clarke, D. A., Burns, J. O., & Norman, M. L. 1992, ApJ, 395, 444 [NASA ADS] [CrossRef] [Google Scholar]
- Colina, L., Piqueras López, J., Arribas, S., et al. 2015, A&A, 578, A48 [NASA ADS] [CrossRef] [EDP Sciences] [Google Scholar]
- Costa-Souza, J. H., Riffel, R. A., Souza-Oliveira, G. L., et al. 2024, ApJ, 974, 127 [Google Scholar]
- Cresci, G., Marconi, A., Zibetti, S., et al. 2015, A&A, 582, A63 [NASA ADS] [CrossRef] [EDP Sciences] [Google Scholar]
- Croston, J. H., Kraft, R. P., Hardcastle, M. J., et al. 2009, MNRAS, 395, 1999 [NASA ADS] [CrossRef] [Google Scholar]
- Dasyra, K. M., Paraschos, G. F., Combes, F., et al. 2024, ApJ, 977, 156 [Google Scholar]
- Davies, R., Shimizu, T., Pereira-Santaella, M., et al. 2024, A&A, 689, A263 [NASA ADS] [CrossRef] [EDP Sciences] [Google Scholar]
- Di Teodoro, E. M., & Fraternali, F. 2015, MNRAS, 451, 3021 [Google Scholar]
- Dicken, D., Rieke, G., Ressler, M., et al. 2022, SPIE Conf. Ser., 12180, 121802R [NASA ADS] [Google Scholar]
- Eckart, A., Wild, W., & Ageorges, N. 1999, ApJ, 516, 769 [Google Scholar]
- Espada, D., Matsushita, S., Peck, A., et al. 2009, ApJ, 695, 116 [Google Scholar]
- Espada, D., Matsushita, S., Miura, R. E., et al. 2017, ApJ, 843, 136 [NASA ADS] [CrossRef] [Google Scholar]
- Esparza-Arredondo, D., Ramos Almeida, C., Audibert, A., et al. 2025, A&A, 693, A174 [NASA ADS] [CrossRef] [EDP Sciences] [Google Scholar]
- Faucher-Giguère, C. -A., & Quataert, E. 2012, MNRAS, 425, 605 [NASA ADS] [CrossRef] [Google Scholar]
- Feltre, A., Gruppioni, C., Marchetti, L., et al. 2023, A&A, 675, A74 [NASA ADS] [CrossRef] [EDP Sciences] [Google Scholar]
- García-Bernete, I., Rigopoulou, D., Donnan, F. R., et al. 2024, A&A, 691, A162 [NASA ADS] [CrossRef] [EDP Sciences] [Google Scholar]
- García-Burillo, S., Combes, F., Usero, A., et al. 2014, A&A, 567, A125 [Google Scholar]
- García-Burillo, S., Alonso-Herrero, A., Ramos Almeida, C., et al. 2021, A&A, 652, A98 [NASA ADS] [CrossRef] [Google Scholar]
- García-Burillo, S., Hicks, E. K. S., Alonso-Herrero, A., et al. 2024, A&A, 689, A347 [NASA ADS] [CrossRef] [EDP Sciences] [Google Scholar]
- Gardner, J. P., Mather, J. C., Abbott, R., & Zondag, E. 2023, PASP, 135, 068001 [CrossRef] [Google Scholar]
- Gasman, D., Argyriou, I., Sloan, G. C., et al. 2023, A&A, 673, A102 [NASA ADS] [CrossRef] [EDP Sciences] [Google Scholar]
- Goold, K., Seth, A., Molina, M., et al. 2024, ApJ, 966, 204 [NASA ADS] [CrossRef] [Google Scholar]
- Hardcastle, M. J., Worrall, D. M., Kraft, R. P., et al. 2003, ApJ, 593, 169 [NASA ADS] [CrossRef] [Google Scholar]
- Harris, C. R., Millman, K. J., van der Walt, S. J., et al. 2020, Nature, 585, 357 [NASA ADS] [CrossRef] [Google Scholar]
- Harrison, C. M., & Ramos Almeida, C. 2024, Galaxies, 12, 17 [NASA ADS] [CrossRef] [Google Scholar]
- Hermosa Muñoz, L., Alonso-Herrero, A., Pereira-Santaella, M., et al. 2024a, A&A, 690, A350 [NASA ADS] [CrossRef] [EDP Sciences] [Google Scholar]
- Hermosa Muñoz, L., Cazzoli, S., Márquez, I., et al. 2024b, A&A, 683, A43 [NASA ADS] [CrossRef] [EDP Sciences] [Google Scholar]
- Hermosa Muñoz, L., Alonso-Herrero, A., Labiano, A., et al. 2025, A&A, 693, A321 [NASA ADS] [CrossRef] [EDP Sciences] [Google Scholar]
- Hunter, J. D. 2007, Comput. Sci. Eng., 9, 90 [NASA ADS] [CrossRef] [Google Scholar]
- Husemann, B., Bennert, V. N., Jahnke, K., et al. 2019, ApJ, 879, 75 [Google Scholar]
- Israel, F. P. 1998, A&ARv, 8, 237 [Google Scholar]
- Krajnović, D., Sharp, R., & Thatte, N. 2007, MNRAS, 374, 385 [Google Scholar]
- Law, D. R., Morrison, J., Argyriou, I., et al. 2023, AJ, 166, 45 [NASA ADS] [CrossRef] [Google Scholar]
- Luridiana, V., Morisset, C., & Shaw, R. A. 2015, A&A, 573, A42 [NASA ADS] [CrossRef] [EDP Sciences] [Google Scholar]
- Maciejewski, W. 2004, MNRAS, 354, 892 [NASA ADS] [CrossRef] [Google Scholar]
- Marconcini, C., Marconi, A., Cresci, G., et al. 2025, Nat. Astron. [arXiv:2503.24359] [Google Scholar]
- Marconi, A., Schreier, E. J., Koekemoer, A., et al. 2000, ApJ, 528, 276 [NASA ADS] [CrossRef] [Google Scholar]
- Meenakshi, M., Mukherjee, D., Wagner, A. Y., et al. 2022, MNRAS, 516, 766 [NASA ADS] [CrossRef] [Google Scholar]
- Morganti, R., Oosterloo, T., Oonk, J. B. R., Frieswijk, W., & Tadhunter, C. 2015, A&A, 580, A1 [NASA ADS] [CrossRef] [EDP Sciences] [Google Scholar]
- Morrison, J. E., Dicken, D., Argyriou, I., et al. 2023, PASP, 135, 075004 [NASA ADS] [CrossRef] [Google Scholar]
- Mukherjee, D., Bicknell, G. V., Sutherland, R., & Wagner, A. 2016, MNRAS, 461, 967 [NASA ADS] [CrossRef] [Google Scholar]
- Mukherjee, D., Bicknell, G. V., Wagner, A. Y., Sutherland, R. S., & Silk, J. 2018, MNRAS, 479, 5544 [NASA ADS] [CrossRef] [Google Scholar]
- Neff, S. G., Eilek, J. A., & Owen, F. N. 2015, ApJ, 802, 87 [NASA ADS] [CrossRef] [Google Scholar]
- Neumayer, N., Cappellari, M., Reunanen, J., et al. 2007, ApJ, 671, 1329 [NASA ADS] [CrossRef] [Google Scholar]
- Patapis, P., Argyriou, I., Law, D. R., et al. 2024, A&A, 682, A53 [NASA ADS] [CrossRef] [EDP Sciences] [Google Scholar]
- Peralta de Arriba, L., Alonso-Herrero, A., García-Burillo, S., et al. 2023, A&A, 675, A58 [NASA ADS] [CrossRef] [EDP Sciences] [Google Scholar]
- Pereira-Santaella, M., Álvarez-Márquez, J., García-Bernete, I., et al. 2022, A&A, 665, L11 [NASA ADS] [CrossRef] [EDP Sciences] [Google Scholar]
- Pontoppidan, K. M., Salyk, C., Banzatti, A., et al. 2024, ApJ, 963, 158 [NASA ADS] [CrossRef] [Google Scholar]
- Quillen, A. C., de Zeeuw, P. T., Phinney, E. S., & Phillips, T. G. 1992, ApJ, 391, 121 [Google Scholar]
- Quillen, A. C., Brookes, M. H., Keene, J., et al. 2006, ApJ, 645, 1092 [Google Scholar]
- Quillen, A. C., Bland-Hawthorn, J., Green, J. D., et al. 2008, MNRAS, 384, 1469 [NASA ADS] [CrossRef] [Google Scholar]
- Quillen, A. C., Neumayer, N., Oosterloo, T., & Espada, D. 2010, PASA, 27, 396 [Google Scholar]
- Ramos Almeida, C., García-Bernete, I., Pereira-Santaella, M., et al. 2025, A&A, 698, A194 [NASA ADS] [CrossRef] [EDP Sciences] [Google Scholar]
- Rieke, G. H., Wright, G. S., Böker, T., et al. 2015, PASP, 127, 584 [NASA ADS] [CrossRef] [Google Scholar]
- Rodríguez-Ardila, A., Riffel, R., & Pastoriza, M. G. 2005, MNRAS, 364, 1041 [CrossRef] [Google Scholar]
- Roy, N., Heckman, T., Overzier, R., et al. 2024, ApJ, 970, 69 [NASA ADS] [CrossRef] [Google Scholar]
- Simpson, C., & Meadows, V. 1998, ApJ, 505, L99 [NASA ADS] [CrossRef] [Google Scholar]
- Storchi-Bergmann, T., Bica, E., Kinney, A. L., & Bonatto, C. 1997, MNRAS, 290, 231 [NASA ADS] [CrossRef] [Google Scholar]
- Talbot, R. Y., Sijacki, D., & Bourne, M. A. 2022, MNRAS, 514, 4535 [NASA ADS] [CrossRef] [Google Scholar]
- U, V., Lai, T., Bianchin, M., et al. 2022, ApJ, 940, L5 [NASA ADS] [CrossRef] [Google Scholar]
- Venturi, G., Cresci, G., Marconi, A., et al. 2021, A&A, 648, A17 [NASA ADS] [CrossRef] [EDP Sciences] [Google Scholar]
- Wells, M., Pel, J. W., Glasse, A., et al. 2015, PASP, 127, 646 [NASA ADS] [CrossRef] [Google Scholar]
- Wright, G. S., Wright, D., Goodson, G. B., et al. 2015, PASP, 127, 595 [NASA ADS] [CrossRef] [Google Scholar]
- Wright, G. S., Rieke, G. H., Glasse, A., et al. 2023, PASP, 135, 048003 [NASA ADS] [CrossRef] [Google Scholar]
- Wykes, S., Croston, J. H., Hardcastle, M. J., et al. 2013, A&A, 558, A19 [NASA ADS] [CrossRef] [EDP Sciences] [Google Scholar]
- Zhang, L., Packham, C., Hicks, E. K. S., et al. 2024, ApJ, 974, 195 [NASA ADS] [CrossRef] [Google Scholar]
Appendix A: Additional figures for spectra, line profile fit, ALUCINE maps, and 3DBAROLO analysis
In this appendix we show the full 5−27 μm nuclear spectrum of Cen A in Fig. A.1 and the parametric fit to the nuclear [Ne III] line in Fig. A.2 with one, two, and three Gaussians. Table A.1 summarizes the results for the fit peak velocities and velocity dispersions of the components for this line as well as for H2 S(5) and [Ar II] (fits plotted in Figs. 4 and 3, respectively).
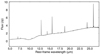 |
Fig. A.1. Full 5−27.3 μm spectrum of Cen A extracted as a point source. Those spectra separated by individual channels are in Fig. 2. |
Parametric fits to the line profiles with one, two, or three Gaussian components.
We also show additional maps for lines fit with one Gaussian component, namely, [Fe II] at 5.34 μm, [S IV], [Ne II], [Ne V] at 14.32 μm, and [S III] in Fig. A.3 as well as maps fit with two Gaussian components for [Ar II] in Fig. A.4.
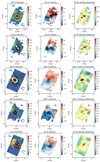 |
Fig. A.3. Same as Fig. 6 but for [Fe II] at 5.34 μm, [S IV], [Ne II], [Ne V] at 14.32 μm, and [S III] (from top to bottom). |
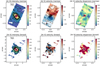 |
Fig. A.4. Same as Fig. 6 but for fits with two Gaussian components for the [Ar II] line. All velocities are referred to vsys. |
Finally, we include additional figures generated with 3DBAROLO. Fig. A.5 compares the derived PAmaj and i of the disk models with no vRAD component of the H2 S(5) and H2 S(1) lines, while Figs. A.6, and A.8 are p-v diagrams. Figure A.7 shows the model and residuals for the fit to the [Ne III] line.
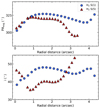 |
Fig. A.5. Radial dependence of the kinematic PAmaj (top) and i (bottom) of the 3DBAROLO disk models (no vRAD component) of the H2 S(5) and H2 S(1) transitions (top-left panels of Fig. 10 and Fig. 13, respectively). An average value of i≃45o was derived for the nuclear disk and nuclear ring by Neumayer et al. (2007), in good agreement with our fits. |
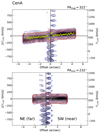 |
Fig. A.6. P-v diagrams for H2 S(1) where the disk model has no vRAD component. Colors and lines are as in Fig. 11. We call attention to the strong residuals left from subtracting the strong continuum at the AGN position. |
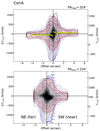 |
Fig. A.8. P-v diagrams extracted along the kinematic major axis (top) and minor axis (bottom) for [Ne III]. Colors and contours as in Fig. 11. |
All Tables
Parametric fits to the line profiles with one, two, or three Gaussian components.
All Figures
|
Fig. 1. Spitzer/IRAC image at 8 μm of the central ∼3.7′×3.4′ region of Cen A. The footprints of the MIRI-MRS observations (blue rectangles) are shown. Orientation is north up, east to the left. Figure generated with the Astronomer's Proposal Tool (APT) version 2025.1. |
| In the text | |
|
Fig. 2. MIRI-MRS spectra of Cen A extracted as a point source for ch1 (upper left), ch2 (upper right), ch3 (lower left), and ch4 (lower right). The lines mark fine-structure emission lines (blue and green), hydrogen recombination lines (red), and rotational H2 0–0 lines (magenta). |
| In the text | |
|
Fig. 3. Parametric fits of the [Ar II] line profile from the spectrum extracted as a point source. Fits are (left to right) with one, two, and three Gaussians plus a local continuum. The top panel shows the total fit and the individual Gaussians and the bottom the residuals of the fit. The vertical lines in the main panel indicate the continuum regions and the horizontal lines in the bottom panel ±3×scont, where scont is the local continuum standard deviation. The corresponding parameters of each fit are listed in Table A.1. |
| In the text | |
|
Fig. 4. Same as Fig. 3, but for H2 S(5) and fits only with one and two Gaussians (see text and Table A.1 for more details). |
| In the text | |
|
Fig. 5. Maps of H2 S(5) at 6.909 μm (top) and H2 S(1) at 17.03 μm (bottom) constructed as explained in Sect. 2.2. Panels show the intensity and contours in a square root scale in arbitrary units (left), the mean-velocity field in units of km s−1 (middle), and the velocity dispersion map σ (corrected for instrumental resolution) in units of km s−1 (right). The velocity contours are in a linear scale (solid lines positive values and dashed lines negative values). The star symbol marks the peak of the continuum adjacent to the line, that is, the AGN position. The 0,0 point on the axes refers to the center of the corresponding sub-channel array. North is up and east to the left. |
| In the text | |
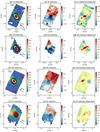 |
Fig. 6. Same as Fig. 5 but for [Ar II], [Ne VI], [Ne III], and [O IV] (from top to bottom). |
| In the text | |
|
Fig. 7. Maps of the [Ne V]/[Ne II] (left) and [Ne III]/[Ne II] (right) ratios from the ALUCINE intensity maps computed with a single Gaussian. Some structure in the form of diffraction rings from the unresolved emission can be seen around the AGN position. |
| In the text | |
|
Fig. 8. Diagnostic diagram [Ne V]/[Ne II] versus [Ne III]/[Ne II] comparing Cen A's nuclear ratios with literature Seyferts, type 2 QSOs, and LLAGNs. For IC 5063 we include the nuclear and integrated 2–3 kpc ratios. The shock+AGN model track (solid red line) is from Feltre et al. (2023) and the two MAPPINGS V shock models with precursor with the parameters used in that work and two values of the transverse magnetic field of 1 and 10 μG are from Alarie & Morisset (2019) (dashed orange and dotted brown lines, respectively). Numbers next to the curves indicate the shock velocities. See text for more details. |
| In the text | |
|
Fig. 9. [Fe II]/Pfα box plot for Seyfert nuclei, LLAGNs including Cen A's nuclear region, and shocked regions. The boxes comprise values from the first to the third quartiles of the distribution, the line inside the box is the median value, and the vertical lines contain 99.3% of the distribution. The outlier point in the shocked region class is the N2 jet impacted region of NGC 7319 (Pereira-Santaella et al. 2022). The blue dashed line represents the nuclear value for Cen A. The rest of references for the literature data are in text. |
| In the text | |
|
Fig. 10. Top: Velocity field of the 3DBAROLO rotating disk model (left) fit to the H2 S(5) transition and residuals computed by subtracting the model from the 3DBAROLO moment 1 map (right). Bottom: Same as top but including a vRAD component in the model. Orientation, color scale, and contours for the velocity models are as in Fig. 5. |
| In the text | |
|
Fig. 11. H2 S(5) p–v diagrams extracted along the kinematic major (top) and minor axes (bottom). The gray scale and blue contours are the observations, and red contours represent the fit 3DBAROLO rotating disk model. Yellow dots show the fit rotation curve. In the central ±0.5″, some of the blueshifted velocity structure might be due to residuals left from subtracting the AGN strong continuum. PAmaj is measured from north, counterclockwise, and on the receding half of the galaxy disk. |
| In the text | |
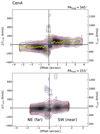 |
Fig. 12. Same as Fig. 11 but for a 3DBAROLO model with a vRAD component. |
| In the text | |
|
Fig. 13. Same as Fig. 10 but for the velocity fields of H2 S(1). Orientation, color scale, and contours for the velocity models are as in Fig. 5. |
| In the text | |
|
Fig. 14. Same as Fig. 10 (top) but for the velocity fields of [Ar II]. Orientation, color scale, and contours for the velocity models as in Fig. 5. |
| In the text | |
|
Fig. 15. P-v diagrams extracted along the kinematic major axis (top) and minor axis (bottom) for [Ar II]. The disk model does not include a vRAD component. Colors and contours as in Fig. 11. |
| In the text | |
|
Fig. A.1. Full 5−27.3 μm spectrum of Cen A extracted as a point source. Those spectra separated by individual channels are in Fig. 2. |
| In the text | |
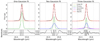 |
Fig. A.2. Same as Fig. 3 but for the parametric fits of the line profile of [Ne III]. |
| In the text | |
|
Fig. A.3. Same as Fig. 6 but for [Fe II] at 5.34 μm, [S IV], [Ne II], [Ne V] at 14.32 μm, and [S III] (from top to bottom). |
| In the text | |
|
Fig. A.4. Same as Fig. 6 but for fits with two Gaussian components for the [Ar II] line. All velocities are referred to vsys. |
| In the text | |
|
Fig. A.5. Radial dependence of the kinematic PAmaj (top) and i (bottom) of the 3DBAROLO disk models (no vRAD component) of the H2 S(5) and H2 S(1) transitions (top-left panels of Fig. 10 and Fig. 13, respectively). An average value of i≃45o was derived for the nuclear disk and nuclear ring by Neumayer et al. (2007), in good agreement with our fits. |
| In the text | |
|
Fig. A.6. P-v diagrams for H2 S(1) where the disk model has no vRAD component. Colors and lines are as in Fig. 11. We call attention to the strong residuals left from subtracting the strong continuum at the AGN position. |
| In the text | |
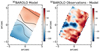 |
Fig. A.7. Same as top panel of Fig. 10 but for the velocity fields of [Ne III]. |
| In the text | |
|
Fig. A.8. P-v diagrams extracted along the kinematic major axis (top) and minor axis (bottom) for [Ne III]. Colors and contours as in Fig. 11. |
| In the text | |
Current usage metrics show cumulative count of Article Views (full-text article views including HTML views, PDF and ePub downloads, according to the available data) and Abstracts Views on Vision4Press platform.
Data correspond to usage on the plateform after 2015. The current usage metrics is available 48-96 hours after online publication and is updated daily on week days.
Initial download of the metrics may take a while.