Fig. 11.
Download original image
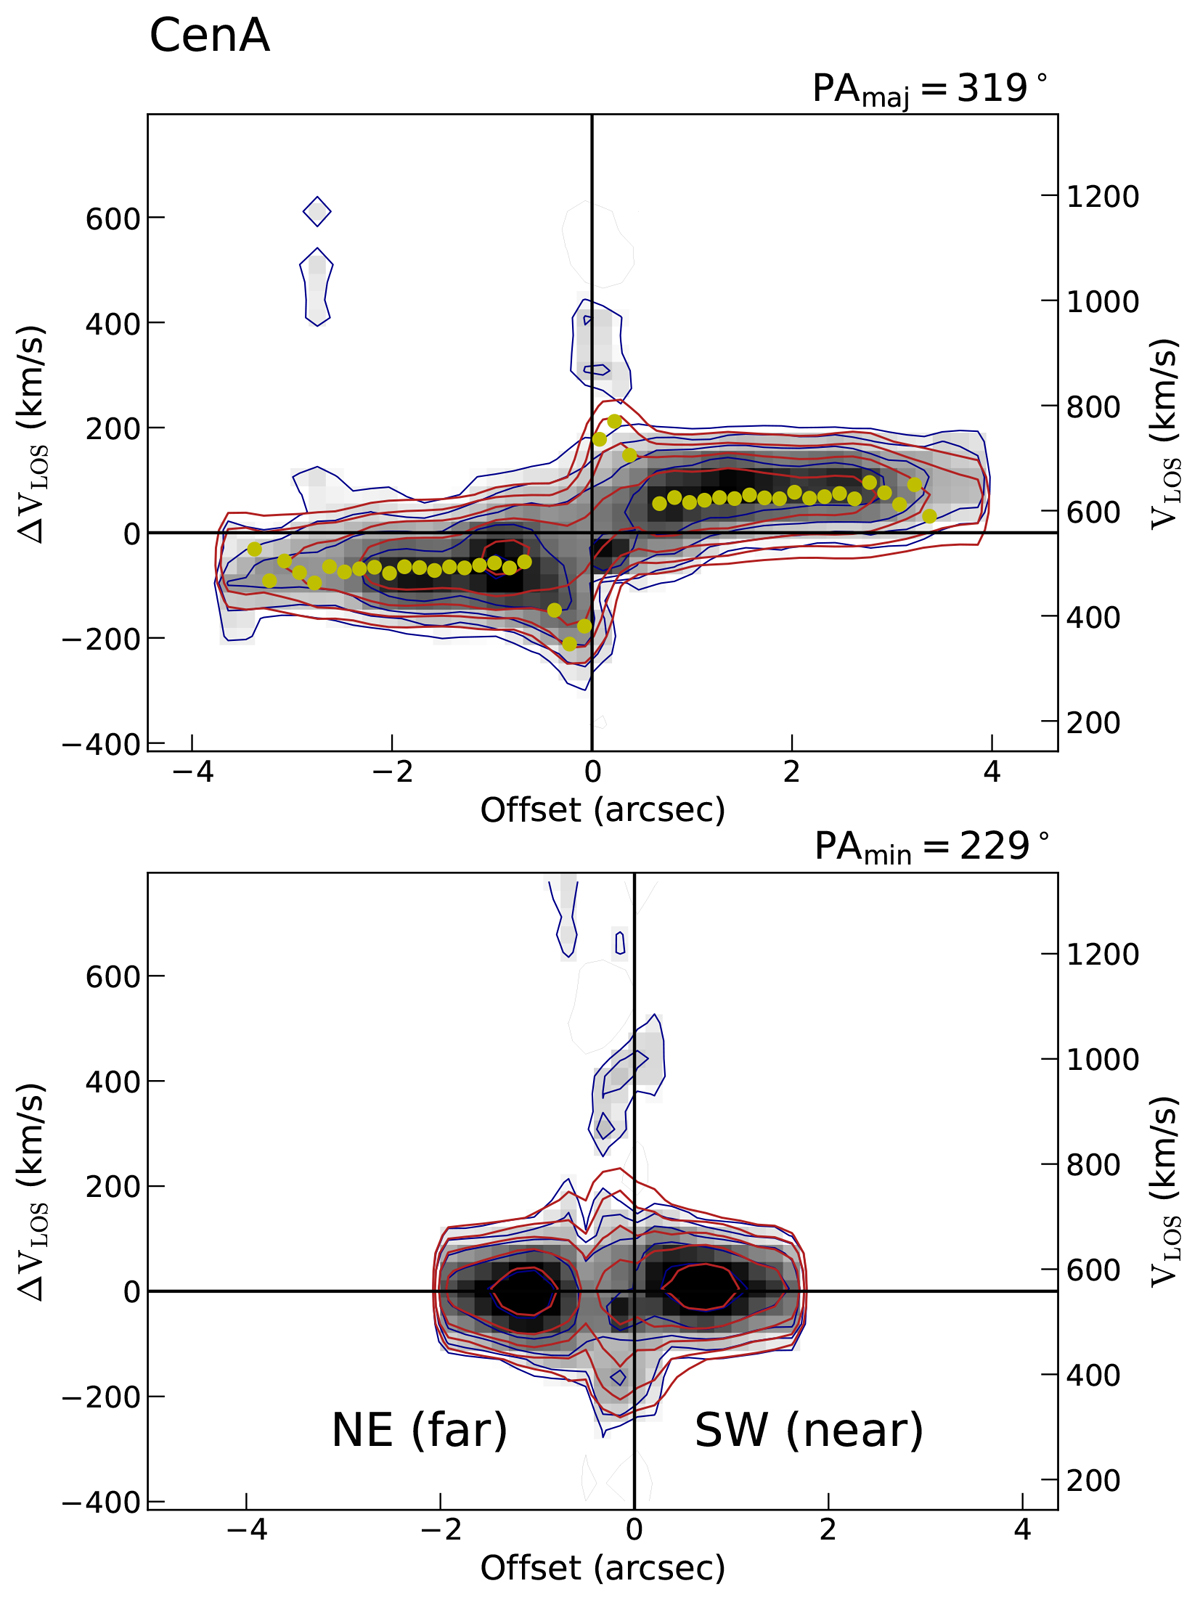
H2 S(5) p–v diagrams extracted along the kinematic major (top) and minor axes (bottom). The gray scale and blue contours are the observations, and red contours represent the fit 3DBAROLO rotating disk model. Yellow dots show the fit rotation curve. In the central ±0.5″, some of the blueshifted velocity structure might be due to residuals left from subtracting the AGN strong continuum. PAmaj is measured from north, counterclockwise, and on the receding half of the galaxy disk.
Current usage metrics show cumulative count of Article Views (full-text article views including HTML views, PDF and ePub downloads, according to the available data) and Abstracts Views on Vision4Press platform.
Data correspond to usage on the plateform after 2015. The current usage metrics is available 48-96 hours after online publication and is updated daily on week days.
Initial download of the metrics may take a while.