Open Access
Fig. 2.
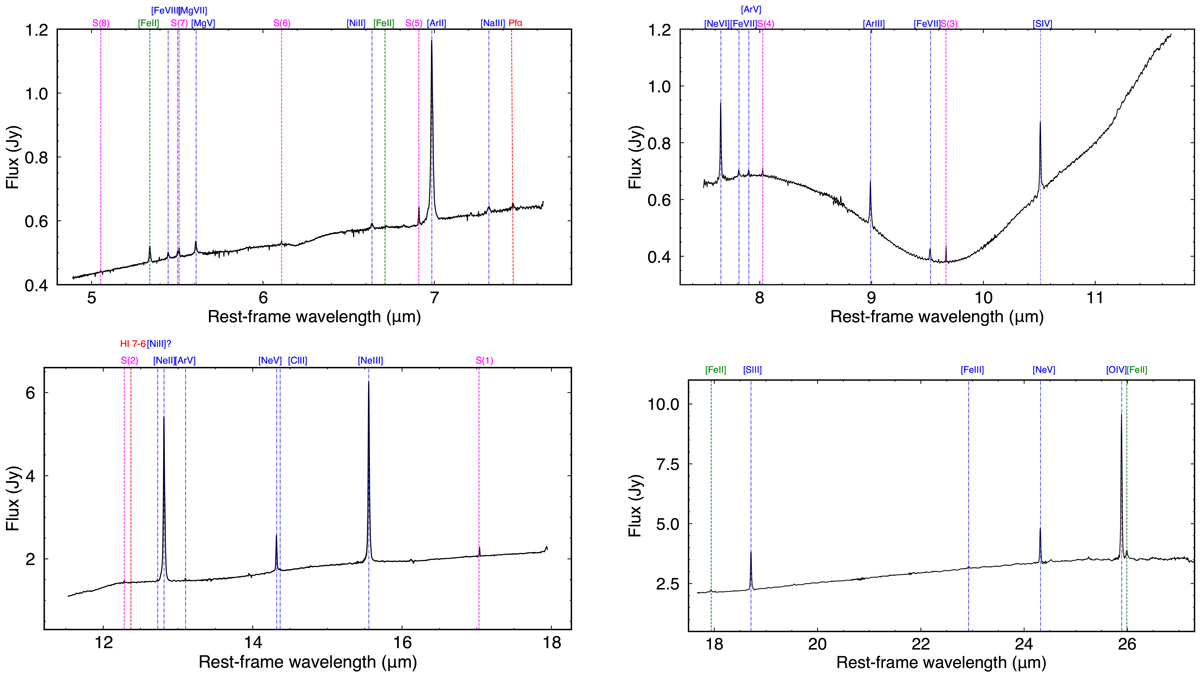
Download original image
MIRI-MRS spectra of Cen A extracted as a point source for ch1 (upper left), ch2 (upper right), ch3 (lower left), and ch4 (lower right). The lines mark fine-structure emission lines (blue and green), hydrogen recombination lines (red), and rotational H2 0–0 lines (magenta).
Current usage metrics show cumulative count of Article Views (full-text article views including HTML views, PDF and ePub downloads, according to the available data) and Abstracts Views on Vision4Press platform.
Data correspond to usage on the plateform after 2015. The current usage metrics is available 48-96 hours after online publication and is updated daily on week days.
Initial download of the metrics may take a while.