Fig. 9.
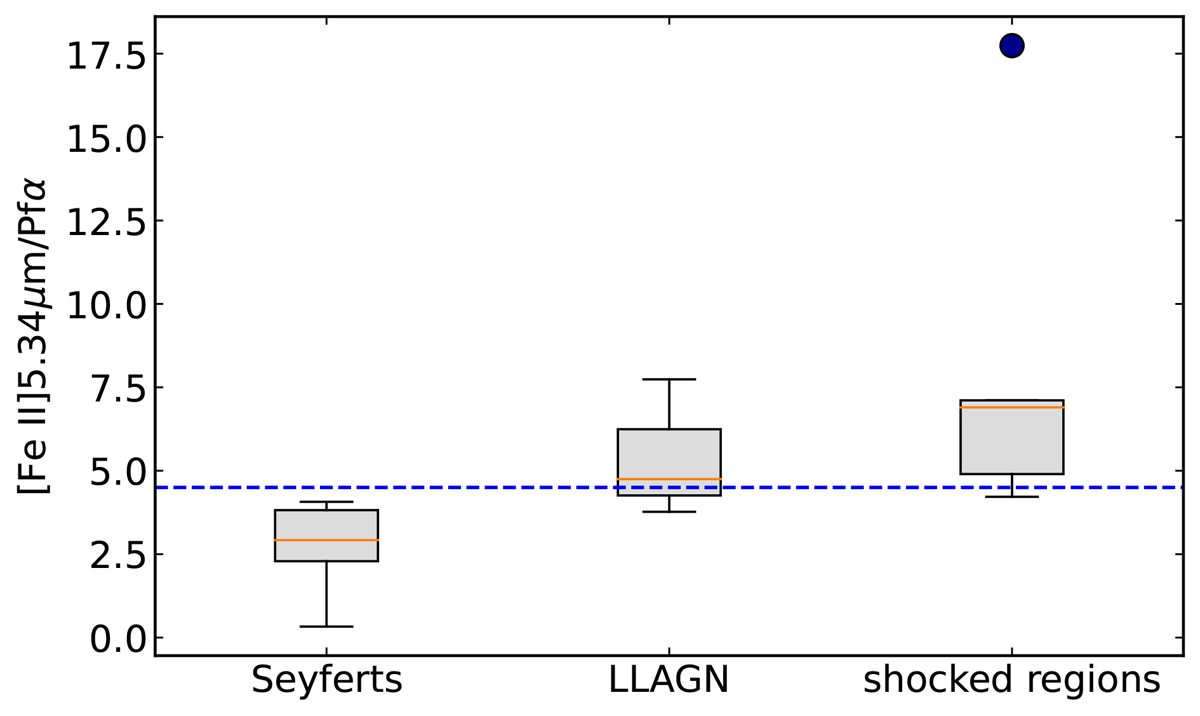
Download original image
[Fe II]/Pfα box plot for Seyfert nuclei, LLAGNs including Cen A's nuclear region, and shocked regions. The boxes comprise values from the first to the third quartiles of the distribution, the line inside the box is the median value, and the vertical lines contain 99.3% of the distribution. The outlier point in the shocked region class is the N2 jet impacted region of NGC 7319 (Pereira-Santaella et al. 2022). The blue dashed line represents the nuclear value for Cen A. The rest of references for the literature data are in text.
Current usage metrics show cumulative count of Article Views (full-text article views including HTML views, PDF and ePub downloads, according to the available data) and Abstracts Views on Vision4Press platform.
Data correspond to usage on the plateform after 2015. The current usage metrics is available 48-96 hours after online publication and is updated daily on week days.
Initial download of the metrics may take a while.