Open Access
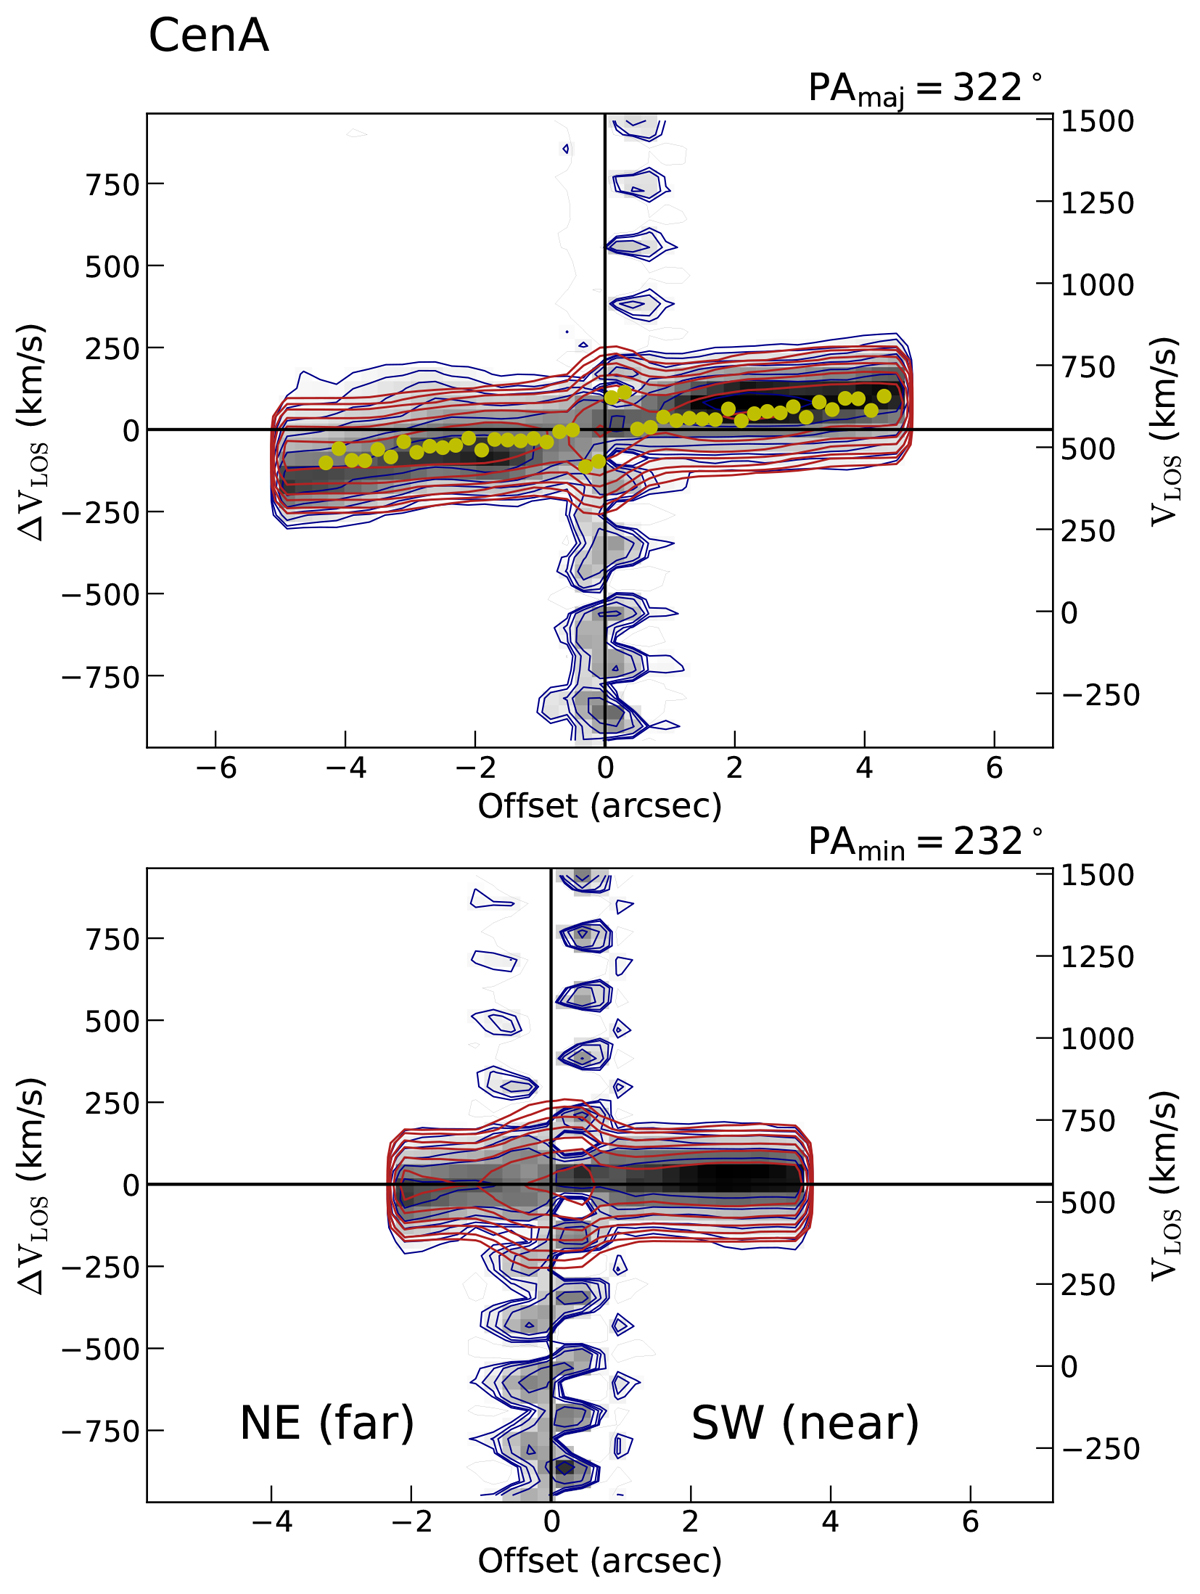
Fig. A.6.
Download original image
P-v diagrams for H2 S(1) where the disk model has no vRAD component. Colors and lines are as in Fig. 11. We call attention to the strong residuals left from subtracting the strong continuum at the AGN position.
Current usage metrics show cumulative count of Article Views (full-text article views including HTML views, PDF and ePub downloads, according to the available data) and Abstracts Views on Vision4Press platform.
Data correspond to usage on the plateform after 2015. The current usage metrics is available 48-96 hours after online publication and is updated daily on week days.
Initial download of the metrics may take a while.