Fig. 3.
Download original image
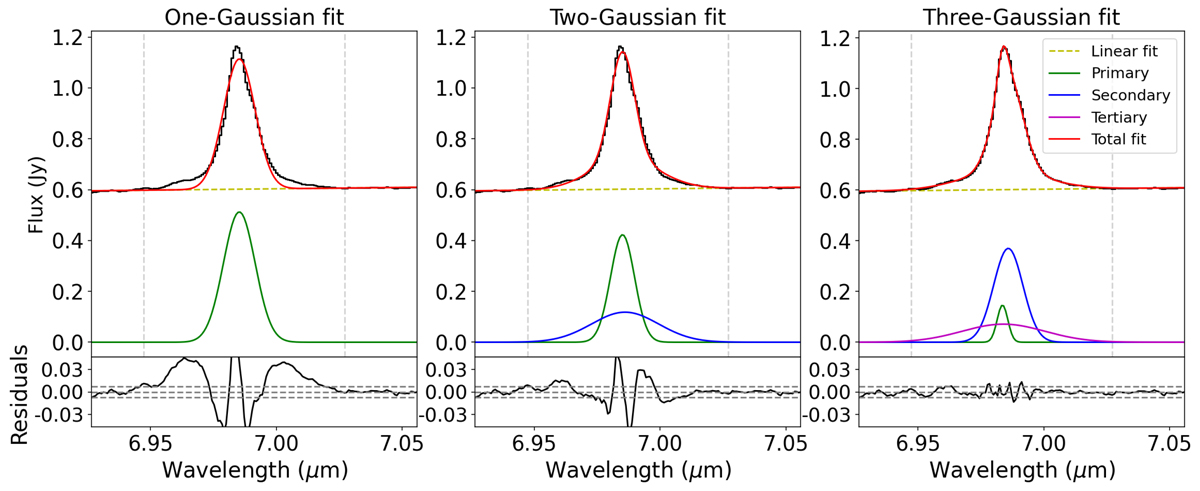
Parametric fits of the [Ar II] line profile from the spectrum extracted as a point source. Fits are (left to right) with one, two, and three Gaussians plus a local continuum. The top panel shows the total fit and the individual Gaussians and the bottom the residuals of the fit. The vertical lines in the main panel indicate the continuum regions and the horizontal lines in the bottom panel ±3×scont, where scont is the local continuum standard deviation. The corresponding parameters of each fit are listed in Table A.1.
Current usage metrics show cumulative count of Article Views (full-text article views including HTML views, PDF and ePub downloads, according to the available data) and Abstracts Views on Vision4Press platform.
Data correspond to usage on the plateform after 2015. The current usage metrics is available 48-96 hours after online publication and is updated daily on week days.
Initial download of the metrics may take a while.