Fig. 5.
Download original image
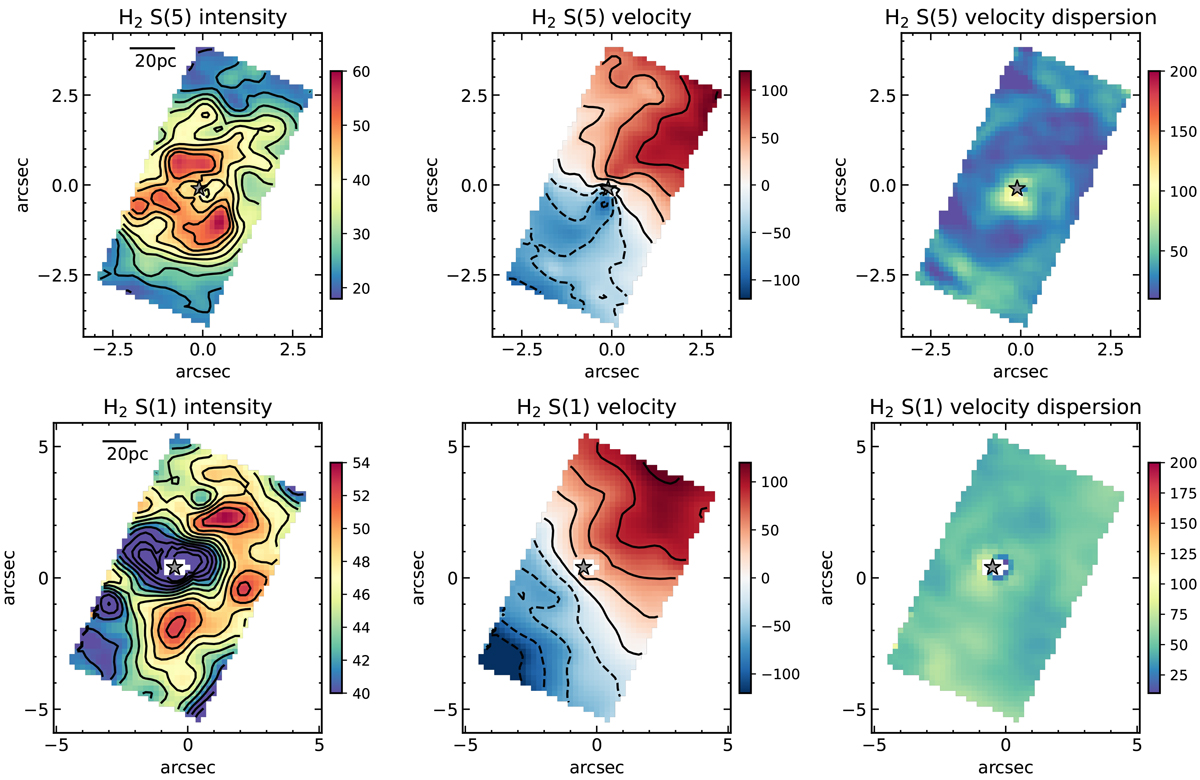
Maps of H2 S(5) at 6.909 μm (top) and H2 S(1) at 17.03 μm (bottom) constructed as explained in Sect. 2.2. Panels show the intensity and contours in a square root scale in arbitrary units (left), the mean-velocity field in units of km s−1 (middle), and the velocity dispersion map σ (corrected for instrumental resolution) in units of km s−1 (right). The velocity contours are in a linear scale (solid lines positive values and dashed lines negative values). The star symbol marks the peak of the continuum adjacent to the line, that is, the AGN position. The 0,0 point on the axes refers to the center of the corresponding sub-channel array. North is up and east to the left.
Current usage metrics show cumulative count of Article Views (full-text article views including HTML views, PDF and ePub downloads, according to the available data) and Abstracts Views on Vision4Press platform.
Data correspond to usage on the plateform after 2015. The current usage metrics is available 48-96 hours after online publication and is updated daily on week days.
Initial download of the metrics may take a while.