Open Access
Fig. 1.
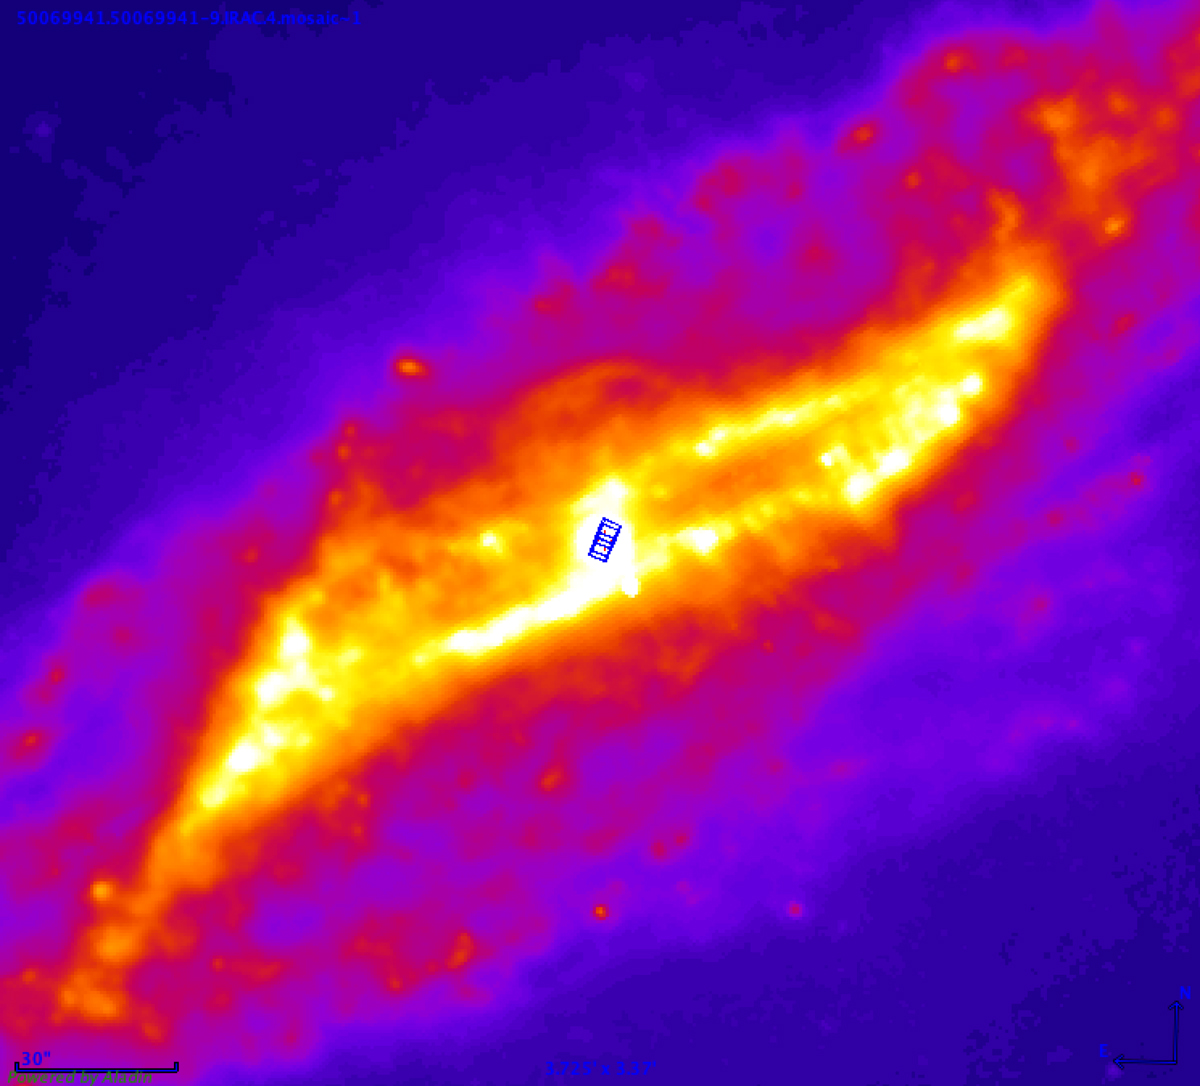
Download original image
Spitzer/IRAC image at 8 μm of the central ∼3.7′×3.4′ region of Cen A. The footprints of the MIRI-MRS observations (blue rectangles) are shown. Orientation is north up, east to the left. Figure generated with the Astronomer's Proposal Tool (APT) version 2025.1.
Current usage metrics show cumulative count of Article Views (full-text article views including HTML views, PDF and ePub downloads, according to the available data) and Abstracts Views on Vision4Press platform.
Data correspond to usage on the plateform after 2015. The current usage metrics is available 48-96 hours after online publication and is updated daily on week days.
Initial download of the metrics may take a while.