| Issue |
A&A
Volume 627, July 2019
|
|
|---|---|---|
| Article Number | A136 | |
| Number of page(s) | 51 | |
| Section | Extragalactic astronomy | |
| DOI | https://doi.org/10.1051/0004-6361/201935721 | |
| Published online | 15 July 2019 | |
The Fornax3D project: Tracing the assembly history of the cluster from the kinematic and line-strength maps
1
INAF–Osservatorio Astronomico di Capodimonte, via Moiariello 16, 80131 Napoli, Italy
e-mail: This email address is being protected from spambots. You need JavaScript enabled to view it.
2
Armagh Observatory and Planetarium, College Hill, Armagh, BT61 9DG UK
3
European Southern Observatory, Karl-Schwarzschild-Strasse 2, 85748 Garching bei Muenchen, Germany
4
Ludwig Maximilian Universitaet, Professor-Huber-Platz 2, 80539 München, Germany
5
INAF–Osservatorio Astronomico di Brera, via Brera 28, 20128 Milano, Italy
6
Dipartimento di Fisica e Astronomia “G. Galilei”, Università di Padova, vicolo dell’Osservatorio 3, 35122 Padova, Italy
7
INAF–Osservatorio Astronomico di Padova, vicolo dell’Osservatorio 5, 35122 Padova, Italy
8
Department of Astrophysics, University of Vienna, Tuerkenschanzstrasse 17, 1180 Vienna, Austria
9
Sterrewacht Leiden, Leiden University, Postbus 9513 2300 RA Leiden, The Netherlands
10
Max-Planck-Institut fuer extraterrestrische Physik, Giessenbachstrasse, 85741 Garching bei Muenchen, Germany
11
Instituto de Astrofísica de Canarias, Calle Vía Láctea s/n, 38200 La Laguna, Spain
12
Departamento de Astrofísica, Universidad de La Laguna, Calle Astrofísico Francisco Sánchez s/n, 38205 La Laguna, Spain
13
University of California Observatories, 1156 High Street, Santa Cruz, CA 95064, USA
14
Max-Planck-Institut fuer Astronomie, Koenigstuhl 17, 69117 Heidelberg, Germany
15
Department of Physics and Astronomy, Macquarie University, Sydney, NSW 2109, Australia
16
Australian Astronomical Observatory, PO Box 915 Sydney, NSW 1670, Australia
17
Centre for Astrophysics Research, University of Hertfordshire, College Lane, Hatfield AL10 9AB, UK
18
Sterrenkundig Observatorium, Universiteit Gent, Krijgslaan 281, 9000 Gent, Belgium
Received:
17
April
2019
Accepted:
13
June
2019
Abstract
The 31 brightest galaxies (mB ≤ 15 mag) inside the virial radius of the Fornax cluster were observed from the centres to the outskirts with the Multi Unit Spectroscopic Explorer on the Very Large Telescope. These observations provide detailed high-resolution maps of the line-of-sight kinematics, line strengths of the stars, ionised gas reaching 2–3 Re for 21 early-type galaxies, and 1–2 Re for 10 late-type galaxies. The majority of the galaxies are regular rotators, with eight hosting a kinematically distinct core. Only two galaxies are slow rotators. The mean age, total metallicity, and [Mg/Fe] abundance ratio in the bright central region inside 0.5 Re and in the galaxy outskirts are presented. Extended emission-line gas is detected in 13 galaxies, most of them are late-type objects with wide-spread star formation. The measured structural properties are analysed in relation to the galaxies’ position in the projected phase space of the cluster. This shows that the Fornax cluster appears to consist of three main groups of galaxies inside the virial radius: the old core; a clump of galaxies, which is aligned with the local large-scale structure and was accreted soon after the formation of the core; and a group of galaxies that fell in more recently.
Key words: galaxies: elliptical and lenticular / cD / galaxies: evolution / galaxies: formation / galaxies: kinematics and dynamics / galaxies: spiral / galaxies: structure
© ESO 2019
1. Introduction
One of the most ambitious goals of astronomy is to study the formation history of the structures in the universe, from the large scale environments such as clusters and groups of galaxies down to the cluster and/or group members. From the observational side, this was done by analysis of the light distribution, the stellar and gaseous kinematics, and the stellar population properties. All these observables can be compared with theoretical predictions on galaxy formation (see, e.g. Cappellari 2016). Further advances in the understanding of galaxy formation and evolution, in particular regarding early-type galaxies (ETGs), resulted from integral-field spectroscopy, which allows accurate mapping of the stellar and gas kinematics as well as of the stellar-population properties of thousands of nearby galaxies (see e.g. the SAURON, ATLAS3D, CALIFA, SAMI, and ManGA surveys described in de Zeeuw et al. 2002; Cappellari et al. 2011a; Sánchez et al. 2012; Croom et al. 2012, and Bundy et al. 2015, respectively). By combining two-dimensional spectroscopy and the large datasets, these studies derived important constraints on the role of the environment in shaping the galaxy structure and stellar populations.
In the deep potential well of clusters of galaxies, the gravitational interactions and merging between systems and/or with the intra-cluster medium play a fundamental role in defining the structure of galaxies and affecting the star formation. Galaxy harassment and ram-pressure stripping are thought to be partly responsible for the morphology-density relation (Dressler et al. 1997; van der Wel et al. 2010; Fasano et al. 2015), where ETGs dominate the central regions of the clusters, while late-type galaxies (LTGs, i.e. spirals and irregulars) populate the outskirts. Galaxy harassment results from the repeated high-speed tidal encounters of the galaxies inside the cluster, which can strip dark matter, stars, and gas from galaxies and generates faint streams detectable along the orbit of the galaxy through the cluster (Moore et al. 1998; Mastropietro et al. 2005; Smith et al. 2015). Ram-pressure stripping is the interaction of gas-rich galaxies with the hot interstellar medium, which can sweep off their atomic gas and therefore halt star formation (e.g. Chung et al. 2009; Davies et al. 2016; Merluzzi et al. 2016; Poggianti et al. 2017). This is the mechanism that might be responsible for converting late-type galaxies with ongoing star formation into quiescent early-type systems (Boselli et al. 2006). The ram-pressure stripping can also remove the hot, ionised gas within the halo of a galaxy (the so-called “strangulation”) so that the supply of cold gas is lost and, as a consequence, star formation is stopped (e.g. Dekel & Birnboim 2006; Peng et al. 2015).
A useful tool to investigate the many processes acting in clusters is the projected phase-space (PPS) diagram, which combines cluster-centric velocities and radii in one plot (see Smith et al. 2015; Jaffé et al. 2015; Rhee et al. 2017; Owers et al. 2019, and references therein). According to Rhee et al. (2017), the galaxies that are infalling for the first time into the cluster are found at projected distances beyond the virial radius with lower velocities than galaxies that are passing close to the pericentre, which are close to the cluster centre. The galaxies that fell into the cluster several gigayears ago are located in the regions of lower relative velocities. The PPS diagram turned out to be an efficient tool to map galaxy evolution inside a cluster and, in particular, to study star formation history (Mahajan et al. 2011; Muzzin et al. 2014) and the effect of ram-pressure stripping (e.g. Hernández-Fernández et al. 2014; Jaffé et al. 2015; Yoon et al. 2017; Jaffé et al. 2018).
In addition to the role of the environment, it has been clearly demonstrated that the mass of the galaxy is the other key parameter that regulates evolution and star formation history (see e.g. Peng et al. 2010; Cappellari et al. 2013; Greene et al. 2019, and references therein). The present day massive (M* ≃ 3 × 10¹¹ M⊙) and passive ETGs built their stellar mass by the gradual accretion of satellites forming the extended stellar halo around a compact spheroid (e.g. Kormendy et al. 2009; van Dokkum & Conroy 2010; Huang et al. 2018; Spavone et al. 2017). Therefore, the stellar content consists of the “in-situ” component, formed by collapse of the initial pro-galactic cloud, and the “ex-situ” population coming from the mass assembly in the stellar halo. The two components have different properties in the light distribution, kinematics and stellar populations. From the observational side, recent deep imaging surveys of nearby clusters have enabled extensive analyses of the light and colour distribution of galaxies in dense environments, out to the regions of the stellar halos where the imprints of the mass assembly reside (e.g. Duc et al. 2015; Capaccioli et al. 2015; Trujillo & Fliri 2016; Mihos et al. 2017). Investigations of mass assembly in the outer regions of galaxies have been conducted also by means of stellar kinematics and population properties (e.g. Coccato et al. 2010, 2011; Ma et al. 2014; Barbosa et al. 2018; Veale et al. 2018; Greene et al. 2019) and kinematics of discrete tracers like globular clusters (GCs) and planetary nebulae (PNe) (e.g. Coccato et al. 2013; Longobardi et al. 2013; Spiniello et al. 2018; Hartke et al. 2018). In particular, studies of the stellar population gradients out to the region of the stellar halos reveal a different age and chemical composition as function of the galacto-centric radius. They indicate a star formation history in the central in-situ component that differs from that in the galaxy outskirts (e.g. Greene et al. 2015; McDermid et al. 2015; Barone et al. 2018; Ferreras et al. 2019). This is consistent with the cosmological simulations of the massive ETGs that predict different metallicity profiles as function of the mass assembly history, with shallower profiles in the outskirts when repeated mergers occur (Cook et al. 2016).
Detailed analysis of integral-field measurements of the stellar kinematics showed that the massive ETGs, above the critical mass of Mcrit ≃ 2 × 10¹¹ M⊙ are slow rotators (SRs) and are found in the dense environment like the cluster core (Cappellari 2013). Massive ETGs seem to result from an evolutionary track that differs from that of the fast rotator (FR) ETGs. They are formed via intense star formation at high redshift at the centre of a massive dark matter halo, whereas FRs originate from the transformation of star-forming disc galaxies, where a bulge grows and star formation then quenches.
Clusters of galaxies are therefore excellent sites to study many processes of galaxy transformation, even considering that the environmental effects can already start to act in the less dense environments as groups, which, according to the hierarchical assembly framework, will merge into the cluster potential (e.g. De Lucia et al. 2012; Vijayaraghavan & Ricker 2013; Cybulski et al. 2014; Hirschmann et al. 2015). In this context, the Fornax3D (F3D) project (Sarzi et al. 2018, hereafter S18) provides a unique and complete integral-field spectroscopic dataset for the 33 galaxies (23 ETGs and 10 LTGs) brighter than mB ≤ 15 mag inside the virial radius of the Fornax cluster (Table C.1). Observations were taken with the Multi Unit Spectroscopic Explorer (MUSE, Bacon et al. 2010) on the ESO Very Large Telescope. The science objectives of the F3D project, the observational strategy, and the data reduction are described in S18.
Since the dataset spans quite a large range of stellar masses (109 < M* < 1012 M⊙) and morphological types, and covers the galaxies from their bright central region to the faint outskirts where the surface brightness is μB ≥ 25 mag arcsec−2, F3D allows to trace the galaxy evolution and mass assembly inside the cluster. By analysing the stellar and ionised-gas kinematics for all the F3D galaxies and the line-strength maps for the ETGs, the main goals of the present paper is to provide a global view of the assembly history of the cluster. In addition, taking advantage of the longer integration times in the MUSE pointings on the galaxy outskirts, F3D data allow the derivation of preliminary stellar population content of the stellar halo in the ETGs cluster members.
First results on the galaxy structure and evolution inside the cluster using F3D data were published by Pinna et al. (2019a; 2019b, hereafter P19a and P19b). From the detailed analysis of the stellar kinematics and stellar population of the edge-on lenticular galaxies FCC 153, 170, and 177, these studies addressed the thick-disc origin in the Fornax cluster. The first stellar population map and analysis for one of the brightest galaxies in the sample, FCC 167, is provided by Martín-Navarro et al. (2019), who studied the spatial variation of the initial mass function in this galaxy. In the same object, by combining the ionised-gas maps from F3D and ALMA data, Viaene et al. (2019) analysed the properties of the dust in the centre and discussed the origin of the interstellar medium in ETGs in the general framework of galaxy formation.
This paper is organised as follows. Section 2 gives a brief review of the main recent studies on the Fornax cluster from deep surveys and previous integral-field data. Section 3 provides a brief summary of the observations and data reduction. Section 4 describes the derivation of the stellar kinematics, the properties of the ionised gas, and the measurements of the line-strengths and stellar population parameters. Section 5 describes the results and includes the derivation of averaged kinematic and line-strength properties for the F3D ETGs. Section 6 and Sect. 7 discuss the results in the context of the cluster environment. Section 8 contains a summary of the main conclusions. The resulting maps together with a description of the properties of the individual galaxies are presented in Appendix A and B, respectively.
2. The Fornax cluster
The Fornax cluster is one of the best sites to study the properties of galaxies in an environment dominated by the gravitational potential of the cluster. It is the second most massive galaxy concentration within 20 Mpc (Blakeslee et al. 2009), after the Virgo cluster, with a virial mass of Mvir = 7 × 10¹³ M⊙ (Drinkwater et al. 2001). Extensive multi-wavelength observations are available for Fornax, including the Herschel survey (Davies et al. 2013), Chandra and XMM-Newton imaging of the cluster core (Scharf et al. 2005; Su et al. 2017), and Galaxy Evolution Explorer UV-imaging (Martin & GALEX Team 2005). In the optical wavelength range, the Hubble Space Telescope data (Jordán et al. 2007), the Dark Energy Camera data from the Next Generation Fornax Cluster Survey (Munoz et al. 2015), and the Fornax Deep Survey (FDS) with the VLT Survey Telescope (VST, Venhola et al. 2017; Iodice et al. 2019) are the deepest and widest datasets mapping the Fornax cluster out to the virial radius (Rvir ∼ 0.7 Mpc, Drinkwater et al. 2001). Upcoming data from the Atacama Large Millimeter/submillimeter Array (ALMA, Zabel et al. 2019) and neutral hydrogen data from the MeerKat survey (Serra et al. 2016) will provide a complete census of the cool interstellar medium in Fornax. In addition, long-slit, multi-object, and integral-field spectroscopy with several instruments mapped the stellar kinematics and populations of the cluster members (Bedregal et al. 2006; Scott et al. 2014).
The wealth of data available for the Fornax cluster allows to trace the cluster assembly history in great detail. The cluster hosts a vast population of dwarf and ultra compact galaxies (Munoz et al. 2015; Hilker 2015; Schulz et al. 2016; Venhola et al. 2017, 2018; Eigenthaler et al. 2018), an intra-cluster population of GCs (Schuberth et al. 2010; D’Abrusco et al. 2016; Cantiello et al. 2018; Pota et al. 2018) and PNe (Napolitano et al. 2003; McNeil-Moylan et al. 2012; Spiniello et al. 2018). It has a complex structure, indicative of continuing mass assembly (Drinkwater et al. 2001; Scharf et al. 2005; Iodice et al. 2019). The core is in an evolved state (Jordán et al. 2007), since most of the bright (mB < 15 mag) cluster members have transformed into ETGs, more so than in the Virgo cluster (Ferguson 1989). The FDS data suggest that the bulk of the gravitational interactions between galaxies takes place in the west-northwest core region, where most of the bright ETGs are located and where the intra-cluster baryons (i.e. diffuse light, GCs, and PNe) are found (D’Abrusco et al. 2016; Iodice et al. 2019; Pota et al. 2018; Spiniello et al. 2018). The west-northwest clump of galaxies may be a group falling into the cluster, which modified the structure of the galaxy outskirts (making asymmetric stellar halos), and produced the intra-cluster baryons, concentrated in this region of the cluster.
The ROSAT and XMM-Newton data have shown that the Fornax X-ray halo contains several components whose centroids are offset with respect to the optical galaxies. This is likely due to the sloshing movement of NGC 1399 and other bright galaxies within the central dark matter halo traced by the X-ray gas, combined with the infall of the NGC 1316 group into the cluster. In this process, the collisional component (i.e. the hot gas) is lagging behind the non-collisional ones (i.e. stars, GCs, and galaxies) due to ram pressure effects (Paolillo et al. 2002; Su et al. 2017; Sheardown et al. 2018). A comparison of the optical and X-ray data reveals that the reddest and most massive galaxies in the high-density region of the cluster, where the X-ray emission is still detected, have been depleted of their gas content by processes such as harassment or suffocation induced by ram pressure stripping, so the star formation stopped earlier than for the galaxies in the low-density region of the cluster (Iodice et al. 2019).
Stellar kinematics and stellar population gradients from long-slit data were provided by Bedregal et al. (2006, 2011) for 9 S0 galaxies. The measurements extend well beyond the bulges of these systems and allowed to map the kinematics and stellar population gradients in some detail for the first time. This revealed the existence of substructures, indicating possible interactions in the past. From the stellar population analysis, the resulting age and metallicity gradients are correlated, suggesting differences in the star formation history between the central and outer parts of the galaxies: the star formation ceased first in the outskirts, transforming the system in a bulge-dominated S0 (Bedregal et al. 2011). Scott et al. (2014) published integral field measurements for 10 members of the Fornax cluster (some of them overlapping with the galaxies of Bedregal et al. 2006) and mainly focused on the distribution of SRs and FRs inside the virial radius of the cluster. Compared to the more massive clusters, like Virgo and Coma, Fornax shows a decreasing fraction of SRs towards smaller projected environmental density at large cluster-centric radi. One of the only two SRs found by Scott et al. (2014) is the bright cluster galaxy NGC 1399 in the core of the cluster.
In addition to the previous works on the Fornax cluster, the F3D data provide high-resolution spatially-resolved measurements of the internal structure, kinematics of stars and ionised gas, and of the stellar populations and the ionisation state of the gas for all the bright galaxies inside the virial radius, therefore for a complete sample in morphology, stellar masses and radial distribution. Moreover, compared to the recent long-slit and integral-field data available for Fornax cited above, the MUSE mosaics allow to map the stellar kinematics and stellar populations for the ETGs at larger radii (Fig. 1, right panel), about two times more extended than the integral-field data of Scott et al. (2014) and more than 1–2 Re covered by the long-slit data of Bedregal et al. (2006).
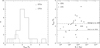 |
Fig. 1. Left: distribution of the spatial coverage of the F3D MUSE data for ETGs (solid line) and LTGs (dashed line) in units of effective radius, as measured along the major axis. Right: spatial coverage of the F3D ETGs (circles) and LTGs (crosses) as a function of the total stellar mass. The long-dashed and dash-dotted lines correspond to the average spatial coverage from the long-slit data of Bedregal et al. (2006) and integral-field data of Scott et al. (2014), respectively. The adopted values of Re for the comparison with literature are given in Table C.1. |
3. Observations and data reduction
The MUSE observations were carried out in service mode between July 2016 and December 2017. The wide-field mode ensured a field of view of 1 × 1 arcmin2 with a spatial sampling of 0.2 × 0.2 arcsec2. The wavelength range from 4650 to 9300 Å was covered with a spectral sampling of 1.25 Å pixel−1 and a nominal spectral resolution of FWHMinst = 2.5 Å at 7000 Å. The measured spectral resolution was on average FWHMinst = 2.8 Å with little variation (< 0.2 Å) with wavelength and position over the field of view. This is slightly larger than the nominal value due to the combination of different offset exposures taken at different position angles. As described in Sarzi et al. (2018), the measured spectral resolution was derived, for each galaxy, by using the twilight datacubes. They were combined using the same observational pattern (including rotations and offsets) as the galaxy exposures. The resulting line-spread function (LSF) was derived from the combined twilight cubes with a solar-spectrum template. The process was divided in a number of wavelength intervals and for each spaxel in order to measure the variation of the fitting parameters with wavelength and position over the field of view. For the analysis presented in this paper, the parametric LSF derived for the MUSE Ultra Deep Field 10 by Bacon et al. (2017) was adopted.
The total integration times for the central and middle pointings are about 1 h, while an integration of 1.5 h was necessary to reach the limiting surface brightness of μB ≃ 25 mag arcsec−2 in the outer pointings. A dither of a few arcseconds and a rotation by 90° were applied to the single exposures, in order to minimise the signature of the 24 MUSE slices on the field of view. Sky frames were acquired immediately before/after each science exposure in order to perform sky modelling and subtraction on the single spaxels. The observations were done in good seeing conditions with a median FWHM = 0.88 arcsec (Fig. 2). When available, some field stars were used to measure the FWHM. For central pointings, the FHWM of the nucleus was measured when there were no stars available.
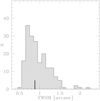 |
Fig. 2. Distribution of the seeing FWHM measured on the F3D MUSE pointings. The vertical thick segment marks the median value. |
The data reduction was performed with the MUSE pipeline version 2.2 (Weilbacher et al. 2012, 2016) under the ESOREFLEX environment (Freudling et al. 2013). The main steps included bias and overscan subtraction, flat fielding to correct the pixel-to-pixel response variation, wavelength calibration, determination of the line spread function, and illumination correction. By using the dedicated sky frames, the sky subtraction was done by fitting and subtracting a sky model spectrum on each spaxel of the field of view. The flux calibration and the first-order correction of the atmospheric telluric features were obtained using the spectro-photometric standard star observed at twilight. For each galaxy of the sample, the single pointings were aligned using reference stars and then combined to produce the final MUSE mosaics. These mosaics map the galaxy structure and stellar population out to 2–3 Re for the ETGs and out to 1–2 Re for the LTGs (Fig. 1, left panel). The MUSE data extend out to 2–4 Re (Fig. 1, right panel) for the more massive F3D galaxies (with a total stellar mass M* ≥ 109–1010 M⊙). Table C.1 lists the radial extent of the MUSE data along the major axis of each galaxy.
The quality of the F3D MUSE data was extensively assessed for FCC 167 in S18. They demonstrated that the residuals of the fitted spectra do not show any systematic feature over the whole adopted wavelength range. From the original sample listed in S18, FCC 267 was not observed and we do not have the data for this galaxy. The data analysis for FCC 213 (NGC 1399) will be the subject of a forthcoming paper including the F3D middle and halo pointings and the MUSE archival data covering the central regions.
4. Data analysis
The methods described in S18, P19a, and P19b were used to derive the kinematic and line-strength maps. These were obtained with the modular pipeline for the analysis of integral-field spectroscopic data developed by Bittner et al. (2019). Specific details on the main steps of the data analysis are provided in the following subsections.
4.1. Stellar kinematics
The derivation of the stellar kinematics was done with the Penalised Pixel-Fitting code (pPXF; Cappellari & Emsellem 2004; Cappellari 2017). It is based on a penalised maximum likelihood approach and it extracts a line-of-sight velocity distribution (LOSVD) parametrised by the mean velocity v, velocity dispersion σ, and Gauss-Hermite moments h3 and h4 (Gerhard 1993; van der Marel & Franx 1993). The MILES single stellar population (SSP) models (Vazdekis et al. 2012, 2015) with a spectral resolution of FWHM = 2.51 Å (Falcón-Barroso et al. 2011) were used as spectral templates. This model library covers a large range in age (from 30 Myr to 14 Gyr), total metallicity (−2.27 ≤ [M/H] ≤ 0.4 dex), and α-element overabundance ([α/Fe]=0 and 0.4 dex), thus minimising effects of template mismatch. All the MILES templates were broadened to the MUSE spectral resolution before performing the fit. The analysis was conducted on the full MUSE rest-frame wavelength range between 4800 and 9000 Å, in order to take into account also the NaD and CaT lines.
The emission lines in this wavelength range were masked during the analysis of the stellar kinematics. In addition, a fourth-order multiplicative Legendre polynomial was included in the fit to account for small differences in the continuum shape between the F3D data and spectral templates.
A reliable extraction of stellar kinematics, in particular of the higher-order Gauss-Hermite moments, requires a relatively high signal-to-noise ratio (S/N) (e.g. Gadotti & de Souza 2005). Thus, the Voronoi binning scheme of Cappellari & Copin (2003) was applied to spatially bin the data to an approximately constant S/N = 40. Spaxels which surpass this S/N threshold remain unbinned. Previous studies on F3D data (S18,P19a,P19b) have shown that S/N = 40 provides sufficient signal for the analysis whilst preserving a high spatial resolution. In addition, a minimum S/N threshold is applied by removing all spaxels below the isophote level which has an ⟨S/N⟩∼3. This avoids systematic effects in the low surface-brightness regime of the observations. The heliocentric systemic velocity from the stellar velocity field and the average velocity dispersion inside the r-band effective radius are given in Table C.1.
Uncertainties in the stellar kinematics were estimated by performing Monte Carlo simulations (e.g. Cappellari & Emsellem 2004; Wegner et al. 2012). This procedure is discussed in detail in P19b for FCC 170. They found errors of 6 km s−1 for v, 9 km s−1 for σ, and 0.03 for both h3 and h4. Similar error estimates were also obtained by S18 for FCC 167 and P19a for FCC 153 and FCC 177. For two galaxies of the sample, FCC 113 and FCC 285, which are LTGs with strong emission lines, the true velocity dispersion is so much below the instrumental resolution that pPxf has real problems getting a realistic value. For these two objects, the pPxF fit was constrained to determine only the first two moments of the LOSVD (i.e. velocity and σ). The error estimates on the σ for these two objects, derived from the Monte Carlo simulations are quite large (≥80%), therefore, the average values σe are not taken into account in the present study.
The radial profile of the kinematic position angle PAkin was measured by means of the Kinemetry code (Krajnović et al. 2006), and compared with the radial profile of the photometric position angle PAphot from Iodice et al. (2019) for ETGs and Raj et al. (2019) for LTGs. The mean value of PAkin and the difference ΔPA with respect to the mean value of PAphot are given in Table C.1. The kinematic PA is poorly estimated for galaxies with an irregular rotation pattern and/or very low values of rotational velocity like FCC 90 (Fig. A.2). For galaxies characterised by the presence of strong dust lanes in their inner regions, the mean value of PAkin was calculated for radii larger than 5 arcsec.
The stellar kinematic maps of v, σ, h3, and h4 derived from S/N = 40 Voronoi-binned MUSE data and the radial profiles of PAkin and PAphot for the F3D galaxies are shown in Appendix A.
4.2. Ionised-gas distribution and kinematics
The derivation of the ionised-gas distribution and kinematics was done with the analysis approach discussed in S18. A simultaneous spaxel-by-spaxel fit was done for both the stellar and ionised-gas contribution to the MUSE spectra with the Gas and Absorption Line Fitting code (GandALF, Sarzi et al. 2006; Falcón-Barroso et al. 2006) in the wavelength range between 4800 and 6800 Å and using a two-component reddening correction to adjust for the stellar continuum shape and observed Balmer decrement. In an effort to decrease the impact of template-mismatch on the emission-line measurements, all the models of the MILES library were used in order to achieve the best possible fit to the stellar continuum. As illustrated in S18 and Viaene et al. (2019) this provides a rich set of ionised-gas parameter maps. For the purpose of this work, only the maps of the observed flux and velocity of the Hα emission and of the classification of the ionised-gas emission according to the standard Baldwin, Phillips & Terlevich (BPT) diagnostic diagram (Baldwin et al. 1981) were analysed. These are shown in Appendix A for the 13 F3D objects with a significant amount of diffuse ionised-gas emission, which generally occurs in the central regions. The remaining galaxies display only a number of unresolved sources of [O III]λ5007 emission. These are PNe, which will be discussed in a forthcoming paper.
The star-formation rate (SFR) was calculated through the conversion SFR (M⊙ y−1) = 5.5 × 10−42 LHα (erg s−1) provided by Calzetti et al. (2012) and from the total de-reddened Hα fluxes assuming a distance of 20 Mpc (Blakeslee et al. 2009), in the absence of secure distance measurements for the majority of the line-emitting objects in the F3D sample. Table 1 provides two estimates of the spatially integrated SFR: SFRup, which combines all spaxels classified as exhibiting “star-forming” or “transition” emission-line ratios in the BPT diagnostics (this is considered as an upper limit on the SFR, assuming that all transition spaxels are powered by O-type stars); and a second estimate, SFR, which includes only the spaxels classified as “star-forming”, and is considered as a lower limit.
Star-formation rate and Hα equivalent width for the F3D galaxies.
Table 1 also provides measurements for the equivalent width of the de-reddened1 Hα emission when observed against the integrated MUSE spectrum of the galaxy. This gives an indicative measure for the specific star-formation rate in the regions with ionised-gas emission, which generally lie within the central MUSE pointing. As in the case of SFR estimates, the upper-limits combine “star-forming” and “transition” spaxels, and the lower limits are based on “star-forming” spaxels only.
4.3. Line-strength indices and stellar population properties
The line-strength indices maps were derived from the MUSE spectra by adopting a threshold of S/N = 200 for the Voronoi binning. In addition, to avoid regions where the sky subtraction could have left residuals, the analysis was performed on a restricted wavelength range from 4800 to 5500 Å. The emission-line analysis was repeated to obtain emission-subtracted spectra. The line-strength indices of Hβ, Fe5015, Mgb, Fe5270, and Fe5335 were computed in the LIS system (Vazdekis et al. 2010, 2015) by adopting the routines of Kuntschner et al. (2006).
Subsequently, the measured line-strength indices were compared to those predicted by the MILES model library (Vazdekis et al. 2012) to provide the stellar age, [M/H], and [Mg/Fe] abundance. The best-fitting SSP model was determined by means of a Markov-Chain-Monte-Carlo algorithm following the prescriptions by Martín-Navarro et al. (2018).
Since the line-strength analysis is based on the emission-line subtraction that comes from a GandALF fit with the SSP models, for galaxies having strong emission lines (i.e. almost all LTGs of the F3D sample) an imperfect flux calibration could introduce a bias in the estimate of the emission lines. Therefore, due to such an additional complication, the stellar population analysis of the LTGs will be presented in detail in a forthcoming paper (Martín-Navarro et al., in prep.).
The maps of the Hβ, Fe5015, and Mgb line-strength indices for all the F3D ETGs are shown in Appendix A.
5. Results
This section presents an overview of the global properties of the F3D galaxies in terms of mean stellar kinematic properties, ionised-gas emission and star formation activity, and mean stellar population properties. A detailed description of the individual galaxies is provided in Appendix B.
5.1. Mean stellar kinematic properties
The simplified scheme for kinematical classification presented by Schulze et al. (2018), based on Krajnović et al. (2011), was adopted to describe the average stellar kinematics maps. Visual inspection reveals that the velocity fields of 22 out 31 F3D galaxies (71%) constitute a regular spider diagram and therefore these galaxies are classified as regular rotators. Most of the ETGs and all the LTGs, except for FCC 306, are regular rotators. FCC 306 is the faintest galaxy of the sample (Table C.1) and it resembles a prolate rotator because its axis of rotation coincides with the photometric major axis (Fig. A.28). The kinematical classification for all the F3D galaxies is given in Table C.1. A kinematically distinct core is observed in five F3D galaxies (16%). All of them are ETGs, whose velocity field shows a central rotating component but low or even no rotation at larger radii. In all but one of the galaxies with a distinct core, the inner structure is characterised by a higher velocity dispersion and a redder colour (g − i ∼ 1.2 mag, Iodice et al. 2019) with respect to the surrounding regions. FCC 301 hosts an embedded disc, which was also identified by Bedregal et al. (2006) with long-slit spectroscopy. It has a lower velocity dispersion (Fig. A.27) and bluer colour (g − i ∼ 0.5 mag, Iodice et al. 2019) than the outer regions. A kinematically decoupled core is observed in two ETGs (6%). They are FCC 184 and FCC 193, which are the two brightest barred galaxies of the sample in the core of the cluster. As discussed in Sect. 6, the different kinematic and photometric properties of the decoupled components correlate with the location of their host galaxies inside the cluster and suggest a different formation process.
Following Emsellem et al. (2011), the mean of the specific stellar angular momentum λRe of all the F3D galaxies was computed within Re. It is plotted as a function of the ellipticity ϵe measured at Re in Fig. 3 (left panel) to identify fast-rotating (FRs) and slow-rotating galaxies (SRs). The values of λRe and ϵe and the kinematic type of all the F3D galaxies are reported in Table C.1. In the λRe − ϵe plane, the F3D galaxies are consistent with values derived for the galaxies in the ATLAS3D and CALIFA surveys (Emsellem et al. 2011; Falcón-Barroso et al. 2011). The Fornax cluster is dominated by FRs. Most of them are ETGs and the remaining ones are LTGs. Only two F3D galaxies are SRs: the brightest central galaxy FCC 213 (NGC 1399) and FCC 276. Data for FCC 213 comes from Scott et al. (2014). The results are consistent with those found by Scott et al. (2014) on a smaller sample of cluster members. All the ETGs with a distinct core, except for FCC 301, are close to the SR regime. This further indicates that the distinct core of FCC 301 has a different kinematic structure than the others, being similar to a fast-rotating inner disc.
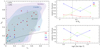 |
Fig. 3. Left: specific stellar angular momentum of the F3D ETGs (circles) and LTGs (crosses) as a function of the ellipticity measured at the effective radius. Galaxies classified as regular rotators (RRs) are shown with red symbols. The light-blue symbols correspond to galaxies with a distinct core (DC). The blue circle corresponds to the only non-rotating ETG of the sample (NR). Galaxies with a kinematically decoupled core (KDC) are shown with magenta symbols. The black asterisk corresponds to FCC 213 (NGC 1399) and it is taken from Scott et al. (2014). The black solid line divides FRs from SRs according to Emsellem et al. (2011). The light green, light blue, and light magenta areas indicate the location of the galaxies from the ATLAS3D (Emsellem et al. 2011), CALIFA (Falcón-Barroso et al. 2011), and MANGA survey (Graham et al. 2018), respectively.. Right: relative fraction of the F3D SRs (red circles), FRs (blue circles), and LTGs (green circles) as function of the projected radius from the centre of the Fornax cluster in units of virial radius (top) and as a function of the local projected density of the cluster (bottom). The vertical dashed line separates the high and low-density regions of the cluster. |
The fractions of the slow and fast-rotating ETGs as well as of the LTGs are shown as function of the projected distance from the cluster centre in Fig. 3 (top right panel) and as function of the local projected galaxy density of the cluster in Fig. 3 (bottom right panel). In the region of transition from higher to lower galaxy density at 0.4 Rvir ≤ Rproj ≤ 0.8 Rvir where Σ ≤ 40 Gal Mpc−2 (Iodice et al. 2019), FRs and SRs decrease whereas LTGs increase. In the low-density region of the cluster (Rproj > 0.8 Rvir), there are no SRs. The fraction of FRs increases, and that of the LTGs decreases. These results improve upon the findings of Scott et al. (2014) for Fornax since all the bright galaxies inside the virial radius are now taken into account. In particular, even considering the larger number of galaxies, the results confirm that the degree of segregation of the SRs towards the centre in Fornax is less pronounced than in the more massive Virgo and Coma clusters (Cappellari et al. 2011b; Houghton et al. 2013). The implications for the formation and segregation of the different kinematic types are addressed in Sect. 8.
The difference ΔPA between the mean kinematic and photometric position angle of the F3D galaxies is shown in Fig. 4 as function of the projected distance from the cluster centre. On average, larger position angle differences (ΔPA > 2°) are found for the LTGs with disturbed morphology, as FCC 263, FCC 285, and FCC 306 (Figs. A.22, A.25, and A.28). In particular, the kinematics for FCC 306 suggests a prolate rotation for this object. For the ETGs, larger position angle differences (ΔPA > 2°) are found for the galaxies in the high-density region of the cluster (Rproj ≤ 0.4 Rvir). At larger cluster-centric distances, the measured values of ΔPA are consistent with zero, except for the barred galaxy FCC 310 (Fig. A.30). However, it should be noticed that the four barred galaxies of the sample are characterised by a larger ΔPA in the region where the bar is prominent (FCC 184, Fig. A.16; FCC 190, Fig. A.17; FCC 193, Fig. A.18; FCC 301, Fig. A.30).
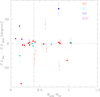 |
Fig. 4. Difference between the mean kinematic and photometric position angles for the F3D galaxies as function of the projected radius from the centre of the Fornax cluster in units of virial radius. Symbols are as in the left panel of Fig. 3. The vertical dashed line separates the high and low-density regions of the cluster. |
5.2. Ionised-gas emission and star formation activity
Extended ionised-gas emission was detected in 13 galaxies corresponding to 42% of the cluster members inside the virial radius (Table 1). Five galaxies are ETGs (FCC 90, FCC 119, FCC 167, FCC 184, and FCC 219), three of them close to the cluster core, whereas the remaining eight objects display pervasive star-formation activity. Seven of the eight are LTGs. The exception is FCC 90 which is classified as a peculiar S0. Three galaxies display star-forming regions localised in the nucleus (FCC 119, Fig. A.4) or around it (FCC 179, Fig. A.14; FCC 184, Fig. A.16). The two remaining galaxies are dominated by the typical diffuse LINER-like emission observed in ETGs (FCC 167, Fig. A.10; FCC 219, Fig. A.19). However, for FCC 167 Viaene et al. (2019) discussed the evidence for some circumnuclear star formation, as indicated by the presence of molecular gas and composite SF/AGN emission. In FCC 90 the ionised-gas emission is entirely powered by star formation and it shows a concentrated distribution towards the centre, where some modest rotation is detected. A plume of material to the west of the galaxy appears to be unsettled (Fig. A.2). In FCC 312 the nebular emission is dominated by H II regions, although some highly-excited material protrudes out of the disc near, but not exactly along, the direction of the galaxy minor axis (Fig. A.31).
For most of the F3D galaxies, the observed ionised-gas distribution and kinematics are globally consistent with a settled system in coherent rotation around the galaxy centre. Yet, a regular disc-like kinematics is observed only in approximately half of the galaxies (e.g. FCC 179, Fig. A.14; FCC 290, Fig. A.26; FCC 312, Fig. A.31), whereas in many other objects there is evidence of unsettled material (e.g. FCC 90, Fig. A.2; FCC 184, Fig. A.16; FCC 219, Fig. A.19).
5.3. Mean stellar population properties of ETGs
For all the F3D ETGs, the luminosity-weighted mean of the age, [M/H], and [Mg/Fe] abundance was derived from the line-strength indices in two galaxy regions: the bright central part inside 0.5 Re and the outskirts, outside the transition radius Rtr defined by Spavone et al. (in prep.) and listed in Table 2. It varies between 0.6 Re and 3.6 Re. Spavone et al. (in prep.) presented a multi-component photometric decomposition of the azimuthally-averaged surface-brightness profiles of the ETGs in FDS. They determined the transition radius between the bright central component (which consists mostly of stars formed in situ), a second component corresponding to the outskirts (where there is an increasing contribution from material accreted during the mass assembly process), and a third component corresponding to the envelope.
Mean stellar population properties of the F3D ETGs.
The central and outer galaxy regions are defined by taking into account the ellipticity and PA from FDS. This choice allows a direct comparison of the stellar population properties with the colour properties derived from FDS for the same galaxy regions. The deep FDS imaging shows that the ETGs in the high-density region of the Fornax cluster have redder g − i colours than galaxies at larger cluster-centric distances. This behaviour persists in the colour distribution derived in the inner 0.5 Re. For the F3D ETGs, the mean age, [M/H], and [Mg/Fe] are derived inside the same regions (i.e. in the inner 0.5 Re). Values are listed in Table 2 and plotted as function of total stellar mass in Fig. 5 (left panels). The ETGs in the high-density region of the cluster (Rproj ≤ 0.4Rvir) have central mean ages in the range between 10 and 14 Gyr with an average value close to 13 Gyr (Fig. 5, top left panel). The scatter in the mean age of the central parts increases for galaxies in the low-density region (∼1 − 11 Gyr). The three younger galaxies are FCC 90 (at Rproj = 0.83 Rvir with a central mean age of ∼1 Gyr), FCC 255 (at Rproj = 0.85 Rvir with a central mean age of ∼4 Gyr) and FCC 119 (at Rproj = 1.39 Rvir with a central mean age of ∼7 Gyr). FCC 90 is a recent infaller (Fig. 6) and the FDS data show that this galaxy is very blue close to the centre. The younger age and detection of ionised gas in the galaxy centre suggest the presence of ongoing star formation. The average of the mean age of all other ETGs in the low-density region of the cluster is ∼11 Gyr, which is similar to the age of the galaxies in the high-density region. The more massive galaxies are always the older systems both in the low and high-density regions of the cluster.
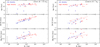 |
Fig. 5. Left: mean age (top), total metallicity [M/H] (middle), and [Mg/Fe] abundance ratio (bottom) in the central parts of the F3D ETGs located in the high (red circles) and low-density region (blue circles) of the cluster as a function of the total stellar mass. The red and blue lines in the middle and bottom panels are the least-square fits of the values for the central parts of the ETGs in the high and low-density regions of the cluster, respectively. The error bars in the low-left corner indicate the average uncertainty derived for each quantity. Right: same as in the left panels but for the outskirts of the F3D ETGs. The least-square fitting lines of the left panels are shown as dashed lines for comparison. |
The relation between the total stellar mass and central mean [M/H] is shown in Fig. 5 (middle left panel) and, as expected, it suggests that the more massive galaxies are more metal rich. In addition, there is an evident segregation in the central mean [M/H] as function of the cluster environment. In the same mass range (1.5 × 10⁹ < M* < 3 × 10¹⁰ M⊙), the ETGs in the high-density region are indeed more metal rich ([M/H] = −0.1 ± 0.1 dex) with respect to the other galaxies at larger cluster-centric distances ([M/H] = −0.3 ± 0.2 dex). This suggests that the redder colours of the bright central regions of the ETGs in the high-density region of the cluster with respect to those at larger distances are due to a difference in [M/H]. A similar trend, but with a larger scatter, is also observed for [Mg/Fe] in Fig. 5 (lower left panel). The massive ETGs in the high-density region have higher central mean [Mg/Fe] ([Mg/Fe] = 0.16 ± 0.04 dex) than the cluster members at larger cluster-centric distances ([Mg/Fe] = 0.12 ± 0.03 dex).
The mean age, [M/H], and [Mg/Fe] in the outskirts of the F3D ETGs are listed in Table 2 and plotted as function of total stellar mass in Fig. 5 (right panels). It has to be noticed that the derived values should be considered as “lower” limits of the stellar population parameters of the total accreted component, since at the mapped galactocentric radii the presence of the underlying in-situ component is indistinguishably mixed with the accreted stellar component.
On average, the outskirts of the ETGs in the high-density region of the cluster are only ∼1 Gyr younger than the inner parts of the galaxies and span a range between 10 and 13 Gyr with an average age of ∼12 Gyr (Fig. 5, top right panel), except for FCC 90 which has ongoing central star formation. Therefore, taking into account the average uncertainties on the age estimates, the central regions and the galaxy outskirts have stellar populations of comparable age. The relation between the total stellar mass and mean [M/H] is still in place for the outskirts (Fig. 5, middle right panel), but with a larger scatter. By comparing the least-squares fit computed for the values in the central parts and taking into account the average uncertainties, there is an indication that the ETGs in the high-density region have more metal-poor outskirts. This is consistent with previous results from Bedregal et al. (2011) for a small sub-sample of S0 galaxies in Fornax. By measuring the stellar population gradients, they found that, on average, steeper metallicity gradients towards the outskirts. For ETGs in the low-density region of the cluster, the difference in mean [M/H] is still appreciable but it is more pronounced in the galaxies with a peculiar central structure (e.g. FCC 90 and FCC 301). This analysis allows to constrain the mean [M/H] of the outskirts as function of the cluster environment and provides evidence that ETGs in the high-density region have more metal-poor outskirts than those in the low-density region of the cluster. Moreover, the difference in mean [M/H] between the central parts and the outskirts is larger for the more massive galaxies in the high-density region. This implies that the outskirts have a lower [M/H] (with an average [M/H] = −0.3 ± 0.1 dex) than the central in-situ dominated component. This is in agreement with the properties of the accreted populations identified in the edge-on galaxies, especially in their thick discs (P19a, P19b).
Even if the scatter is larger, on average, [Mg/Fe] is higher in the galaxy outskirts than in the central parts. The [Mg/Fe] values remain almost the same in the outskirts of the galaxies in the low-density regions (Fig. 5, lower right panel).
6. The assembly history of the Fornax cluster
The projected phase-space (PPS) diagram of the F3D galaxies (Fig. 6) was investigated in order to trace the structure of the Fornax cluster and address its formation history. To this aim the line-of-sight radial velocity Vlos of each F3D galaxy was derived relative to the cluster recession velocity, which was assumed to be that of FCC 213 (NGC 1399, Vlos = 1425 km s−1), the brightest member in the core of the Fornax cluster. The ratio between Vlos and the cluster velocity dispersion (σlos ≃ 300 km s−1, Drinkwater et al. 2001) is plotted in the PPS diagram as a function of the projected cluster-centric distance of the galaxy in units of virial radius Rproj/Rvir. This distance is a lower limit for the three-dimensional distance of the galaxy from the cluster centre. The PPS unveils the assembly process of the cluster and it traces the location of galaxies that have reached the “virialised” region. This is constrained by the escape velocity of the cluster, which is shown with a solid line in Fig. 6. It was derived by assuming a mass density profile for the dark matter halo as described in Navarro et al. (1997) and following the prescriptions of Rhee et al. (2017).
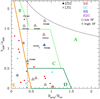 |
Fig. 6. Projected phase-space diagram of the F3D ETGs (filled circles) and LTGs (crosses). Symbols are as in the left panel of Fig. 3. Galaxies with low (black open triangles) and high star formation (black open circles) are also shown. The black solid line corresponds to the cluster escape velocity. The vertical dashed line separates the high and low-density regions of the cluster. According to Rhee et al. (2017), region A is populated by the first infallers, regions B and C (together delimited by the dashed light-green, solid orange, and solid green lines) contain 80% of the recent infallers, regions D (delimited by the solid green and solid orange lines) and E (delimited by the solid orange line) contain 40% of the intermediate infallers, and the ancient infallers are found in region E. The name of the galaxies classified as recent infallers are also indicated on the plot. |
By selection, all the F3D galaxies are located inside the virial radius of the Fornax cluster and have consistently smaller values of Vlos/σlos with respect to the cluster escape velocity. Most of them are characterised by small values of both Vlos/σlos and Rproj/Rvir: these are galaxies residing close to the cluster core. According to the simulations by Rhee et al. (2017), this is the PPS regime of the ancient infallers, which entered the cluster potential in an early stage of the cluster formation, at an indicative time ≥8 Gyr ago (region E in Fig. 6). At a larger Rproj/Rvir, galaxies in the PPS reside in the regime of intermediate infallers (region D in Fig. 6), which settled into the cluster later, some time between 4 and 8 Gyr ago. The PPS region of the ancient infallers is populated by ETGs and it hosts most of the galaxies with a kinematically distinct core or a kinematically decoupled core. The only LTG in this region is FCC 179, for which there is no detection of the ionised-gas emission (Table 1). Here there are few galaxies with smaller values of the Hα equivalent width and with ionised-gas emission close to the galaxy centre (Table 1). Most of the intermediate infallers (region D in Fig. 6) are still ETGs, but ∼30% of the LTGs are found as well in this region of the PPS diagram that show high ionised-gas emission (Table 1). Taking into account the ranges given by the simulations, it is reliable to consider the three galaxies (FCC 153, FCC 263, FCC 277) located very close to the regions E and D as intermediate infallers. For simplicity, we grouped as recent infallers all galaxies that are expected to have large values of both Vlos/σlos and Rproj/Rvir in the PPS diagram. This corresponds to regions A, B and C in Fig. 6. According to Rhee et al. (2017), here there are galaxies that entered the cluster from 1 to 4 Gyr ago. Four of the seven galaxies in this regime are LTGs, while the remaining ones are ETGs. Most of these galaxies are actually located in the low-density region of the cluster, except for the peculiar S0 galaxy FCC 148 and the spiral galaxy FCC 179, which are closer in projection to the cluster core. Among the recent infallers, FCC 148 is the only ETG showing a blue nucleus and ionised-gas emission and FCC 301 hosts a decoupled core with different kinematic and photometric properties with respect to the other F3D decoupled cores. These peculiar properties are a further indication for a different formation mechanism of the nuclear structures in these galaxies. Half of the galaxies in this PPS regime show large values of the Hα equivalent width (Table 1).
Figure 7 shows the distribution of the F3D galaxies on the sky: the ancient infallers are mostly distributed along the north-south filament on the west side of the cluster, and all of them are located inside the high-density region of the cluster. The intermediate and recent infallers are found at larger cluster-centric distances (Rproj ≥ 0.3 Mpc) in the low-density region of the cluster. Most of these galaxies are characterised by ionised-gas emission and evidence for ongoing star formation. The comparison with the X-ray emission detected in the Fornax cluster (e.g. Frank et al. 2013) shows that all the ancient infallers are located inside the X-ray halo whereas the galaxies with active star formation are found at larger cluster-centric radii, far away from the X-ray emission.
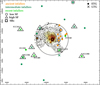 |
Fig. 7. Distribution of the F3D ETGs (circles) and LTGs (crosses) onto the sky plane. The right ascension and declination (J2000.0) are given in degrees on the horizontal and vertical axes of the field of view, respectively. The background image and contours map the X-ray emission in the energy range 0.4–1.3 KeV as measured by XMM-Newton (Frank et al. 2013). The dashed circle indicates the transition from the high-to-low density region of the cluster at 0.4 Rvir. Orange, green, and light-green symbols represent the ancient, intermediate, and recent infallers, respectively, according to the analysis of the PPS diagram shown in Fig. 6. Galaxies with low (black open triangles) and high star formation (black open circles) are also shown. The slow rotators (SRs) are marked with open black squares. As in Fig. 6, all the recent infallers are labelled. |
Combining the two-dimensional distribution of the F3D galaxies shown in Fig. 7 with the PPS information and the MUSE results on stellar kinematics, star formation, and stellar populations, the Fornax cluster appears to consist of three main groups, where galaxies have common properties: the core, the north-south clump, and the infalling galaxies.
The core is dominated by the potential of the brightest and massive cluster member FCC 213 (NGC 1399), which is one of the only two SRs inside the virial radius (Fig. 3 and see also Scott et al. 2014). This coincides with the peak of the X-ray emission (Fig. 7).
The clump on the north-northwest side of the cluster contains the redder (Iodice et al. 2019) and more metal-rich galaxies of the F3D sample (Table 2) and all of them are FRs (Table C.1). The majority of the kinematically distinct cores are found in the galaxies of this clump, and two out of a total of three show ionised-gas emission in the centre. On average, the larger differences between the kinematic and photometric position angles are found in the ETGs populating this group (Fig. 4). Finally, the outskirts of these galaxies have lower metallicity than their bright central regions (Fig. 5).
The third group of galaxies in the Fornax cluster consists of the recent and intermediate infallers. In projection, they are distributed nearly symmetrically around the core in the low-density region of the cluster (Rproj ≥ 0.4 Mpc). The majority of them are LTGs with ongoing star formation (Table 1). In this region, galaxies have on average lower [M/H] and [Mg/Fe] with respect to clump galaxies (Table 2 and Fig. 5). Most of the LTGs show signs of interaction with environment and/or minor merging events in the form of tidal tails and disturbed molecular gas as found in FCC 312 (Zabel et al. 2019; Raj et al. 2019), or havedisturbed ionised-gas as FCC 263 (see Appendix B). This suggests that the structure of these galaxies has been modified upon entering the cluster potential (Boselli et al. 2006).
Clusters have a significant fraction (25–40%) of their galaxies accreted through galaxy groups (McGee et al. 2009; De Lucia et al. 2012). The clump may result from the accretion of a group of galaxies during the gradual build-up of the cluster, which induced the observed asymmetry in the spatial distribution of the bright galaxies (Iodice et al. 2019). All galaxies in the clump have similar colours, age, [M/H] and are fast rotator ETGs, with stellar masses in the range 0.3 − 9.8 × 10¹⁰ M⊙ (see Table C.1 and Fig. 8). Galaxy interactions are more frequent in groups than in clusters due to their lower velocity dispersion (Tremaine 1981), therefore the cluster members accreted as part of groups can undergo pre-processing that modifies their structure and internal dynamics. This would explain the high fraction of kinematically decoupled components in the galaxies belonging to the clump, and also the thick discs observed in the three edge-on S0 galaxies studied by P19a and P19b. The deep FDS imaging revealed that the region of the cluster where the clump is located hosts the bulk of the gravitational interactions between galaxies. It is the only region inside the virial radius where intra-cluster baryons were found, including faint stellar filaments between some of the galaxies (Iodice et al. 2016, 2017).
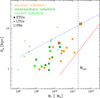 |
Fig. 8. Mass-size distribution of the F3D ETGs (circles) and LTGs (crosses). Orange, green, and light-green symbols represent the ancient, intermediate, and recent infallers, respectively, according to the analysis of the PPS diagram shown in Fig. 6. Galaxies with low (black open triangles) and high star formation (black open circles) are also shown. The slow rotators (SRs) are marked with open black squares. The critical mass, defined by Cappellari (2013), is marked by the black dashed line. For reference, the blue dash-dotted line and the solid red line indicate the upper limit of the spiral galaxies and the lower limit of the ETGs from ATLAS3D sample (Cappellari et al. 2013). |
The low star-formation activity detected in the centre of only two clump galaxies suggests that harassment or suffocation induced by ram pressure stripping depleted the gas content. This is further supported by the presence of X-ray emission in this region of the cluster (Fig. 7). Therefore, the star formation in clump galaxies stopped earlier than for those that entered later into the cluster potential. These are the galaxies in the third group, consisting of recent and intermediate infallers which show ongoing star formation and are located outside the X-ray emission. According to numerical simulations (Hwang et al. 2018), galaxies entering the cluster can lose the cold gas but still retain star-formation activity during the collision phase due to the interaction with massive cluster members and/or with the hot gas. This could be the case for FCC 179 (Fig. A.14), a late-type galaxy with spiral arms and central star formation, which recently arrived in the high-density region of the cluster (Fig. 6) where the X-ray emission is still present (Fig. 7).
On a larger scale, the sub-clustering structure of the Fornax cluster was already suggested by Nasonova et al. (2011), who studied the distribution of galaxies in the vicinity of the cluster. This evidence supports the hypothesis that the assembly of the Fornax cluster is still ongoing (Dunn & Jerjen 2006). The galaxies residing in the clump close to the cluster centre are distributed north-south and follow the cosmic web filament connecting the Fornax-Eridanus large-scale structure (Nasonova et al. 2011). These findings also support the idea that the clump in the Fornax cluster, which consists of galaxies with similar properties in terms of morphology, kinematics, and stellar populations, is one of the smaller galaxy groups in the surrounding large-scale structure that, according to the PPS analysis, merged into the potential well of the massive cluster member NGC 1399, more than 8 Gyr ago. The stellar masses of the ETGs populating the clump, as well as of all others cluster members, are an order of magnitude lower than the critical mass Mcrit ≃ 2 × 10¹¹ M⊙ (see Fig. 8) that defines the transition region in the mass-size relation from FRs ETGs to SRs in the high-density environments (Cappellari 2013). Therefore, according to Cappellari (2013), the galaxies residing in the clump were not massive enough to form or maintain their own SR before becoming part of the Fornax cluster, whereas NGC 1399 has a stellar mass larger than Mcrit and, consistently, it is the SR in the core (Fig. 7). Compared to the other nearby massive Virgo and Coma clusters, Fornax appears to be in an intermediate evolutionary phase. As observed in Coma (Cappellari 2013), the slow rotator in the core of the Fornax cluster is segregated in mass (i.e. with M* ≥ Mcrit) from the fast rotators (Fig. 8). In contrast, the Virgo cluster is a dynamically young and unrelaxed cluster (Mihos et al. 2017), with a higher fraction of spiral galaxies than Coma and Fornax (Cappellari et al. 2011a), and with a larger numbers of SRs associated with substructures identified in the cluster, consistent with being in an early phase in the cluster assembly. As observed in Coma and Virgo, the fast rotators ETGs have smaller Re than the spirals, which are still on a parallel sequence to the ETGs, as in Virgo but less pronounced in Coma (see Cappellari 2013, and Fig. 8). The other SR found in Fornax, FCC 276 located on the east side of the cluster in the transition region from high to lower density, has comparable properties to the SRs in less dense environments.
In conclusion, the structure of the cluster that emerges from the above analysis is based on combining the two-dimensional distribution of the F3D galaxies with the PPS information and with the structural properties of the galaxies (morphology, north-wests, kinematics, and stellar population). There is a clear segregation between galaxies classified as ancient infallers, not only in terms of projected location inside the cluster but mainly in the average observed properties, and the galaxies belonging to the other two classes (intermediate and recent infallers). This observational evidence reflects the assembly history of the cluster and it could be considered as a baseline for future simulations designed to trace the formation of the Fornax cluster.
7. The mass assembly in the outskirts of ETGs
The stellar population analysis in ETGs provides stringent constraints on the properties of the galaxy outskirts and are extremely important for a direct comparison with theoretical predictions to constrain the mass assembly of the stellar halo. The study of the [M/H] and [Mg/Fe] maps of the F3D galaxies is beyond the scope of this paper and will be the subject of a forthcoming work (Martín-Navarro et al., in prep.). Nevertheless, it is possible to draw some conclusions on the mass assembly of the galaxies in the Fornax cluster. According to Spavone et al. (in prep.), the galaxies in the low-density region of the cluster have a quite small accreted mass fraction (< 40%), while galaxies in the high-density region have a remarkably large accreted mass fraction (> 80%). According to simulations (Pillepich et al. 2018), these quantities correlate with total stellar mass, meaning that more massive galaxies have a larger stellar-halo mass fraction. Given that, the small difference in stellar population properties between the central parts and outskirts in the less massive galaxies located in the low-density region suggests that inner and outer measurements are tracing the same stellar component, suggesting that there is no significant contribution from the accreted material. This is also consistent with the assembly history of the cluster, as inferred from the PPS diagram (Fig. 6), which suggests that the galaxies in the low-density region are intermediate and recent infallers, which did not undergo the strong tidal interactions responsible for gas stripping and accretion from the outside.
In contrast, the galaxies in the high-density region of the cluster, that are the massive members residing in north-south clump, have a higher fraction of accreted material that dominates most the galaxy structure (Spavone et al. in prep.). The FDS data show that the mass assembly in this region of the cluster is an ongoing process. In these galaxies, the outskirts are more metal poor (−0.4 ≤ [M/H] ≤ 0 dex) than the central in-situ dominated parts. According to the Auriga simulations of Milky Way-mass galaxies (Monachesi et al. 2019) for galaxies in the range of masses (2 − 10)×1010 M⊙, which is the same mass range of the massive galaxies of the F3D sample, the observed [M/H] values are consistent with an accreted stellar mass of ∼2 × 10¹⁰ M⊙. This is in agreement with the high fraction of accreted mass estimated from the analysis of the light distribution (Spavone et al. in prep.).
8. Concluding remarks
The superb capabilities of MUSE at the Very Large Telescope provide high-quality, integral-field spectroscopic data to map the structure of all the bright (mB ≤ 15) galaxies within the virial radius of the Fornax cluster. The stellar and ionised-gas kinematics for all galaxies in the F3D sample were derived and the resulting maps are presented in this paper (Figs. A.1–A.31). Furthermore, for the ETGs the average stellar population properties from measurements of line-strength indices have been estimated.
The 31 sample galaxies were mapped in high resolution from the brightest central regions to the outskirts, where the surface brightness μB ≥ 25 mag arcsec−2, and out to 2–3 effective radii for the 21 ETGs and 1–2 effective radii for the 10 LTGs in the sample. The analysis shows that
-
while the Fornax cluster is dominated by ETGs inside the virial radius, the majority of the galaxies in this region are fast rotators, except for FCC 213 (NGC 1399), the brightest cluster member in the core and FCC 276, a bright spheroidal galaxy on the east side of the cluster in the low-density region (Table C.1 and Fig. 3);
-
42% of the cluster members inside the virial radius have ionised-gas emission, where five galaxies are ETGs (Table 1), with three of them at projected distances close to the cluster core;
-
the analysis of the average stellar population properties of the ETGs inside the virial radius of the cluster shows that the inner and brightest parts of the ETGs in the high-density region are more metal-rich than the galaxy outskirts. Galaxies in the low-density region are as old as those at smaller cluster-centric distance, but have lower [M/H] and, on average, show a smaller difference in the mean stellar population properties between the inner parts and the outskirts (Table 2 and Fig. 5).
The structure of the Fornax cluster has been traced by combining the two-dimensional distribution of the sample galaxies with the PPS information (Fig. 6) and with the structural properties of the galaxies (morphology, colours, kinematics, and stellar population, see Fig. 7). The cluster shows three well-defined groups of galaxies: the core, the north-south clump and the infalling galaxies, which are added to the southwest merging group centred on NGC 1316 (Drinkwater et al. 2001). Galaxies in each group have different properties in the light and colour distributions, in the kinematics, and in the stellar populations.
The clump galaxies are the redder and more metal-rich galaxies of the sample (Table 2). The phase-space diagram of numerically simulated clusters (Rhee et al. 2017) suggests that the clump galaxies entered the cluster potential more than 8 Gyr ago. All are fast-rotators, with many of them showing distinct nuclear components and kinematically decoupled cores, and two out of a total of three show ionised-gas emission in the centre. On average, galaxies populating this group show the larger differences between kinematic and photometric position angles (Fig. 4). The outskirts of the galaxies in this clump have lower metallicity than the bright central regions (Fig. 5), which is an indication that the mass assembly of metal-poor satellites continues in the outskirts.
The third group in the cluster contains the intermediate and recent infallers. These are the galaxies that, according to the phase-space diagram, entered onto the cluster potential less than 4 Gyr ago. They are distributed nearly symmetrically around the core, in the low-density region of the cluster (Rproj ≥ 0.3 Mpc). The majority are LTGs with ongoing star formation (Table 1). In this region, galaxies have on average lower [M/H] and [Mg/Fe] with respect to galaxies in the clump (Table 2 and Fig. 5). Taking into account the position of the three groups inside the cluster and the average observed properties for the galaxies, it is reasonable to conclude that they are tracing the assembly history of the cluster.
Future work on the F3D data will extend the analysis presented in this paper to map the stellar population distributions in each galaxy of the sample (Martín-Navarro et al., in prep.). In addition, ongoing works aim at performing the dynamical modelling to investigate the galaxy structure and to constrain the star-formation history. The F3D data represent a rich mine for the study of galaxy structure and to compare the observed properties with predictions from galaxy formation models in relation with environment.
In the context of the Gandalf fits, reddening does have an impact on the equivalent width of emission lines since nebular emission and the stellar continuum can suffer from different amount of extinction.
Acknowledgments
Based on observations collected at the European Organisation for Astronomical Research in the Southern Hemisphere under ESO programme 296.B-5054(A). The F3D team wish to thank the anonymous referee for a constructive report that led to an improvement of the paper. The F3D team is grateful to E. Dalla Bontà, T. Davis, K. Fahrion, L. Morelli, A. Poci, M. A. Raj, T. Spriggs, and L. Zhu for their contributions and discussions. E.I. and M.S. acknowledge financial support from the VST funds (P.I. P. Schipani). E.I. wishes to thank ESO in Garching and the Department of Physics and Astronomy in Padua for the hospitality and support during the several working visits related to the Fornax3D project. P.T.d.Z. is grateful to the Department of Physics and Astronomy in Padua for support of a working visit. F.P., J.F.B., and G.v.d.V. acknowledge support from grant AYA2016-77237-C3-1-P from the Spanish Ministry of Economy and Competitiveness (MINECO). FP acknowledges Fundación La Caixa for the financial support received in the form of a post-doc contract. E.M.C. acknowledge financial support from Padua University through grants DOR1715817/17, DOR1885254/18 and BIRD164402/16. R.McD. is the recipient of an Australian Research Council Future Fellowship (project number FT150100333). I.M.N. acknowledges support by the Deutsche Forschungsgemeinschaft under the grant MI 2009/1-1. G.v.d.V. acknowledges funding from the European Research Council (ERC) under the European Union’s Horizon 2020 research and innovation programme under grant agreement No 724857 (Consolidator Grant ArcheoDyn).
References
- Bacon, R., Accardo, M., Adjali, L., et al. 2010, in Ground-based and Airborne Instrumentation for Astronomy III, Proc. SPIE, 7735, 773508 [CrossRef] [Google Scholar]
- Bacon, R., Conseil, S., Mary, D., et al. 2017, A&A, 608, A1 [NASA ADS] [CrossRef] [EDP Sciences] [Google Scholar]
- Baldwin, J. A., Phillips, M. M., & Terlevich, R. 1981, PASP, 93, 5 [NASA ADS] [CrossRef] [EDP Sciences] [Google Scholar]
- Barbosa, C. E., Arnaboldi, M., Coccato, L., et al. 2018, A&A, 609, A78 [NASA ADS] [CrossRef] [EDP Sciences] [Google Scholar]
- Barone, T. M., D’Eugenio, F., Colless, M., et al. 2018, ApJ, 856, 64 [NASA ADS] [CrossRef] [Google Scholar]
- Bedregal, A. G., Aragón-Salamanca, A., Merrifield, M. R., & Milvang-Jensen, B. 2006, MNRAS, 371, 1912 [NASA ADS] [CrossRef] [Google Scholar]
- Bedregal, A. G., Cardiel, N., Aragón-Salamanca, A., & Merrifield, M. R. 2011, MNRAS, 415, 2063 [NASA ADS] [CrossRef] [Google Scholar]
- Bittner, A., Falcón-Barroso, J., Nedelchev, B., et al. 2019, A&A, accepted, https://doi.org/10.1051/0004-6361/201935829 [Google Scholar]
- Blakeslee, J. P., Jordán, A., Mei, S., et al. 2009, ApJ, 694, 556 [NASA ADS] [CrossRef] [Google Scholar]
- Boselli, A., Boissier, S., Cortese, L., et al. 2006, ApJ, 651, 811 [NASA ADS] [CrossRef] [Google Scholar]
- Bundy, K., Bershady, M. A., Law, D. R., et al. 2015, ApJ, 798, 7 [NASA ADS] [CrossRef] [Google Scholar]
- Calzetti, D., Liu, G., & Koda, J. 2012, ApJ, 752, 98 [NASA ADS] [CrossRef] [Google Scholar]
- Cantiello, M., D’Abrusco, R., Spavone, M., et al. 2018, A&A, 611, A93 [NASA ADS] [CrossRef] [EDP Sciences] [Google Scholar]
- Capaccioli, M., Spavone, M., Grado, A., et al. 2015, A&A, 581, A10 [NASA ADS] [CrossRef] [EDP Sciences] [Google Scholar]
- Cappellari, M. 2013, ApJ, 778, L2 [NASA ADS] [CrossRef] [Google Scholar]
- Cappellari, M. 2016, ARA&A, 54, 597 [NASA ADS] [CrossRef] [Google Scholar]
- Cappellari, M. 2017, MNRAS, 466, 798 [NASA ADS] [CrossRef] [Google Scholar]
- Cappellari, M., & Copin, Y. 2003, MNRAS, 342, 345 [NASA ADS] [CrossRef] [Google Scholar]
- Cappellari, M., & Emsellem, E. 2004, PASP, 116, 138 [NASA ADS] [CrossRef] [Google Scholar]
- Cappellari, M., Emsellem, E., Krajnović, D., et al. 2011a, MNRAS, 413, 813 [NASA ADS] [CrossRef] [Google Scholar]
- Cappellari, M., Emsellem, E., Krajnović, D., et al. 2011b, MNRAS, 416, 1680 [NASA ADS] [CrossRef] [Google Scholar]
- Cappellari, M., McDermid, R. M., Alatalo, K., et al. 2013, MNRAS, 432, 1862 [NASA ADS] [CrossRef] [Google Scholar]
- Carollo, C. M., Franx, M., Illingworth, G. D., & Forbes, D. A. 1997, ApJ, 481, 710 [NASA ADS] [CrossRef] [Google Scholar]
- Chung, A., van Gorkom, J. H., Kenney, J. D. P., Crowl, H., & Vollmer, B. 2009, AJ, 138, 1741 [NASA ADS] [CrossRef] [Google Scholar]
- Coccato, L., Gerhard, O., & Arnaboldi, M. 2010, MNRAS, 407, L26 [NASA ADS] [Google Scholar]
- Coccato, L., Gerhard, O., Arnaboldi, M., & Ventimiglia, G. 2011, A&A, 533, A138 [NASA ADS] [CrossRef] [EDP Sciences] [Google Scholar]
- Coccato, L., Arnaboldi, M., & Gerhard, O. 2013, MNRAS, 436, 1322 [NASA ADS] [CrossRef] [Google Scholar]
- Cook, B. A., Conroy, C., Pillepich, A., Rodriguez-Gomez, V., & Hernquist, L. 2016, ApJ, 833, 158 [NASA ADS] [CrossRef] [Google Scholar]
- Croom, S. M., Lawrence, J. S., Bland-Hawthorn, J., et al. 2012, MNRAS, 421, 872 [NASA ADS] [Google Scholar]
- Cybulski, R., Yun, M. S., Fazio, G. G., & Gutermuth, R. A. 2014, MNRAS, 439, 3564 [Google Scholar]
- D’Abrusco, R., Cantiello, M., Paolillo, M., et al. 2016, ApJ, 819, L31 [NASA ADS] [CrossRef] [Google Scholar]
- Davies, J. I., Bianchi, S., Baes, M., et al. 2013, MNRAS, 428, 834 [NASA ADS] [CrossRef] [Google Scholar]
- Davies, L. J. M., Robotham, A. S. G., Driver, S. P., et al. 2016, MNRAS, 455, 4013 [NASA ADS] [CrossRef] [Google Scholar]
- De Lucia, G., Weinmann, S., Poggianti, B. M., Aragón-Salamanca, A., & Zaritsky, D. 2012, MNRAS, 423, 1277 [NASA ADS] [CrossRef] [Google Scholar]
- de Zeeuw, P. T., Bureau, M., Emsellem, E., et al. 2002, MNRAS, 329, 513 [NASA ADS] [CrossRef] [Google Scholar]
- Dekel, A., & Birnboim, Y. 2006, MNRAS, 368, 2 [NASA ADS] [CrossRef] [Google Scholar]
- Dressler, A., Oemler, Jr., A., Couch, W. J., et al. 1997, ApJ, 490, 577 [NASA ADS] [CrossRef] [Google Scholar]
- Drinkwater, M. J., Gregg, M. D., & Colless, M. 2001, ApJ, 548, L139 [NASA ADS] [CrossRef] [Google Scholar]
- Duc, P.-A., Cuillandre, J.-C., Karabal, E., et al. 2015, MNRAS, 446, 120 [NASA ADS] [CrossRef] [Google Scholar]
- Dunn, L. P., & Jerjen, H. 2006, AJ, 132, 1384 [NASA ADS] [CrossRef] [Google Scholar]
- Eigenthaler, P., Puzia, T. H., Taylor, M. A., et al. 2018, ApJ, 855, 142 [NASA ADS] [CrossRef] [Google Scholar]
- Emsellem, E., Cappellari, M., Krajnović, D., et al. 2011, MNRAS, 414, 888 [NASA ADS] [CrossRef] [Google Scholar]
- Falcón-Barroso, J., Bacon, R., Bureau, M., et al. 2006, MNRAS, 369, 529 [NASA ADS] [CrossRef] [Google Scholar]
- Falcón-Barroso, J., Sánchez-Blázquez, P., Vazdekis, A., et al. 2011, A&A, 532, A95 [NASA ADS] [CrossRef] [EDP Sciences] [Google Scholar]
- Fasano, G., Poggianti, B. M., Bettoni, D., et al. 2015, MNRAS, 449, 3927 [NASA ADS] [CrossRef] [Google Scholar]
- Ferguson, H. C. 1989, Ap&SS, 157, 227 [NASA ADS] [CrossRef] [Google Scholar]
- Ferreras, I., Scott, N., La Barbera, F., et al. 2019, MNRAS, submitted [arXiv:1905.03257] [Google Scholar]
- Frank, K. A., Peterson, J. R., Andersson, K., Fabian, A. C., & Sanders, J. S. 2013, ApJ, 764, 46 [NASA ADS] [CrossRef] [Google Scholar]
- Freudling, W., Romaniello, M., Bramich, D. M., et al. 2013, A&A, 559, A96 [NASA ADS] [CrossRef] [EDP Sciences] [Google Scholar]
- Gadotti, D. A., & de Souza, R. E. 2005, ApJ, 629, 797 [NASA ADS] [CrossRef] [Google Scholar]
- Gerhard, O. E. 1993, MNRAS, 265, 213 [NASA ADS] [CrossRef] [Google Scholar]
- Graham, M. T., Cappellari, M., Li, H., et al. 2018, MNRAS, 477, 4711 [NASA ADS] [CrossRef] [Google Scholar]
- Greene, J. E., Janish, R., Ma, C.-P., et al. 2015, ApJ, 807, 11 [NASA ADS] [CrossRef] [Google Scholar]
- Greene, J. E., Veale, M., Ma, C.-P., et al. 2019, ApJ, 874, 66 [NASA ADS] [CrossRef] [Google Scholar]
- Hartke, J., Arnaboldi, M., Gerhard, O., et al. 2018, A&A, 616, A123 [NASA ADS] [CrossRef] [EDP Sciences] [Google Scholar]
- Hernández-Fernández, J. D., Haines, C. P., Diaferio, A., et al. 2014, MNRAS, 438, 2186 [NASA ADS] [CrossRef] [Google Scholar]
- Hilker, M. 2015, IAU Gen. Assembly, 22, 2215712 [NASA ADS] [Google Scholar]
- Hirschmann, M., Naab, T., Ostriker, J. P., et al. 2015, MNRAS, 449, 528 [NASA ADS] [CrossRef] [Google Scholar]
- Houghton, R. C. W., Davies, R. L., D’Eugenio, F., et al. 2013, MNRAS, 436, 19 [NASA ADS] [CrossRef] [Google Scholar]
- Huang, S., Leauthaud, A., Greene, J., et al. 2018, MNRAS, 480, 521 [NASA ADS] [CrossRef] [Google Scholar]
- Hwang, J.-S., Park, C., Banerjee, A., & Hwang, H. S. 2018, ApJ, 856, 160 [NASA ADS] [CrossRef] [Google Scholar]
- Iodice, E., Capaccioli, M., Grado, A., et al. 2016, ApJ, 820, 42 [NASA ADS] [CrossRef] [Google Scholar]
- Iodice, E., Spavone, M., Cantiello, M., et al. 2017, ApJ, 851, 75 [Google Scholar]
- Iodice, E., Spavone, M., Capaccioli, M., et al. 2019, A&A, 623, A1 [NASA ADS] [CrossRef] [EDP Sciences] [Google Scholar]
- Jaffé, Y. L., Smith, R., Candlish, G. N., et al. 2015, MNRAS, 448, 1715 [NASA ADS] [CrossRef] [Google Scholar]
- Jaffé, Y. L., Poggianti, B. M., Moretti, A., et al. 2018, MNRAS, 476, 4753 [NASA ADS] [CrossRef] [Google Scholar]
- Jordán, A., Blakeslee, J. P., Côté, P., et al. 2007, ApJS, 169, 213 [NASA ADS] [CrossRef] [Google Scholar]
- Kormendy, J., Fisher, D. B., Cornell, M. E., & Bender, R. 2009, ApJS, 182, 216 [NASA ADS] [CrossRef] [Google Scholar]
- Krajnović, D., Cappellari, M., de Zeeuw, P. T., & Copin, Y. 2006, MNRAS, 366, 787 [NASA ADS] [CrossRef] [Google Scholar]
- Krajnović, D., Emsellem, E., Cappellari, M., et al. 2011, MNRAS, 414, 2923 [NASA ADS] [CrossRef] [Google Scholar]
- Kuntschner, H., Emsellem, E., Bacon, R., et al. 2006, MNRAS, 369, 497 [NASA ADS] [CrossRef] [Google Scholar]
- Laurikainen, E., Salo, H., Buta, R., et al. 2006, AJ, 132, 2634 [NASA ADS] [CrossRef] [Google Scholar]
- Lena, D., Robinson, A., Storchi-Bergman, T., et al. 2015, ApJ, 806, 84 [Google Scholar]
- Longobardi, A., Arnaboldi, M., Gerhard, O., et al. 2013, A&A, 558, A42 [NASA ADS] [CrossRef] [EDP Sciences] [Google Scholar]
- Ma, C.-P., Greene, J. E., McConnell, N., et al. 2014, ApJ, 795, 158 [NASA ADS] [CrossRef] [Google Scholar]
- Mahajan, S., Mamon, G. A., & Raychaudhury, S. 2011, MNRAS, 416, 2882 [NASA ADS] [CrossRef] [Google Scholar]
- Martin, C., & GALEX Team 2005, in Maps of the Cosmos, eds. M. Colless, L. Staveley-Smith, & R. A. Stathakis, IAU Symp., 216, 221 [NASA ADS] [Google Scholar]
- Martín-Navarro, I., Vazdekis, A., Falcón-Barroso, J., et al. 2018, MNRAS, 475, 3700 [NASA ADS] [CrossRef] [Google Scholar]
- Martín-Navarro, I., Lyubenova, M., van de Ven, G., et al. 2019, A&A, 626, A124 [NASA ADS] [CrossRef] [EDP Sciences] [Google Scholar]
- Mastropietro, C., Moore, B., Mayer, L., et al. 2005, MNRAS, 364, 607 [Google Scholar]
- McDermid, R. M., Alatalo, K., Blitz, L., et al. 2015, MNRAS, 448, 3484 [NASA ADS] [CrossRef] [Google Scholar]
- McGee, S. L., Balogh, M. L., Bower, R. G., Font, A. S., & McCarthy, I. G. 2009, MNRAS, 400, 937 [NASA ADS] [CrossRef] [Google Scholar]
- McNeil-Moylan, E. K., Freeman, K. C., Arnaboldi, M., & Gerhard, O. E. 2012, A&A, 539, A11 [NASA ADS] [CrossRef] [EDP Sciences] [Google Scholar]
- Merluzzi, P., Busarello, G., Dopita, M. A., et al. 2016, MNRAS, 460, 3345 [Google Scholar]
- Mihos, J. C., Harding, P., Feldmeier, J. J., et al. 2017, ApJ, 834, 16 [NASA ADS] [CrossRef] [Google Scholar]
- Monachesi, A., Gómez, F. A., Grand, R. J. J., et al. 2019, MNRAS, 485, 2589 [NASA ADS] [CrossRef] [Google Scholar]
- Moore, B., Lake, G., & Katz, N. 1998, ApJ, 495, 139 [NASA ADS] [CrossRef] [Google Scholar]
- Munoz, R. P., Eigenthaler, P., Puzia, T. H., et al. 2015, ApJ, 813, L15 [NASA ADS] [CrossRef] [Google Scholar]
- Muzzin, A., van der Burg, R. F. J., McGee, S. L., et al. 2014, ApJ, 796, 65 [NASA ADS] [CrossRef] [Google Scholar]
- Napolitano, N. R., Pannella, M., Arnaboldi, M., et al. 2003, ApJ, 594, 172 [NASA ADS] [CrossRef] [Google Scholar]
- Nasonova, O. G., de Freitas Pacheco, J. A., & Karachentsev, I. D. 2011, A&A, 532, A104 [NASA ADS] [CrossRef] [EDP Sciences] [Google Scholar]
- Navarro, J. F., Frenk, C. S., & White, S. D. M. 1997, ApJ, 490, 493 [NASA ADS] [CrossRef] [Google Scholar]
- Owers, M. S., Hudson, M. J., Oman, K. A., et al. 2019, ApJ, 873, 52 [NASA ADS] [CrossRef] [Google Scholar]
- Paolillo, M., Fabbiano, G., Peres, G., & Kim, D.-W. 2002, ApJ, 565, 883 [NASA ADS] [CrossRef] [Google Scholar]
- Peng, C. Y., Ho, L. C., Impey, C. D., & Rix, H.-W. 2010, AJ, 139, 2097 [NASA ADS] [CrossRef] [Google Scholar]
- Peng, Y., Maiolino, R., & Cochrane, R. 2015, Nature, 521, 192 [NASA ADS] [CrossRef] [Google Scholar]
- Pillepich, A., Nelson, D., Hernquist, L., et al. 2018, MNRAS, 475, 648 [NASA ADS] [CrossRef] [Google Scholar]
- Pinna, F., Falcón-Barroso, J., Martig, M., et al. 2019a, A&A, 625, A95 [NASA ADS] [CrossRef] [EDP Sciences] [Google Scholar]
- Pinna, F., Falcón-Barroso, J., Martig, M., et al. 2019b, A&A, 623, A19 [NASA ADS] [CrossRef] [EDP Sciences] [Google Scholar]
- Poggianti, B. M., Moretti, A., Gullieuszik, M., et al. 2017, ApJ, 844, 48 [NASA ADS] [CrossRef] [Google Scholar]
- Pota, V., Napolitano, N. R., Hilker, M., et al. 2018, MNRAS, 481, 1744 [NASA ADS] [CrossRef] [Google Scholar]
- Raj, A., Iodice, E., Napolitano, N., et al. 2019, A&A, in press, https://doi.org/10.1051/0004-6361/201935433 [Google Scholar]
- Rhee, J., Smith, R., Choi, H., et al. 2017, ApJ, 843, 128 [NASA ADS] [CrossRef] [Google Scholar]
- Sánchez, S. F., Kennicutt, R. C., Gil de Paz, A., et al. 2012, A&A, 538, A8 [NASA ADS] [CrossRef] [EDP Sciences] [Google Scholar]
- Sarzi, M., Falcón-Barroso, J., Davies, R. L., et al. 2006, MNRAS, 366, 1151 [NASA ADS] [CrossRef] [Google Scholar]
- Sarzi, M., Iodice, E., Coccato, L., et al. 2018, A&A, 616, A121 [NASA ADS] [CrossRef] [EDP Sciences] [Google Scholar]
- Scharf, C. A., Zurek, D. R., & Bureau, M. 2005, ApJ, 633, 154 [NASA ADS] [CrossRef] [Google Scholar]
- Schröder, A., Drinkwater, M. J., & Richter, O.-G. 2001, A&A, 376, 98 [NASA ADS] [CrossRef] [EDP Sciences] [Google Scholar]
- Schuberth, Y., Richtler, T., Hilker, M., et al. 2010, A&A, 513, A52 [NASA ADS] [CrossRef] [EDP Sciences] [Google Scholar]
- Schulz, C., Hilker, M., Kroupa, P., & Pflamm-Altenburg, J. 2016, A&A, 594, A119 [NASA ADS] [CrossRef] [EDP Sciences] [Google Scholar]
- Schulze, F., Remus, R.-S., Dolag, K., et al. 2018, MNRAS, 480, 4636 [NASA ADS] [CrossRef] [Google Scholar]
- Scott, N., Davies, R. L., Houghton, R. C. W., et al. 2014, MNRAS, 441, 274 [NASA ADS] [CrossRef] [Google Scholar]
- Serra, P., de Blok, W. J. G., Bryan, G. L., et al. 2016, in MeerKAT Science: On the Pathway to the SKA, Proc. Sci., 8 [Google Scholar]
- Sheardown, A., Roediger, E., Su, Y., et al. 2018, ApJ, 865, 118 [NASA ADS] [CrossRef] [Google Scholar]
- Smith, R., Sánchez-Janssen, R., Beasley, M. A., et al. 2015, MNRAS, 454, 2502 [NASA ADS] [CrossRef] [Google Scholar]
- Spavone, M., Capaccioli, M., Napolitano, N. R., et al. 2017, A&A, 603, A38 [NASA ADS] [CrossRef] [EDP Sciences] [Google Scholar]
- Spiniello, C., Napolitano, N. R., Arnaboldi, M., et al. 2018, MNRAS, 477, 1880 [NASA ADS] [CrossRef] [Google Scholar]
- Su, Y., Nulsen, P. E. J., Kraft, R. P., et al. 2017, ApJ, 851, 69 [NASA ADS] [CrossRef] [Google Scholar]
- Tremaine, S. 1981, in Structure and Evolution of Normal Galaxies, eds. S. M. Fall, & D. Lynden-Bell, 67 [Google Scholar]
- Trujillo, I., & Fliri, J. 2016, ApJ, 823, 123 [NASA ADS] [CrossRef] [Google Scholar]
- van der Marel, R. P., & Franx, M. 1993, ApJ, 407, 525 [NASA ADS] [CrossRef] [Google Scholar]
- van der Wel, A., Bell, E. F., Holden, B. P., Skibba, R. A., & Rix, H.-W. 2010, ApJ, 714, 1779 [NASA ADS] [CrossRef] [Google Scholar]
- van Dokkum, P. G., & Conroy, C. 2010, Nature, 468, 940 [NASA ADS] [CrossRef] [Google Scholar]
- Vazdekis, A., Sánchez-Blázquez, P., Falcón-Barroso, J., et al. 2010, MNRAS, 404, 1639 [NASA ADS] [Google Scholar]
- Vazdekis, A., Ricciardelli, E., Cenarro, A. J., et al. 2012, MNRAS, 424, 157 [NASA ADS] [CrossRef] [Google Scholar]
- Vazdekis, A., Coelho, P., Cassisi, S., et al. 2015, MNRAS, 449, 1177 [NASA ADS] [CrossRef] [Google Scholar]
- Veale, M., Ma, C.-P., Greene, J. E., et al. 2018, MNRAS, 473, 5446 [NASA ADS] [CrossRef] [Google Scholar]
- Venhola, A., Peletier, R., Laurikainen, E., et al. 2017, A&A, 608, A142 [NASA ADS] [CrossRef] [EDP Sciences] [Google Scholar]
- Venhola, A., Peletier, R., Laurikainen, E., et al. 2018, A&A, 620, A165 [NASA ADS] [CrossRef] [EDP Sciences] [Google Scholar]
- Viaene, S., Sarzi, M., Zabel, N., et al. 2019, A&A, 622, A89 [NASA ADS] [CrossRef] [EDP Sciences] [Google Scholar]
- Vijayaraghavan, R., & Ricker, P. M. 2013, MNRAS, 435, 2713 [NASA ADS] [CrossRef] [Google Scholar]
- Wegner, G. A., Corsini, E. M., Thomas, J., et al. 2012, AJ, 144, 78 [NASA ADS] [CrossRef] [Google Scholar]
- Weilbacher, P. M., Streicher, O., & Palsa, R. 2016, Astrophysics Source Code Library [record ascl:1610.004] [Google Scholar]
- Weilbacher, P. M., Streicher, O., Urrutia, T., et al. 2012, in Software and Cyberinfrastructure for Astronomy II, Proc. SPIE, 8451, 84510B [CrossRef] [Google Scholar]
- Yoon, H., Chung, A., Smith, R., & Jaffé, Y. L. 2017, ApJ, 838, 81 [NASA ADS] [CrossRef] [Google Scholar]
- Zabel, N., Davis, T. A., Smith, M. W. L., et al. 2019, MNRAS, 483, 2251 [NASA ADS] [CrossRef] [Google Scholar]
Appendix A: Maps for the stellar kinematics, line-strength indices, and ionised-gas properties for the F3D galaxies
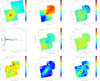 |
Fig. A.1. Stellar analysis for FCC 83. First row panels: MUSE reconstructed image (left). The dotted ellipses correspond to the isophotes at 0.5 Re, Rtr, and μB = 25 mag arcsec−2, respectively. Maps of the mean velocity (middle) and velocity dispersion (right) of the stellar LOSVD. Second row panels: radial profiles of the kinematic (black circles) and photometric (green circles) position angle (left). The vertical dashed lines mark the radial range where the average position angles are computed. Maps of the third (middle) and fourth Gauss-Hermite coefficient (right) of the stellar LOSVD. Third row panels: maps of the Hβ (left), Mgb (middle), and Fe5015 line-strength index (right). |
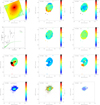 |
Fig. A.2. Stellar and ionised-gas analysis for FCC 90. First row panels: MUSE reconstructed image (left). The dotted ellipses correspond to the isophotes at 0.5 Re, Rtr, and μB = 25 mag arcsec−2, respectively. Maps of the mean velocity (middle) and velocity dispersion (right) of the stellar LOSVD. Second row panels: radial profiles of the kinematic (black circles) and photometric (green circles) position angle (left). The vertical dashed lines mark the radial range where the average position angles are computed. Maps of the third (middle) and fourth Gauss-Hermite coefficient (right) of the stellar LOSVD. Third row panels: maps of the Hβ (left), Mgb (middle), and Fe5015 line-strength index (right). Fourth row panels: map of the Hα flux (left). Data are shown in logarithmic scale and in units of 10−20 erg cm−2 s−1 where the S/N of the line is sufficiently elevated to exclude a false positive detection. Map of the Hα velocity (middle) with respect to the systemic velocity, as derived from the median gas-velocity value in the central regions of the galaxy. Map of the ionised-gas classification (right) into H II regions (blue), highly-ionised or AGN regions (yellow), LINER-like emission regions (red), and regions where the nebular emission is powered by some combination of massive-star radiation and other ionisation sources (green). |
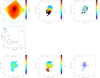 |
Fig. A.3. Stellar and ionised-gas analysis for FCC 113. First row panels: MUSE reconstructed image (left). The dotted ellipse corresponds to the isophote at μB = 25 mag arcsec−2. Maps of the mean velocity (middle) and velocity dispersion (right) of the stellar LOSVD. Second row panel: radial profiles of the kinematic (black circles) and photometric (green circles) position angle. Third row panels: map of the Hα flux (left). Data are shown in logarithmic scale and in units of 10−20 erg cm−2 s−1 where the S/N of the line is sufficiently elevated to exclude a false positive detection. Map of the Hα velocity (middle) with respect to the systemic velocity, as derived from the median gas-velocity value in the central regions of the galaxy. Map of the ionised-gas classification (right) into H II regions (light-blue), highly-ionised or AGN regions (yellow), LINER-like emission regions (red), and regions where the nebular emission is powered by some combination of massive-star radiation and other ionisation sources (green). |
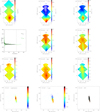 |
Fig. A.10. Same as in Fig. A.2, but for FCC 167. |
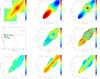 |
Fig. A.11. Same as in Fig. A.1, but for FCC 170. |
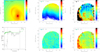 |
Fig. A.12. Stellar analysis for FCC 176. First row panels: MUSE reconstructed image (left). The dotted ellipse correspond to the isophotes at μB = 25 mag arcsec−2. Maps of the mean velocity (middle) and velocity dispersion (right) of the stellar LOSVD. Second row panels: radial profiles of the kinematic (black circles) and photometric (green circles) position angle (left). The vertical dashed lines mark the radial range where the average position angles are computed. Maps of the third (middle) and fourth Gauss-Hermite coefficient (right) of the stellar LOSVD. |
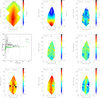 |
Fig. A.13. Same as in Fig. A.1, but for FCC 177. |
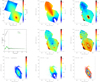 |
Fig. A.14. Stellar and ionised-gas analysis for FCC 179. First row panels: MUSE reconstructed image (left). The dotted ellipse corresponds to the isophote at μB = 25 mag arcsec−2. Maps of the mean velocity (middle) and velocity dispersion (right) of the stellar LOSVD. Second row panels: radial profiles of the kinematic (black circles) and photometric (green circles) position angle (left). The vertical dashed lines mark the radial range where the average position angles are computed. Maps of the third (middle) and fourth Gauss-Hermite coefficient (right) of the stellar LOSVD. Third row panels: map of the ionised-gas classification (right) into H II regions (blue), highly-ionised or AGN regions (yellow), LINER-like emission regions (red), and regions where the nebular emission is powered by some combination of massive-star radiation and other ionisation sources (green). |
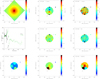 |
Fig. A.15. Same as in Fig. A.1, but for FCC 182. |
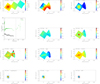 |
Fig. A.16. Same as in Fig. A.2, but for FCC 184. |
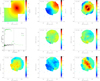 |
Fig. A.17. Same as in Fig. A.1, but for FCC 190. |
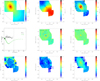 |
Fig. A.18. Same as in Fig. A.1, but for FCC 193. |
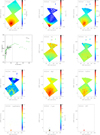 |
Fig. A.19. Same as in Fig. A.2, but for FCC 219. |
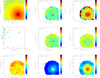 |
Fig. A.20. Same as in Fig. A.1, but for FCC 249. |
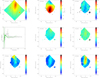 |
Fig. A.21. Same as in Fig. A.1, but for FCC 255. |
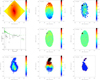 |
Fig. A.22. Same as in Fig. A.14, but for FCC 263. |
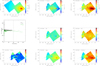 |
Fig. A.23. Same as in Fig. A.1, but for FCC 276. |
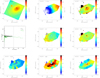 |
Fig. A.24. Same as in Fig. A.1, but for FCC 277. |
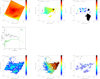 |
Fig. A.25. Same as in Fig. A.3, but for FCC 285. |
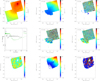 |
Fig. A.26. Same as in Fig. A.14, but for FCC 290. |
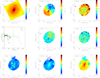 |
Fig. A.27. Same as in Fig. A.1, but for FCC 301. |
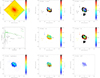 |
Fig. A.28. Same as in Fig. A.14, but for FCC 306. |
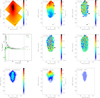 |
Fig. A.29. Same as in Fig. A.14, but for FCC 308. |
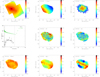 |
Fig. A.30. Same as in Fig. A.1, but for FCC 310. |
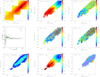 |
Fig. A.31. Same as in Fig. A.14, but for FCC 312. |
Appendix B: Results on individual galaxies
This section provides a brief description of the main properties of each F3D galaxy based on the kinematic and line-strength maps shown in Appendix A. The classification of the galaxies into ancient, intermediate, and recent infallers is based on Fig. 6 and their location in the cluster is shown in Fig. 7.
B.1. FCC 83 (NGC 1351) – Fig. A.1
FCC 83 is located on the western side of the cluster at a distance Rproj = 1.7° from the cluster centre. It is among the brightest and more massive ETGs in the low-density region of the cluster and is an intermediate infaller. It shows a regular stellar velocity map with a maximum rotation velocity of ∼100 km s−1. The stellar velocity dispersion peaks in the centre (σ ∼ 150 km s−1) and decreases outwards (σ ∼ 60 km s−1 at R ∼ 50 arcsec). Except for the central regions (R ≤ 5 arcsec), PAkin is consistent with PAphot. The Mgb and Fe5015 line-strength indices follow the light distribution showing a central peak, while the Hβ index is quite constant at all radii (∼2 Å) although it shows a small central decrease of ∼0.2 Å.
B.2. FCC 90 – Fig. A.2
FCC 90 is a small and faint peculiar elliptical galaxy (Ferguson 1989) on the south-western side of the cluster at a distance Rproj = 1.7° from the centre. It is a recent infaller in the low-density region of the cluster. It is the only non-rotating galaxy of the F3D sample, so that PAkin is not well-determined. The stellar velocity dispersion shows a clear decrease of ∼30 km s−1 towards the galaxy centre (R ≲ 10 arcsec). The values of the line-strength indices in the central parts are also different from those measured in the outskirts: Hβ is larger (by ∼2 Å) while Mgb and Fe5015 are smaller (by ∼1 Å). The ionised-gas emission is concentrated in the inner 10″ and is entirely powered by star formation, consistent with the very blue optical colours found in FDS (g − r ∼ 0.4 mag). The ionised-gas shows modest rotation in harmony with the molecular-gas (Zabel et al. 2019). Finally, a plume of gaseous material to the west shows distinct kinematics, suggesting a past galaxy-galaxy interaction.
B.3. FCC 113 (ESO 358-G015) – Fig. A.3
FCC 113 is a late-type spiral on the north-western side of the cluster at a distance of Rproj = 1.3° from FCC 213 (NGC 1399). It is one of the intermediate infallers residing in the low-density region. It was classified as a star-forming dwarf galaxy by Drinkwater et al. (2001). Its morphology resembles that of a lopsided spiral as confirmed by the smooth stellar velocity map. The maximum rotation velocity is vmax ∼ 50 km s−1 at R ∼ 20 arcsec, while the stellar velocity dispersion is low (σ ∼ 15 km s−1) and constant at all radii. This galaxy shows extended ionised-gas emission powered by massive stars consistent with the previous findings from Drinkwater et al. (2001), with several localised regions where star-formation is more intense. For one HII-region the measured ionisation level moves it outside the adopted BPT boundaries for star-formation, although there are no indications of other ionisation mechanisms. The ionised-gas kinematics shows coherent, if not perfectly regular rotation in the same direction as the stars.
B.4. FCC 119 – Fig. A.4
FCC 119 is one the faintest ETG of the F3D sample. It is an intermediate infaller located in the low-density region on the northern side of the cluster at a distance of Rproj = 2.1° from the centre. The stellar kinematics is characterised by low rotation velocity (vmax ∼ 20 km s−1 at R ∼ 15 arcsec) and velocity dispersion (σ ∼ 20 km s−1) which is constant at all radii. The light distribution from the reconstructed image shows irregular isophotes in the central region (R ≲ 10 arcsec). The Hβ line-strength index measured in the central parts of the galaxy is ∼1 Å larger while the Mgb and Fe5015 indices are both ∼1 Å smaller compared to the outskirts. Ionised-gas emission is detected only in the galaxy centre, where it appears to rotate in the same direction as the stars and is, probably, mainly powered by ongoing star formation.
B.5. FCC 143 (NGC 1373) – Fig. A.5
FCC 143 is one of the most compact and faint elliptical galaxies of the F3D sample. It is located on the western side of the cluster at Rproj = 0.8° from the centre and it is close in projection to FCC 147 (NGC 1374). According to Blakeslee et al. (2009), the difference in distance between FCC 143 and FCC 147 is only ∼0.3 Mpc. Deep FDS images show a possible ongoing interaction between the two galaxies (Iodice et al. 2019). FCC 143 is an ancient infaller in the north-south clump of galaxies. The stellar kinematics reveals a central distinct component, which extends along the photometric major axis out to R ∼ 20 arcsec with a maximum rotation velocity vmax ∼ 40 km s−1. Its stellar velocity dispersion is larger (σ ∼ 80 km s−1) than that in the surrounding regions (σ ∼ 50 km s−1). This feature is characterised by larger values of the Mgb and Fe5015 line-strength indices than in the outskirts, while the Hβ index is almost constant at all radii. The colour of this distinct component is redder (g − i ∼ 1.2 mag) than the outskirts (g − i ∼ 0.7 mag) in the FDS measurements.
B.6. FCC 147 (NGC 1374) – Fig. A.6
FCC 147 is one of the brightest elliptical galaxies of the sample. It is located on the western side of the cluster at Rproj = 0.7° from FCC 213 (NGC 1399). It is an ancient infaller belonging to the north-south galaxy clump. Its stellar kinematics is characterised by a small maximum rotation (vmax ∼ 50 km s−1) and a high central velocity dispersion (σ ∼ 200 km s−1). The gradient measured in line-strength maps of the Mgb and Fe5015 follows the gradient of velocity dispersion. The Hβ index in the central parts is ∼1 Å smaller than in the surrounding regions.
B.7. FCC 148 (NGC 1375) – Fig. A.7
FCC 148 is a lenticular galaxy with a prominent boxy bulge located on the western side of the cluster at Rproj = 0.7° from the centre. It is close in projection to FCC 147 (NGC 1374), but there are no signs of interaction between the two objects. This is consistent with FCC 148 being a recent infaller. The stellar velocity map resembles that of a typical disc with a maximum value of vmax ∼ 100 km s−1 at R ∼ 50 arcsec. The stellar velocity dispersion is peaked in the centre (σ ∼ 80 km s−1) with a steep decrease outwards (σ ∼ 20 km s−1 at R ∼ 30 arcsec). At larger radii, it increases by ∼20 km s−1. The maps of Mgb and Fe5015 also show different properties inside and outside R ∼ 30 arcsec. They have larger values (by ∼2 Å) in the central parts than in the outskirts. Hβ is nearly constant at all radii (∼2 Å).
B.8. FCC 153 (IC 1963) – Fig. A.8
FCC 153 is an edge-on lenticular galaxy located in the low-density region on the northern side of the cluster at a distance of Rproj = 1.2° from the centre. It is one of the intermediate infallers in the north of the clump of galaxies. The analysis of the kinematics and properties of the stellar component of this object based on F3D data is presented and discussed in detail by P19a.
B.9. FCC 161 (NGC 1379) – Fig. A.9
FCC 161 is one the brightest elliptical galaxies in the high-density region of the cluster. It is located at Rproj = 0.5° from FCC 213 (NGC 1399) on the western side of the cluster. It is one of the ancient infallers in the north-south clump of galaxies. Similarly to FCC 147, which is the other giant elliptical galaxy of this cluster region, also the stellar component of FCC 161 is characterised by a small maximum rotation (vmax ∼ 30 km s−1) and a high velocity dispersion in the centre (σ ∼ 150 km s−1). As for FCC 147, the line-strength maps of Mgb and Fe5015 are characterised by an increasing gradient toward the centre, which is consistent with the gradient measured in the stellar velocity dispersion. The Hβ index in the central parts is ∼1 Å smaller compared to the outskirts. The kinematics along the major axis is covered only by the central MUSE pointing, since the halo pointing was obtained at 90° west of it. The main reason for this is to constrain the stellar populations in this particular region of the outskirts that shows a strong signature of an ongoing accretion from outside (Iodice et al. 2019).
B.10. FCC 167 (NGC 1380) – Fig. A.10
FCC 167 is the brightest lenticular galaxy inside the virial radius of the Fornax cluster at Rproj = 0.6° from the centre. It is an ancient infaller in the north-south clump of galaxies on the western side of the cluster. This galaxy shows an extended rotationally-supported stellar disc with a large rotation velocity (vmax ∼ 300 km s−1) and a high velocity dispersion in the centre (σ ∼ 200 km s−1), where there is also faint Hα emission indicative of traces of star formation. Sarzi et al. (2018) chose FCC 167 as an illustrative example to describe the details of the F3D data reduction and analysis. Viaene et al. (2019) studied the dust and ionised-gas properties in the centre of FCC 167, and Martín-Navarro et al. (2019) provided a detailed investigation of its stellar population properties and initial mass function.
B.11. FCC 170 (NGC 1381) – Fig. A.11
FCC 170 is an edge-on lenticular galaxy in the high-density region of the cluster at Rproj = 0.4° west of FCC 213 (NGC 1399). It belongs to the north-south clump of galaxies and is an ancient infaller. It is characterised by a boxy bulge and a thin disc, which becomes thicker at larger radii (Iodice et al. 2019; P19b). The analysis of the kinematics and properties of the stellar component of this object based on F3D data is presented and extensively discussed by P19b.
B.12. FCC 176 (NGC 1369) – Fig. A.12
FCC 176 is one of the most luminous LTGs of the F3D sample and is characterised by a prominent bar and an outer ring. It is located at Rproj = 0.9° from the centre on the south-western side of the cluster. It is an intermediate infaller in the transion between the high and low-density regions of the cluster where the X-ray emission is still present. Ram-pressure stripping could have acted to stop star formation once the galaxy entered into the cluster core. FCC 176 is indeed the only LTG of the F3D sample that does not show ionised-gas emission. The stellar velocity map shows a regular rotation with a maximum velocity vmax ∼ 120 km s−1 at R ∼ 30 arcsec. The stellar velocity dispersion map is characterised by smaller values (σ ∼ 30 km s−1) for locations on the spiral arm on the north-western side of the galaxy and larger values along the bar (σ ∼ 60 km s−1). On the south-eastern side, the stellar velocity dispersion displays even higher values (σ ≥ 80 km s−1), which needs further investigation as the light from the bright foreground star on this galaxy side could have affected the spectra.
B.13. FCC 177 (NGC 1380A) – Fig. A.13
FCC 177 is an edge-on lenticular galaxy located in the high-density region on the northern side of the cluster at Rproj = 0.8°. It is an ancient infaller in the north-south clump of galaxies. It is characterised by a small and bright bulge, an extended metal-rich and old thin disc, and a metal-poor and younger thick disc (Iodice et al. 2019, P19a). The detailed analysis of the kinematics and properties of the stellar component of FCC 177 from F3D data is presented by P19a.
B.14. FCC 179 (NGC 1386) – Fig. A.14
FCC 179 is a Seyfert 2 early-type spiral at Rproj = 0.7° from the cluster centre on the south-western side. Although it is close in projection to the cluster core and located in the high-density region, FCC 179 is one of the recent infallers of the cluster. This is consistent with the absence of star formation in the outer parts of the disc, probably quenched by ram pressure stripping, while it is still ongoing in the inner regions. This galaxy shows a prominent spiral structure for R ≲ 40 arcsec which disappears outwards. The Hα map reveals the presence of a circumnuclear ring where most of the central star-formation of FCC179 is found. Elsewhere in the disc other sources of ionisation are likely present, in particular in the north-south direction where the impact of AGN activity would be consistent with the central gas outflows in the same direction (Lena et al. 2015). The stellar disc is rotationally supported with vmax ∼ 250 km s−1 at R ∼ 90 arcsec. The stellar velocity dispersion is large in the centre (σ ∼ 150 km s−1) but decreases steeply outwards.
B.15. FCC 182 – Fig. A.15
FCC 182 is a small galaxy at Rproj = 0.3° west of FCC 213 (NGC 1399). It is one of the ancient infallers in the north-south galaxy clump. Although it was classified as a barred galaxy by Ferguson (1989), the stellar velocity map is consistent with that of an ETG hosting a distinct component in the central R ≲ 10 arcsec with a maximum rotation velocity vmax ∼ 15 km s−1. The stellar velocity dispersion is small (σ ∼ 40 km s−1) and is almost constant at all radii. The line-strength maps show that the inner distinct component has larger values of Mgb and Fe5015 (by ∼1 Å) than the outskirts, while Hβ does not show significant variation inside the galaxy (∼2 Å). FDS imaging shows that this structure is characterised by redder colours than its surrounding regions (Iodice et al. 2019).
B.16. FCC 184 (NGC 1387) – Fig. A.16
FCC 184 is the bright elliptical galaxy located at Rproj = 0.3° west of FCC 213 (NGC 1399). Their distance differs by ∼2 Mpc according to Blakeslee et al. (2009). Photometric and spectroscopic studies proved that FCC 184 is tidally interacting with FCC 213 with an ongoing stripping of the eastern part of the outer stellar envelope (D’Abrusco et al. 2016; Spiniello et al. 2018; Iodice et al. 2019). FCC 184 is one of the ancient infallers located in the north-south galaxy clump. The MUSE pointings were aligned along PAphot ∼ 100°, while the stellar kinematics suggests that the rotation axis has PAkin ∼ 60°. FCC 184 has an inner bar, a prominent boxy bulge, and a small kinematically decoupled component. The stellar velocity dispersion is large inside the bulge (σ ∼ 200 km s−1) with isocontours consistent with the bulge boxy isophotes. A nuclear dust-ring of ∼6 arcsec was found from near-infrared (Laurikainen et al. 2006) and optical deep imaging (Iodice et al. 2019). This feature is also detected in the maps of stellar velocity dispersion (smaller σ values) and Hβ line-strength index (larger Hβ values). The Mgb and Fe5015 indices are higher in the inner bar compared to larger radii. The ionised-gas emission shows a central bright ring with prominent star formation and a spiral-like structure. The ionised-gas emission shows a central bright ring where most of the gas has composite star-formation/AGN or LINER-like classification, with fewer regions showing gas mainly powered by star formation. The gas is counter-rotating with respect to the stars, which indicates an external origin for such a structure.
B.17. FCC 190 (NGC 1380B) – Fig. A.17
FCC 190 is one of the four barred lenticular galaxies close to the cluster centre. It is located at Rproj = 0.4° on the north-western side of the cluster. It is one of the ancient infallers of the north-south clump within the high-density region of the cluster. This galaxy has a prominent inner and red (g − i ∼ 1.1 mag) with respect to the bluer outskirts. PAkin and PAphot differ by ∼90° in the region of the bar (R ≲ 40 arcsec). The maximum rotation velocity in the stellar disc is vmax ∼ 100 km s−1. The stellar velocity dispersion is larger along the bar (σ ∼ 80 km s−1) and decreases outwards (σ ∼ 50 km s−1). Along the bar, the Fe5015 line-strength index is higher (∼5 Å) than in the disc (∼4 Å). In the same region, the Hβ and Mgb indices do not show different values compared to the disc.
B.18. FCC 193 (NGC 1389) – Fig. A.18
FCC 193 is one the most luminous barred lenticulars inside the virial radius of the Fornax cluster. It is located at Rproj = 0.4° from FCC 213 (NGC 1399) on the south-western cluster side. It is an ancient infaller which belongs to the north-south clump within the high-density region of the cluster. As in FCC 190, the presence of the bar for R ≲ 30 arcsec is evident in the difference of ∼20° between PAkin and PAphot. The stellar velocity map shows a nuclear disc-like structure (R ≲ 5 arcsec) with a maximum rotation velocity vmax ∼ 100 km s−1. This feature is aligned with the major axis of the outer disc and is characterised by a smaller velocity dispersion (σ ∼ 90 km s−1) with respect to the regions of the bar/outer disc. The maximum rotation velocity in the outer stellar disc is vmax ∼ 130 km s−1 at R ∼ 50 arcsec, where the velocity dispersion decreases to σ ∼ 40 km s−1. The inner disc, bar, and outer disc have also different properties in the maps of the line-strength indices. The inner disc has larger values of Mgb (≳4 Å) and Fe5015 (≳5 Å) than the bar and outer disc, while it shows smaller values of Hβ (∼1 Å). There is a remarkable gradient of the Mgb and Fe5015 indices towards lower values in the bar and outer disc.
B.19. FCC 219 (NGC 1404) – Fig. A.19
FCC 219 is the second brightest ETG inside the virial radius of Fornax. It is ∼1 mag fainter than FCC 213 (NGC 1399) and located at a distance of Rproj = 0.2° from it on the south-eastern side of the cluster. FCC 219 is an ancient infaller settled in the cluster core. The stellar kinematic maps are regular and show large rotation (vmax ∼ 100 km s−1 at R ∼ 50 arcsec) along the photometric major axis. The velocity dispersion profile peaks in the centre (σ ∼ 250 km s−1) and decreases outwards (σ ∼ 90 km s−1 at R ∼ 50 arcsec). There is the signature of a nuclear decoupled component (R ≲ 9 arcsec). The line-strength maps of Mgb and Fe5015 are peaked to the centre and decrease in the outskirts. A filament-like structure, along the north-south direction, was detected in the ionised-gas emission with an intensity peak on the south side of the galaxy. Deep FDS imaging shows a small and red feature that seems to be connected to a red tail on its eastern side (Iodice et al. 2019). The presence of ionised-gas emission suggests that this feature may be the remnant of a disrupted gas-rich small galaxy.
B.20. FCC 249 (NGC 1419) – Fig. A.20
FCC 249 is a compact low-luminosity non-rotating elliptical galaxy at a distance of Rproj = 2.1° from the centre, close to the virial radius of Fornax. It is an intermediate infaller in the southern low-density region of the cluster. The stellar kinematic maps reveal a nuclear (R ≲ 5 arcsec) component with vmax ∼ 50 km s−1. The stellar velocity dispersion peaks in the centre (σ ∼ 110 km s−1) and decreases outwards (σ ∼ 80 km s−1 at R ∼ 20 arcsec). Similar behaviour is observed in Mgb and Fe5015, which are larger in the centre (∼4 Å) and decrease outwards (∼2 Å). Hβ is nearly constant at all radii (∼2 Å).
B.21. FCC 255 (ESO 358-G050) – Fig. A.21
FCC 255 is a lenticular galaxy on the northern side of Fornax at Rproj = 1.8° from FCC 213 (NGC 1399). It is one of the intermediate infallers in the low-density region, with an inner thin disc and outer thicker envelope, also evident in the stellar kinematic and line-strength maps. The maximum rotation is vmax ∼ 50 km s−1 at R ∼ 30 arcsec. The stellar velocity dispersion is small and constant (σ ∼ 40 km s−1) along the disc major axis and increases by ∼20 km s−1 along the minor axis. The thin disc has larger values of Mgb and Fe5015 (by ∼2 Å) and smaller values of Hβ (by ∼1 Å) compared to the thicker envelope.
B.22. FCC 263 (ESO 358-G051) – Fig. A.22
FCC 263 is a late-type barred spiral on the north-eastern side of the cluster at Rproj = 0.8° in the transition from high to low-density regions. It is a recent infaller with perturbed central isophotes. The stellar disc has a maximum rotation velocity vmax ∼ 90 km s−1 at R ∼ 30 arcsec and small and constant velocity dispersion at all radii (σ ∼ 20 km s−1). The galaxy shows strong central Hα emission powered by star-formation. The ionised-gas distribution and kinematics are not entirely regular, with emission extending towards the north, consistent with the molecular gas data (Zabel et al. 2019), and suggests that either a tidal encounter or a minor-merger occurred in the past.
B.23. FCC 276 (NGC 1427) – Fig. A.23
FCC 276 is the brightest elliptical galaxy on the eastern side of the cluster at Rproj = 0.8° from FCC 213 (NGC 1399). It is the only ancient infaller on this side of the transition region from high to low density. This is one of the two slow rotators of the F3D sample. The stellar kinematic maps clearly show the presence of a distinct component in the centre (R ≲ 10 arcsec), which has vmax ∼ 50 km s−1 and σ ∼ 180 km s−1. In the region of the distinct component, the Mgb and Fe5015 line-strength indices are larger (∼5 Å) than outside (∼3 Å) while Hβ is nearly constant at all radii (∼2 Å). Differently from the other distinct components detected in the galaxies close to the cluster core, this feature has bluer colours (Carollo et al. 1997; Iodice et al. 2019).
B.24. FCC 277 (NGC 1428) – Fig. A.24
FCC 277 is a boxy lenticular galaxy located on the eastern side of the cluster at a distance of Rproj = 0.8° from FCC 213 (NGC 1399) in the transition from high to low-density regions. FCC 277 is ∼2 mag fainter than FCC 276, which is the other ETG in this area, and their distance differs by ∼1 Mpc (Blakeslee et al. 2009). Differently from FCC 276, FCC 277 is an intermediate infaller. The stellar kinematics is consistent with a bulge of σ ∼ 90 km s−1 for R ≲ 10 arcsec and a disc of vmax ∼ 100 km s−1 and σ ∼ 50 km s−1 at R ∼ 30 arcsec. A dip in the velocity dispersion is observed in the nucleus (σ ∼ 60 km s−1 for R ≲ 2 arcsec). This feature has bluer colours than its surroundings (Iodice et al. 2019). The line-strength maps show that Hβ, Mgb, and Fe5015 are larger (∼4 Å) in a discy region of ∼10 arcsec along the major axis, whereas the values of all the indices are smaller outside.
B.25. FCC 285 (NGC 1437A) – Fig. A.25
FCC 285 is a very late-type spiral located on the south-eastern side at a distance of Rproj = 1.2° from the cluster centre. Despite its irregular morphology, the galaxy shows a stellar velocity map with a regular rotation pattern with vmax ∼ 20 km s−1 at R ∼ 20 arcsec. The stellar velocity dispersion is extremely small (σ ≲ 5 km s−1) at all radii. Intense Hα emission is detected over the entire extent of the galaxy. It mainly consists of HII-regions all along the spiral structure. As in FCC113, the central parts of several of these HII-regions show high level of ionisation that bring them outside the domain of HII-regions in BPT diagrams. The ionised gas co-rotates with the stellar disc. FCC 285 is one of the recent infallers in the low-density region of the cluster. This is consistent with the active star formation and presence of neutral hydrogen (Schröder et al. 2001).
B.26. FCC 290 (NGC 1436) – Fig. A.26
FCC 290 is a late-type spiral at Rproj = 1.1° from FCC 213 (NGC 1399) in the south-eastern low-density region of the cluster. It is one of the intermediate infallers in this area. Since the spiral arms are prominent inside ∼2 arcmin and the disc appears smooth and featureless outwards, this galaxy may evolve into a lenticular system (see also Raj et al. 2019). The spiral arms cause perturbations in the central regions of the stellar kinematic maps. The disc has vmax ∼ 140 km s−1 at R ∼ 60 arcsec and a very small velocity dispersion (σ ≲ 30 km s−1). This galaxy shows a regular ionised-gas disc that co-rotates with the stars and with the molecular gas (Zabel et al. 2019). The gas distribution is characterised by the presence of several HII-regions, generally powered by star-formation, except for the central, bulge-dominated region where the gas emission is much fainter and takes on a LINER-like classification.
B.27. FCC 301 (ESO 358-G059) – Fig. A.27
FCC 301 is one of the faintest elliptical galaxies inside the virial radius of the Fornax cluster. It is located at a distance of Rproj = 1.4° from FCC 213 (NGC 1399) and is one of the recent infallers in the low-density region on the south-eastern side. As FCC 90 and FCC 147, which are the other two ETGs classified as recent infallers, also FCC 301 has different photometric and kinematic properties compared to the ETGs identified as ancient infallers. The central discy isophotes are consistent with the inner stellar disc detected in the maps of the velocity (vmax ∼ 60 km s−1) and velocity dispersion (σ ≲ 40 km s−1 at R ∼ 10 arcsec). At larger radii, the galaxy is characterised by a roundish envelope which is slowly rotating (vmax ∼ 30 km s−1) and has a larger velocity dispersion (σ ≲ 80 km s−1) with respect to the inner disc. The inner disc and outer envelope also have different properties in the line-strength maps. The inner disc shows larger values of Mgb (∼3 Å) and Fe5015 (∼5 Å) compared to the envelope, whereas Hβ remains almost constant (∼2 Å) throughout the galaxy.
B.28. FCC 306 – Fig. A.28
FCC 306 is the faintest and smallest galaxy inside the virial radius of the Fornax cluster. This extremely-late barred galaxy is located on the south-eastern side of the cluster at Rproj = 1.7° from the centre. It is one of the recent infallers populating the low-density region. The stellar velocity maps suggests a low rotation (vmax ∼ 20 km s−1) along PAkin ∼ −30° whereas PAphot ∼ 30°. Therefore, FCC 306 is classified as a prolate rotator. The stellar velocity dispersion is very small at all radii (σ ≲ 20 km s−1). Hα emission is detected in the inner 10 arcsec with several blobs on the north-western side of the galaxy.
B.29. FCC 308 (NGC 1437B) – Fig. A.29
FCC 308 is a late-type spiral which is close to FCC 306 at Rproj = 1.8° from FCC 213 (NGC 1399). It is one of the intermediate infallers located in the low-density region on the south-eastern side of the cluster. The central regions are perturbed by dust, which also affects the stellar kinematic maps. The disc has a maximum rotation velocity of vmax ∼ 50 km s−1 at R ∼ 50 arcsec. The velocity dispersion is ∼50 km s−1 at all radii and tends to increase along the minor axis. Ionised-gas emission is detected throughout the central region, where star-formation is pervasive. The ionised-gas distribution is characterise by the presence of several HII-regions associated to inner spiral structure.
B.30. FCC 310 (NGC 1460) – Fig. A.30
FCC 310 is the only barred lenticular galaxy on the eastern side of the cluster. It is located at a distance Rproj = 2.0° which corresponds to about the virial radius of the Fornax cluster. It is an intermediate infaller in the south-eastern low-density region of the cluster. The prominent peanut-shaped bar is evident in the reconstructed galaxy image and gives rise to the difference of ∼40° between PAkin and PAphot. The underlying stellar disc has a maximum rotation velocity vmax ∼ 100 km s−1 at R ∼ 40 arcsec. The stellar velocity dispersion is relatively large in the bulge and bar (σ ≲ 70 km s−1) and decreases outside (σ ≲ 40 km s−1 at R ∼ 40 arcsec). As also observed in FCC 277 and FCC 301, which are the two other ETGs on the eastern side of the cluster, FCC 310 has a blue nucleus which causes a dip in the velocity dispersion (σ ≲ 50 km s−1 at R ≲ 2 arcsec). The bar structure clearly stands out in the line-strength maps of Mgb (∼3 dex) and Fe5015 (∼5 dex). Hβ is constant through the galaxy (∼2 dex).
B.31. FCC 312 (ESO 358-G063) – Fig. A.31
FCC 312 is a late-type spiral and the most luminous LTG inside the virial radius of the Fornax cluster. It is located in the low-density region at distance Rproj = 1.7° from the centre of the cluster on its eastern side. Deep FDS imaging shows faint tidal tails warping out from the stellar disc (Raj et al. 2019), which has maximum rotation velocity of vmax ∼ 120 km s−1 at R ∼ 90 arcsec. At the same distance the velocity dispersion is ∼30 km s−1. The disc is dominated by Hα emission powered by star-formation, although some highly-excited material protrudes out of the disc near, but not exactly along, the direction of the galaxy minor axis. Star formation together with detected neutral hydrogen (Schröder et al. 2001) and molecular gas (Zabel et al. 2019) are consistent with this galaxy being a recent infaller into the cluster potential.
Appendix C: Additional table
Main morphological, photometric, and kinematic properties of the F3D galaxies.
All Tables
Main morphological, photometric, and kinematic properties of the F3D galaxies.
All Figures
|
Fig. 1. Left: distribution of the spatial coverage of the F3D MUSE data for ETGs (solid line) and LTGs (dashed line) in units of effective radius, as measured along the major axis. Right: spatial coverage of the F3D ETGs (circles) and LTGs (crosses) as a function of the total stellar mass. The long-dashed and dash-dotted lines correspond to the average spatial coverage from the long-slit data of Bedregal et al. (2006) and integral-field data of Scott et al. (2014), respectively. The adopted values of Re for the comparison with literature are given in Table C.1. |
| In the text | |
|
Fig. 2. Distribution of the seeing FWHM measured on the F3D MUSE pointings. The vertical thick segment marks the median value. |
| In the text | |
|
Fig. 3. Left: specific stellar angular momentum of the F3D ETGs (circles) and LTGs (crosses) as a function of the ellipticity measured at the effective radius. Galaxies classified as regular rotators (RRs) are shown with red symbols. The light-blue symbols correspond to galaxies with a distinct core (DC). The blue circle corresponds to the only non-rotating ETG of the sample (NR). Galaxies with a kinematically decoupled core (KDC) are shown with magenta symbols. The black asterisk corresponds to FCC 213 (NGC 1399) and it is taken from Scott et al. (2014). The black solid line divides FRs from SRs according to Emsellem et al. (2011). The light green, light blue, and light magenta areas indicate the location of the galaxies from the ATLAS3D (Emsellem et al. 2011), CALIFA (Falcón-Barroso et al. 2011), and MANGA survey (Graham et al. 2018), respectively.. Right: relative fraction of the F3D SRs (red circles), FRs (blue circles), and LTGs (green circles) as function of the projected radius from the centre of the Fornax cluster in units of virial radius (top) and as a function of the local projected density of the cluster (bottom). The vertical dashed line separates the high and low-density regions of the cluster. |
| In the text | |
|
Fig. 4. Difference between the mean kinematic and photometric position angles for the F3D galaxies as function of the projected radius from the centre of the Fornax cluster in units of virial radius. Symbols are as in the left panel of Fig. 3. The vertical dashed line separates the high and low-density regions of the cluster. |
| In the text | |
|
Fig. 5. Left: mean age (top), total metallicity [M/H] (middle), and [Mg/Fe] abundance ratio (bottom) in the central parts of the F3D ETGs located in the high (red circles) and low-density region (blue circles) of the cluster as a function of the total stellar mass. The red and blue lines in the middle and bottom panels are the least-square fits of the values for the central parts of the ETGs in the high and low-density regions of the cluster, respectively. The error bars in the low-left corner indicate the average uncertainty derived for each quantity. Right: same as in the left panels but for the outskirts of the F3D ETGs. The least-square fitting lines of the left panels are shown as dashed lines for comparison. |
| In the text | |
|
Fig. 6. Projected phase-space diagram of the F3D ETGs (filled circles) and LTGs (crosses). Symbols are as in the left panel of Fig. 3. Galaxies with low (black open triangles) and high star formation (black open circles) are also shown. The black solid line corresponds to the cluster escape velocity. The vertical dashed line separates the high and low-density regions of the cluster. According to Rhee et al. (2017), region A is populated by the first infallers, regions B and C (together delimited by the dashed light-green, solid orange, and solid green lines) contain 80% of the recent infallers, regions D (delimited by the solid green and solid orange lines) and E (delimited by the solid orange line) contain 40% of the intermediate infallers, and the ancient infallers are found in region E. The name of the galaxies classified as recent infallers are also indicated on the plot. |
| In the text | |
|
Fig. 7. Distribution of the F3D ETGs (circles) and LTGs (crosses) onto the sky plane. The right ascension and declination (J2000.0) are given in degrees on the horizontal and vertical axes of the field of view, respectively. The background image and contours map the X-ray emission in the energy range 0.4–1.3 KeV as measured by XMM-Newton (Frank et al. 2013). The dashed circle indicates the transition from the high-to-low density region of the cluster at 0.4 Rvir. Orange, green, and light-green symbols represent the ancient, intermediate, and recent infallers, respectively, according to the analysis of the PPS diagram shown in Fig. 6. Galaxies with low (black open triangles) and high star formation (black open circles) are also shown. The slow rotators (SRs) are marked with open black squares. As in Fig. 6, all the recent infallers are labelled. |
| In the text | |
|
Fig. 8. Mass-size distribution of the F3D ETGs (circles) and LTGs (crosses). Orange, green, and light-green symbols represent the ancient, intermediate, and recent infallers, respectively, according to the analysis of the PPS diagram shown in Fig. 6. Galaxies with low (black open triangles) and high star formation (black open circles) are also shown. The slow rotators (SRs) are marked with open black squares. The critical mass, defined by Cappellari (2013), is marked by the black dashed line. For reference, the blue dash-dotted line and the solid red line indicate the upper limit of the spiral galaxies and the lower limit of the ETGs from ATLAS3D sample (Cappellari et al. 2013). |
| In the text | |
|
Fig. A.1. Stellar analysis for FCC 83. First row panels: MUSE reconstructed image (left). The dotted ellipses correspond to the isophotes at 0.5 Re, Rtr, and μB = 25 mag arcsec−2, respectively. Maps of the mean velocity (middle) and velocity dispersion (right) of the stellar LOSVD. Second row panels: radial profiles of the kinematic (black circles) and photometric (green circles) position angle (left). The vertical dashed lines mark the radial range where the average position angles are computed. Maps of the third (middle) and fourth Gauss-Hermite coefficient (right) of the stellar LOSVD. Third row panels: maps of the Hβ (left), Mgb (middle), and Fe5015 line-strength index (right). |
| In the text | |
|
Fig. A.2. Stellar and ionised-gas analysis for FCC 90. First row panels: MUSE reconstructed image (left). The dotted ellipses correspond to the isophotes at 0.5 Re, Rtr, and μB = 25 mag arcsec−2, respectively. Maps of the mean velocity (middle) and velocity dispersion (right) of the stellar LOSVD. Second row panels: radial profiles of the kinematic (black circles) and photometric (green circles) position angle (left). The vertical dashed lines mark the radial range where the average position angles are computed. Maps of the third (middle) and fourth Gauss-Hermite coefficient (right) of the stellar LOSVD. Third row panels: maps of the Hβ (left), Mgb (middle), and Fe5015 line-strength index (right). Fourth row panels: map of the Hα flux (left). Data are shown in logarithmic scale and in units of 10−20 erg cm−2 s−1 where the S/N of the line is sufficiently elevated to exclude a false positive detection. Map of the Hα velocity (middle) with respect to the systemic velocity, as derived from the median gas-velocity value in the central regions of the galaxy. Map of the ionised-gas classification (right) into H II regions (blue), highly-ionised or AGN regions (yellow), LINER-like emission regions (red), and regions where the nebular emission is powered by some combination of massive-star radiation and other ionisation sources (green). |
| In the text | |
|
Fig. A.3. Stellar and ionised-gas analysis for FCC 113. First row panels: MUSE reconstructed image (left). The dotted ellipse corresponds to the isophote at μB = 25 mag arcsec−2. Maps of the mean velocity (middle) and velocity dispersion (right) of the stellar LOSVD. Second row panel: radial profiles of the kinematic (black circles) and photometric (green circles) position angle. Third row panels: map of the Hα flux (left). Data are shown in logarithmic scale and in units of 10−20 erg cm−2 s−1 where the S/N of the line is sufficiently elevated to exclude a false positive detection. Map of the Hα velocity (middle) with respect to the systemic velocity, as derived from the median gas-velocity value in the central regions of the galaxy. Map of the ionised-gas classification (right) into H II regions (light-blue), highly-ionised or AGN regions (yellow), LINER-like emission regions (red), and regions where the nebular emission is powered by some combination of massive-star radiation and other ionisation sources (green). |
| In the text | |
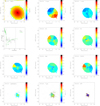 |
Fig. A.4. Same as in Fig. A.2, but for FCC 119. |
| In the text | |
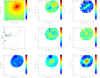 |
Fig. A.5. Same as in Fig. A.1, but for FCC 143. |
| In the text | |
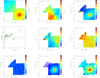 |
Fig. A.6. Same as in Fig. A.1, but for FCC 147. |
| In the text | |
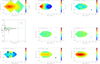 |
Fig. A.7. Same as in Fig. A.1, but for FCC 148. |
| In the text | |
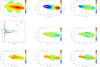 |
Fig. A.8. Same as in Fig. A.1, but for FCC 153. |
| In the text | |
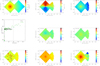 |
Fig. A.9. Same as in Fig. A.1, but for FCC 161. |
| In the text | |
|
Fig. A.10. Same as in Fig. A.2, but for FCC 167. |
| In the text | |
|
Fig. A.11. Same as in Fig. A.1, but for FCC 170. |
| In the text | |
|
Fig. A.12. Stellar analysis for FCC 176. First row panels: MUSE reconstructed image (left). The dotted ellipse correspond to the isophotes at μB = 25 mag arcsec−2. Maps of the mean velocity (middle) and velocity dispersion (right) of the stellar LOSVD. Second row panels: radial profiles of the kinematic (black circles) and photometric (green circles) position angle (left). The vertical dashed lines mark the radial range where the average position angles are computed. Maps of the third (middle) and fourth Gauss-Hermite coefficient (right) of the stellar LOSVD. |
| In the text | |
|
Fig. A.13. Same as in Fig. A.1, but for FCC 177. |
| In the text | |
|
Fig. A.14. Stellar and ionised-gas analysis for FCC 179. First row panels: MUSE reconstructed image (left). The dotted ellipse corresponds to the isophote at μB = 25 mag arcsec−2. Maps of the mean velocity (middle) and velocity dispersion (right) of the stellar LOSVD. Second row panels: radial profiles of the kinematic (black circles) and photometric (green circles) position angle (left). The vertical dashed lines mark the radial range where the average position angles are computed. Maps of the third (middle) and fourth Gauss-Hermite coefficient (right) of the stellar LOSVD. Third row panels: map of the ionised-gas classification (right) into H II regions (blue), highly-ionised or AGN regions (yellow), LINER-like emission regions (red), and regions where the nebular emission is powered by some combination of massive-star radiation and other ionisation sources (green). |
| In the text | |
|
Fig. A.15. Same as in Fig. A.1, but for FCC 182. |
| In the text | |
|
Fig. A.16. Same as in Fig. A.2, but for FCC 184. |
| In the text | |
|
Fig. A.17. Same as in Fig. A.1, but for FCC 190. |
| In the text | |
|
Fig. A.18. Same as in Fig. A.1, but for FCC 193. |
| In the text | |
|
Fig. A.19. Same as in Fig. A.2, but for FCC 219. |
| In the text | |
|
Fig. A.20. Same as in Fig. A.1, but for FCC 249. |
| In the text | |
|
Fig. A.21. Same as in Fig. A.1, but for FCC 255. |
| In the text | |
|
Fig. A.22. Same as in Fig. A.14, but for FCC 263. |
| In the text | |
|
Fig. A.23. Same as in Fig. A.1, but for FCC 276. |
| In the text | |
|
Fig. A.24. Same as in Fig. A.1, but for FCC 277. |
| In the text | |
|
Fig. A.25. Same as in Fig. A.3, but for FCC 285. |
| In the text | |
|
Fig. A.26. Same as in Fig. A.14, but for FCC 290. |
| In the text | |
|
Fig. A.27. Same as in Fig. A.1, but for FCC 301. |
| In the text | |
|
Fig. A.28. Same as in Fig. A.14, but for FCC 306. |
| In the text | |
|
Fig. A.29. Same as in Fig. A.14, but for FCC 308. |
| In the text | |
|
Fig. A.30. Same as in Fig. A.1, but for FCC 310. |
| In the text | |
|
Fig. A.31. Same as in Fig. A.14, but for FCC 312. |
| In the text | |
Current usage metrics show cumulative count of Article Views (full-text article views including HTML views, PDF and ePub downloads, according to the available data) and Abstracts Views on Vision4Press platform.
Data correspond to usage on the plateform after 2015. The current usage metrics is available 48-96 hours after online publication and is updated daily on week days.
Initial download of the metrics may take a while.