Fig. 8.
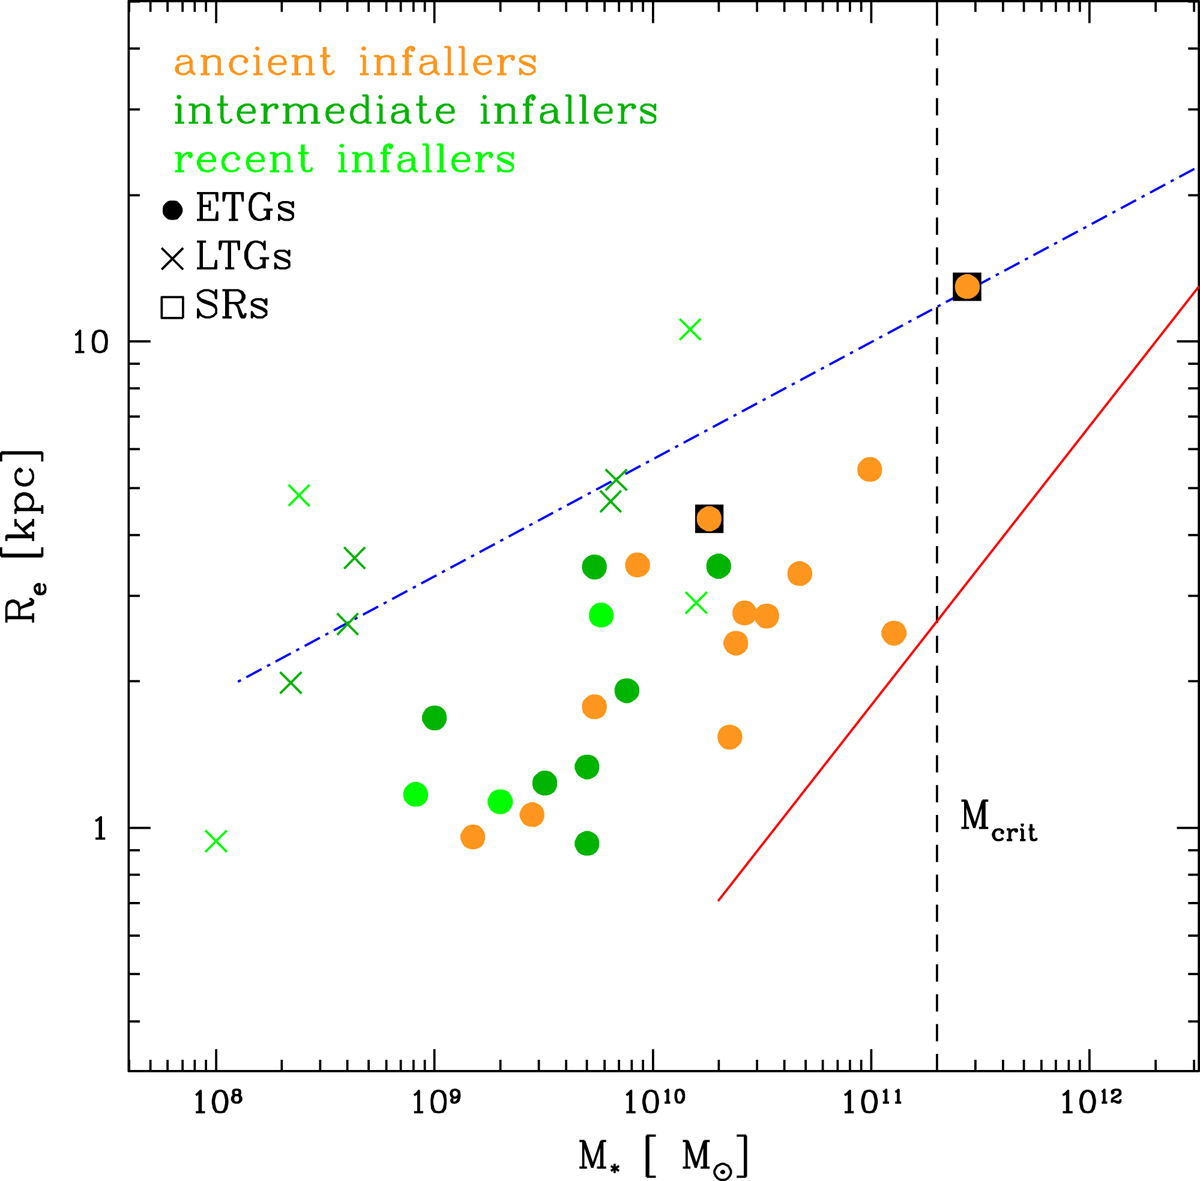
Mass-size distribution of the F3D ETGs (circles) and LTGs (crosses). Orange, green, and light-green symbols represent the ancient, intermediate, and recent infallers, respectively, according to the analysis of the PPS diagram shown in Fig. 6. Galaxies with low (black open triangles) and high star formation (black open circles) are also shown. The slow rotators (SRs) are marked with open black squares. The critical mass, defined by Cappellari (2013), is marked by the black dashed line. For reference, the blue dash-dotted line and the solid red line indicate the upper limit of the spiral galaxies and the lower limit of the ETGs from ATLAS3D sample (Cappellari et al. 2013).
Current usage metrics show cumulative count of Article Views (full-text article views including HTML views, PDF and ePub downloads, according to the available data) and Abstracts Views on Vision4Press platform.
Data correspond to usage on the plateform after 2015. The current usage metrics is available 48-96 hours after online publication and is updated daily on week days.
Initial download of the metrics may take a while.