| Issue |
A&A
Volume 699, July 2025
|
|
|---|---|---|
| Article Number | A331 | |
| Number of page(s) | 25 | |
| Section | Extragalactic astronomy | |
| DOI | https://doi.org/10.1051/0004-6361/202554159 | |
| Published online | 23 July 2025 | |
The S-PLUS Fornax Project (S+FP): Mapping Hα+[N II] emission in 77 Fornax galaxy members reaching ∼4 Rvir
1
Instituto de Astrofísica de La Plata, CONICET-UNLP, Paseo del Bosque s/n, B1900FWA, La Plata, Argentina
2
Facultad de Ciencias Astronómicas y Geofísicas, Universidad Nacional de La Plata, Paseo del Bosque s/n, B1900FWA, La Plata, Argentina
3
Universidade de São Paulo, IAG, Rua do Matão 1226, São Paulo, SP, Brazil
4
Universidad de Investigación y Desarrollo, Departamento de Ciencias Básicas y Humanas, Grupo FIELDS, Calle 9 No. 23-55, Bucaramanga, Colombia
5
Departamento de Física, Universidad Técnica Federico Santa María, Avenida España 1600, 2390123, Valparaíso, Chile
6
Departamento de Astronomía, Universidad de La Serena, Av. J. Cisternas 1200 N, 1720236 La Serena, Chile
7
Observatório Nacional, Rua General José Cristino, 77, São Cristóvão, 20921-400 Rio de Janeiro, RJ, Brazil
8
Armagh Observatory and Planetarium, College Hill, Armagh BT61 9DG, UK
9
Instituto de Física, Universidade Federal do Rio de Janeiro, 21941-972, Rio de Janeiro, Brazil
10
Observatório do Valongo, Ladeira Pedro Antonio, 43, 20080-090, Rio de Janeiro, Brazil
11
Departamento de Física – CFM – Universidade Federal de Santa Catarina, PO BOx 476, 88040-900, Florianópolis, SC, Brazil
12
Cambridge Survey Astronomical Unit (CASU), Insitute of Astronomy, University of Cambridge, Madingley Road, Cambridge, CB3 0HA, GB, UK
13
Instituto Argentino de Radioastronomía, CONICET-CICPBA-UNLP, CC5 (1894) Villa Elisa, Provincia de Buenos Aires, Argentina
14
Institute of Astrophysics, Facultad de Ciencias Exactas, Universidad Andrés Bello, Sede Concepción, Talcahuano, Chile
15
Instituto Multidisciplinario de Investigación y Postgrado, Universidad de La Serena, Raúl Bitrán 1305, 1700000 La Serena, Chile
16
Kavli Institute for Cosmological Physics, University of Chicago, Chicago, IL 60637, USA
17
Instituto de Astrofísica e Ciências do Espaço, Universidade do Porto, CAUP, Rua das Estrelas, 4150-762, Porto, Portugal
18
Departamento de Física e Astronomia, Faculdade de Ciências, Universidade do Porto, Rua do Campo Alegre 687, 4169-007, Porto, Portugal
19
Departamento de Tecnologías Industriales, Facultad de Ingeniería, Universidad de Talca, Los Niches km 1, Curicó, Chile
20
Centre for Extragalactic Astronomy, Department of Physics, Durham University, South Road, Durham DH1 3LE, UK
21
Instituto Nacional de Pesquisas Espaciais, Av. dos Astronautas 1758, Jardim da Granja, 12227-010 São José dos Campos, SP, Brazil
22
Universidade Presbiteriana Mackenzie, Rua da Consolação, 930 – Consolação, São Paulo, Brazil
23
GMTO Corporation 465 N. Halstead Street, Suite 250 Pasadena, CA 91107, USA
24
Rubin Observatory Project Office, 950 N. Cherry Ave., Tucson, AZ 85719, USA
⋆ Corresponding author: This email address is being protected from spambots. You need JavaScript enabled to view it.
Received:
17
February
2025
Accepted:
19
May
2025
Abstract
Context. The Fornax cluster, the second-largest galaxy cluster within 20 Mpc, presents an ideal environment for studying the impact of environmental effects on galaxy evolution. Utilizing data from the Southern Photometric Local Universe Survey (S-PLUS), this study explores the Hα+[N II] emission maps in Fornax and its outskirts.
Aims. By mapping emission features across an area of approximately 208 square degrees around NGC 1399, this work aims to identify and characterize emission-line galaxies (ELGs) and analyze their spatial distribution, morphology, and their projected phase space (PPS) diagram.
Methods. We developed a dedicated semiautomated pipeline, pixel-to-pixel emission line estimate (PELE), to generate emission line maps by processing S-PLUS images using the three-filter method. A morphological analysis was conducted using the ASTROMORPHLIB package to determine whether Hα+[N II] emitters exhibit perturbed features.
Results. The study successfully detected 77 Hα+[N II] emitters with rAB<18 mag, extending to four times the virial radius of the Fornax cluster. PELE demonstrated its ability to recover flux down to ∼2×10⁻¹⁷ erg s−1 cm−2 when compared to Hα maps from MUSE/VLT. Among the emitters, 25% are early-type galaxies (ETGs) and 75% are late-type galaxies (LTGs). Signs of morphological perturbation or merger activity are observed in 44% of the LTGs and in three ETGs located beyond the clusters virial radius. A significant fraction (91%) of the emitters are identified as recent infallers, which are primarily located in the northwestern region of the cluster, while others are associated with the infalling group Fornax A in the southwest. Disturbed, low-mass galaxies at larger cluster-centric distances provide evidence that galaxies begin transforming before entering the main cluster.
Conclusions. This study demonstrates S-PLUS's effectiveness in detecting ELGs, whose distribution reflects the Fornax cluster's assembly history; LTGs are linked to recent infall from the field, possibly along a Fornax-Eridanus filament, and ETGs may have evolved prior to entry.
Key words: methods: data analysis / techniques: photometric / surveys / galaxies: ISM / galaxies: clusters: individual: Fornax
© The Authors 2025
 Open Access article, published by EDP Sciences, under the terms of the Creative Commons Attribution License (https://creativecommons.org/licenses/by/4.0), which permits unrestricted use, distribution, and reproduction in any medium, provided the original work is properly cited.
This article is published in open access under the Subscribe to Open model. This email address is being protected from spambots. You need JavaScript enabled to view it. to support open access publication.
1. Introduction
The gas content of galaxies located in the cores of rich clusters is expected to be depleted due to interaction with the hot intracluster medium (e.g., Gunn et al. 1972; Giovanelli & Haynes 1983; Jáchym et al. 2017; Pedrini et al. 2022). Additional processes, such as tidal interactions between galaxies and galaxy-galaxy collisions, also contribute to this depletion (e.g., Combes et al. 1988; Kenney et al. 1995; Vollmer et al. 2009; Spilker et al. 2022). As a consequence, galaxies placed in the central regions of galaxy clusters are unable to sustain intense star formation activity and, in comparison with galaxies in low-density environments, tend to display poor amounts of cold gas. However, the quenching found in the outskirts of galaxy clusters cannot be explained by infalling processes. In contrast, such a suppression of star formation is more likely linked to a preprocessing effect, i.e., galaxies are organized in groups or subclusters that later fall into the main cluster (Zabludoff et al. 1996; Fujita et al. 2003; Haines et al. 2013, 2015; Fossati et al. 2019; Lopes et al. 2024).
In order to disentangle the timescales involved in the star formation activity of a galaxy, we can take advantage of several spectroscopic features. As an example, star formation that occurred in the last 10 Myr is traced by the Hα emission line detected in H II regions, while the Hδ (D4000) absorption feature together with the (g−r) color index can trace the mean star formation rate (SFR) of the last 800 Myr (Balogh et al. 1999; Kauffmann et al. 2003). These features allow us to distinguish between different quenching processes, as ram-pressure stripping is expected to stop star formation on the order of a few hundred million years in contrast to, for example, starvation, which takes on the order of a few billion years to produce a similar effect (e.g., Wetzel et al. 2013; Boselli et al. 2014).
The Fornax galaxy cluster is a remarkable place to analyze the influence of a high density environment on the star formation history of galaxies. With a low virial mass (Mvir) of (7±2)×1013 M⊙ within a projected radius of 1.4 Mpc (Drinkwater et al. 2001), it is the second most well-populated galaxy cluster within 20 Mpc (Blakeslee et al. 2009) after Virgo. Due to its low total X-ray luminosity (5×1041 erg s−1, Jones et al. 1997), the presence of a large amount of hot intracluster gas is not expected. As a consequence, ram-pressure stripping would not be the dominant mechanism of gas loss in Fornax’ galaxies (Horellou et al. 1995, and references therein). In contrast, Fornax displays a higher galaxy number density in its center and a lower velocity dispersion than Virgo, which indicates an environment in which tidal interactions are more effective than hydrodynamical effects (Maddox et al. 2019). However, it has been found that H I-rich galaxies in Fornax display weak Hα emission, which is consistent with generally low star formation activity as revealed by low far-infrared and nonthermal radiocontinuum emissions (Horellou et al. 1995, and references therein).
Fornax is still growing by accreting new galaxies and nearby galaxy groups. As an example, the Fornax A group, centered around NGC 1316, is a galaxy group at the edge of the cluster and moving toward its center, possibly along a large-scale filament (Scharf et al. 2005; Venhola et al. 2019). According to Raj et al. (2020), Fornax A is in an early stage of assembly, as shown by the fact that there is no clear trend between the photometric properties of its galaxies and the group-centric distances. In this context, there is observational evidence indicating that NGC 1316 arose from a merger between a gas-poor early-type galaxy and a smaller, gas-rich spiral, just 1–3 Gyr ago (Serra et al. 2019). Additionally, Kleiner et al. (2021) analyzed 12 galaxies in the Fornax A group using MeerKAT H I observations and found evidence of preprocessing in nine of them. These galaxies were classified according to their preprocessing stage, categorized as early, ongoing, or advanced. Their study highlights that preprocessing stages can vary significantly even among galaxies within the same group, pointing to complex interactions that shape galaxy evolution before galaxies enter the main cluster.
The Fornax system (Fornax and Fornax A) has been extensively studied through complementary surveys. The Fornax Deep Survey (FDS) has performed deep imaging in four broad bands (u, g, r, i) using the Very Large Telescope (VLT) located at Paranal Observatory, Chile. This survey covers an area of ∼26 square degrees around NGC 1399, including the Fornax A group. This effort led to a series of publications exploring various components of the Fornax system, such as the extended and diffuse stellar halo of NGC 1399 (Iodice et al. 2016), low surface brightness galaxies (Venhola et al. 2017, 2022), dwarf galaxies (Venhola et al. 2018, 2019), bright early-type galaxies (Iodice et al. 2019a; Spavone et al. 2020), late-type galaxies (Raj et al. 2019), globular clusters (Cantiello et al. 2020), Fornax A galaxy assembly and its intra-group light (Iodice et al. 2017; Raj et al. 2020), and the signs of preprocessing in the Fornax system (Su et al. 2021). In parallel, the Fornax3D project (F3D; Sarzi et al. 2018) observed 31 galaxies in the Fornax cluster using the Multi Unit Spectroscopic Explorer (MUSE, Bacon et al. 2010) to create a rich dataset that has facilitated numerous studies. These include analyses of kinematic and line-strength maps (Iodice et al. 2019b), planetary nebulae (Spriggs et al. 2020, 2021), globular clusters (Fahrion et al. 2020a, b), stellar kinematics, dynamical, and population analysis for lenticular galaxies (Pinna et al. 2019a, b; Poci et al. 2021), gas metallicity gradients (Lara-López et al. 2022), and the assembly history of massive early-type galaxies (Spavone et al. 2022). However, the F3D sample is limited to galaxies brighter than mB = 15 mag, which introduces a bias against fainter galaxies. In addition, by design, it does not include objects located outside the Rvir of the cluster and its group, Fornax A. Together, FDS and F3D have significantly advanced our understanding of galaxy evolution and the assembly history of the Fornax cluster, particularly within its virial radius (Rvir = 2 deg, Drinkwater et al. 2001), have shed light on the formation of substructures in galaxy clusters.
In order to assess the recent star-forming activity in the Fornax cluster, its outskirts, and the Fornax A group following a comprehensive standard method, we search for galaxies whose Hα+[N II] emission can be spatially resolved. The prime data for such an analysis is obtained from integral field spectroscopic (IFS) surveys, such as MUSE. However, IFS surveys do not present extensive contiguous observed area, which renders the analysis of the surrounding environment of nearby galaxies difficult. In addition, the limited field of view (FOV) of instruments in these surveys creates a limitation for larger galaxies, such as NGC 1365, which extends to a diameter higher than 10 arcmin and requires multiple pointings to cover the whole galaxy.
To circumvent the aforementioned limitations of IFS, one effective approach is to use multiband surveys such as the Classifying Objects by Medium-Band Observations in 17 Filters (COMBO-17, Wolf et al. 2003), the Advanced Large Homogeneous Area Medium-Band Redshift Astronomical (ALHAMBRA, Moles et al. 2008), the Multiwavelength Survey by Yale-Chile (MUSYC, Cardamone et al. 2010), the Survey for High-z Absorption Red and Dead Sources (SHARDS, Pérez-González et al. 2013), the Cosmic Evolution Survey (Taniguchi et al. 2015, COSMOS), the Javalambre Photometric Local Universe Survey (Cenarro et al. 2019, J-PLUS) and the Javalambre Physics of the Accelerating Universe Astrophysical Survey (Benitez et al. 2014, J-PAS). These surveys are designed with a set of intermediate and/or narrow-band (NB) filters that provide the intended spectral information while simultaneously encompassing large contiguous regions. Therefore, studies that focus on the detection of emission-line galaxies can be performed using the released photometric catalogs through the analysis of, for example, color-color diagrams, or by building emission-line maps from NB images (e.g., Fujita et al. 2003; Glazebrook et al. 2004; Geach et al. 2008; Sobral et al. 2009; Ly et al. 2011; Kellar et al. 2012; Cook et al. 2019; Khostovan et al. 2020; Salzer et al. 2023).
The Southern Photometric Local Universe Survey (S-PLUS; Mendes de Oliveira et al. 2019) is an ongoing imaging project with 12-filters, which aims to cover ∼9300 square degrees of the Southern sky. It uses a 0.8-meter robotic telescope, the T80-South, located at the Cerro Tololo Inter-American Observatory (CTIO) in Chile. It is equipped with the Javalambre filter system (Cenarro et al. 2019), which includes five Sloan Digital Sky Survey-like broad bands (u, g, r, i, z), and seven narrow bands (J0378, J0395, J0410, J0430, J0515, J0660, J0861), which cover different spectral features. In particular, the J0660 filter catches Hα+[N II] in galaxies at z≲0.019, which makes it an invaluable tool to study the star formation history in the local Universe on a large scale.
In that context, and as part of the S-PLUS Fornax Project (S+FP; Smith Castelli et al. 2024, hereafter, Paper I), we present an analysis of the Hα+[N II] emission in the Fornax galaxy cluster using images from S-PLUS. In its first stage, the S+FP is exploring Fornax up to ∼5Rvir in right ascension (RA) and up to ∼2.5Rvir in declination (Dec). This represents a sky projected area of ∼208 deg2 around NGC 1399, the dominant galaxy of the cluster. Given the unprecedented sky coverage of Fornax provided by S-PLUS, our analysis extends to the outskirts of the cluster where preprocessing is expected to play a key role. In this paper we focus on the identification of Hα+[N II] spatially resolved emitters among the reported galaxy members of Fornax. This detection is performed using Hα+[N II] maps generated with a code specially developed for that purpose. In addition, we analyze the morphologies displayed by the identified emitters in relation to their spatial distribution within the cluster and in the projected phase space (PPS) diagram (e.g., Rhee et al. 2017). The combination of such analyses allows us to identify recent and ancient infallers as well as perturbed and merged galaxies, which represents valuable information to give clues about the influence of the environment on the star formation history and morphological transformation of Hα+[N II] emitters in Fornax.
The paper is organized as follows. In Section 2, we describe the input galaxy catalog and the data images used here. Section 3 introduces the code applied to create emission-line maps and its validation using IFS results. In Section 4, we analyze the general characteristics of galaxies where the Hα+[N II] maps were successfully obtained, such as optical and emission morphologies, spatial distribution, and location in the phase-space diagram, and compare this information with the literature results and preliminary analysis from simulations. In Section 5, we present our conclusions.
Throughout this work we use AB magnitudes, a distance modulus of (m−M) = 31.51 mag is assumed for Fornax (Blakeslee et al. 2009), and a mean redshift of z = 0.0048 (considering a mean velocity Vcluster = 1442 km s−1 around NGC 1399; Maddox et al. 2019). For the main structure of Fornax, we consider Rvir = 0.7 Mpc centered on NGC 1399, and, for the Fornax A group, Rvir = 0.35 Mpc centered on NGC 1316 (Drinkwater et al. 2001). At the assumed Fornax distance, 1 arcsec subtends 0.1 kpc.
2. Data description
2.1. Fornax galaxy members
As outlined in the previous section, the goal of the S+FP is to perform a comprehensive analysis of the Fornax galaxy cluster over more than 200 deg2, using homogeneous data taken through the 12 optical filters of S-PLUS. In its first stage, the S+FP consists of 106 S-PLUS contiguous fields around NGC 1399, all of them observed in the S-PLUS Main Survey (for more details in the different subsurveys of S-PLUS, see Mendes de Oliveira et al. 2019). This set of fields extends out till ∼5Rvir in RA and ∼2.5Rvir in Dec, covering the region 40°≲ RA ≲70°, −38°≲ Dec ≲−28° (see Figure 1 in Paper I), and reaching the outskirts of the cluster where preprocessing is expected to occur.
From the literature, we have compiled a list of 1005 galaxies reported as members of Fornax (see Paper I). Among them, and within the region covered by the S+FP, only 233 objects have radial velocities ranging between 600 and 3000 km s−1, consistent with being spectroscopically confirmed cluster members (Maddox et al. 2019).
2.2. S-PLUS datacubes
We create 12-band datacubes for all galaxies in the literature described in Subsec. 2.1 using the python package S-Cubes1. Given each object's RA and Dec, the code automatically downloads cutout images and their corresponding weight images in all filters from the S-PLUS database2. Then each image is converted to flux and calibrated using the zero-points from S-PLUS Data Release 4 (Herpich et al. 2024), with their corresponding flux errors estimated. The resulting 12 flux and 12 error images are compiled into an output datacube file.
At the distance of the Fornax cluster, the filter configuration of S-PLUS allows the detection of the [O II] and Hα+[N II] emission lines by J0378 and J0660 bands, respectively, as shown in Fig. 1. For this paper, we will focus on the spatial detection of Hα+[N II], in order to be able to validate our approach using MUSE data, which does not reach to [O II] wavelength.
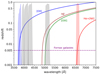 |
Fig. 1. Redshift evolution of the observed wavelength of the [O II], [O III]λ5007, Hα+[N II] and Hβ emission lines. At the distance of the Fornax cluster (indicated by the dashed purple line), we can potentially detect two of these emission lines, [O II] and Hα+[N II], in the narrow-band filters J0378 (blue region) and J0660 (red region), respectively. The shaded gray regions are the remaining narrow-band filters of SPLUS. |
2.3. Fornax3D/MUSE data
The Fornax3D project (F3D, Sarzi et al. 2018) is an IFS survey observed with MUSE (Bacon et al. 2010) attached at the Very Large Telescope of the European Southern Observatory. The sample contains 31 galaxies brighter than mB = 15 within the Rvir (∼2 deg) of the Fornax cluster. The observation dates are between July 2016 and December 2017. The FOV is 1×1 arcmin with a pixscale of 0.2 arcsec. The spectral wavelength range goes from 4650 to 9300 Å with a sampling of 1.25 Å pixel−1. Extended emission-line gas was detected in 13 of those objects (Iodice et al. 2019b), with most of them being late-type galaxies. The Hα map obtained using these data will be used to validate our technique and to detect the limit associated to our photometric emission line estimates.
3. Pixel-to-pixel emission-line estimate
Analyzing emission lines using images involves several intermediate procedures in image processing. For such, we developed a code named Pixel-to-pixel Emission Line Estimate (PELE). This script integrates the S-Cubes program, which creates S-PLUS datacubes, given the RA, Dec and the size for the images in pixels. The process then generates star and galaxy masks, requiring the user to review intermediate mask images to ensure that critical features, like H II regions within the primary galaxy, are not incorrectly masked. The masking process employs photutils.detection.StarFinder on an image from the r-band filter to identify foreground stars and background objects. To apply this function, we first obtain a rough estimate of the image's background mean using a sigma clipping function with a 3 sigma threshold to exclude extreme pixel values. This initial background estimation is followed by an interactive validation step, in which saturated stars and other spurious sources are manually added. A segmentation map is also used to enhance the masking of diffraction spikes from saturated stars. For most galaxies in our sample, the main object mask is based on the 24 mag arcsec−2 isophote in the r-band (Thainá-Batista et al. 2025). Note that this initial background estimate is used solely for the purpose of creating the mask and does not modify the original image data.
Once all sources are masked, the remaining pixels are considered background. To refine the background estimation, we apply a sigma-clipping routine that removes pixel values lying beyond 3 sigma from the mean of the distribution. After five iterations, we compute the mean of the remaining pixels, which is then subtracted from the original image to obtain the background-corrected version. The following tasks are the application of the Butterworth spatial filter (e.g., Menezes et al. 2014) to remove high spatial-frequency noise, point spread function (PSF) homogenization, and Voronoi binning (Cappellari & Copin 2003). These last two steps ensure that the emission signal detection is not affected by any PSF differences between the different filters and that each bin meets a minimum signal-to-noise ratio (S/N). As the process of Voronoi binning can be very time-consuming, for images larger than 300 pixels (165″) a rebinning is performed, changing the pixel scale from the original 0.55″ to 1.1″. For our purpose, the selected Voronoi target S/N is 10 in the filter J0660. The binning threshold was optimized to balance processing efficiency and spatial resolution. Specifically, it was selected to minimize computation time for large galaxies while preserving sufficient spatial sampling in the binned regions of smaller galaxies. Subsequently, we estimate the emission line flux using a combination of images following the three-filter method. A schematic summary of the analysis is presented in Fig. 2.
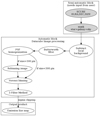 |
Fig. 2. Workflow associated with the PELE code. The input information is a list of galaxies with ID, RA, Dec, and size of the images, followed by the creation of masks, in which the user can check the objects to be masked and labeled as stars and main galaxy. Then the code automatically performs the image processing, including PSF homogenization, Butterworth filtering, binning functions, and the three-filter method. Prior to generating the final emission-line map, sigma clipping is applied to remove outliers that are overestimated, as discussed in Sect. 3.2. |
3.1. Three-filter method
This approach estimates the contribution of the emission line (EL) fluxes within a given narrow band filter (NB) by analyzing its contrast to the continuum. This methodology assumes that the EL can be approximated by a Dirac delta function centered on the emission line wavelength λEL, and the object continuum is well represented by a linear function over the three filters of interest, described below. A complete discussion can be found in Pascual et al. (2007).
Considering the S-PLUS filter system and our target EL, Hα+[N II], we included in our analysis the NB that contains the EL (J0660), the broad-band that overlaps with the NB (r), and a second broad-band that is the closest possible to the NB wavelength range, for further assessment of the continuum (i). Based on these observational fluxes Fobs, the photometric flux of the EL can be derived by the following equation presented in Vilella-Rojo et al. (2015),
![Mathematical equation: $$ F^\mathrm {photo}_{\mathrm {H}\alpha +[\mathrm {N}\,\mathrm {II}]} = \frac {\left (F^\mathrm {obs}_{r} - F^\mathrm {obs}_{i}\right ) - \left (\frac {\alpha _\mathrm {r} - \alpha _\mathrm {i}}{\alpha _\mathrm {J0660}-\alpha _\mathrm {i}}\right ) \left (F^\mathrm {obs}_\mathrm {J0660}-F^\mathrm {obs}_\mathrm {i}\right )}{\beta _{J0660} \left (\frac {\alpha _{i}-\alpha _{r}}{\alpha _{J0660}-\alpha _{i}}\right )+ \beta _{r}} $$](/articles/aa/full_html/2025/07/aa54159-25/aa54159-25-eq1.gif) (1)
(1)
with
 (2)
(2)
 (3)
(3)
where Tband is the transmission curve for a given band (J0660, r or i), and λEL is the wavelength of the emission line we want to measure. We assume that Hα+[N II] flux contribution primarily stems from the Hα line, hence our estimates are obtained at λEL=λHα,0 (1+zEL), where λHα,0 = 6562.8 Å is the rest-frame wavelength of Hα, and zEL = 0.0048, which is the mean redshift of the cluster (Maddox et al. 2019).
As the internal dust and [N II] corrections presented in Vilella-Rojo et al. (2015) are only valid within star formation regions, we chose not to apply them in the present paper. The main reason is that we cannot guarantee the origin of the Hα emission is only due to star formation. Indeed, some of our emitters are known AGN sources with X-ray measurements (e.g., Hou et al. 2024).
It is important to note that the origin of Hα emission can vary, including star formation activity, the presence of an AGN, and from old stars. Notably, the diffuse ionized gas (DIG) is known to contribute up to 60% of the total Hα flux in local spiral galaxies (e.g., Kreckel et al. 2016; Chevance et al. 2020). Since we are not providing pure Hα fluxes or their equivalent widths, this type of discrimination is not feasible. In forthcoming papers, we will incorporate corrections for internal dust attenuation and [N II] contamination, allowing for a better understanding of the emission sources.
After setting up PELE, the next step is to assess how efficient our detection of Hα+[N II] flux is. Indeed, we expect our detection to be limited when compared to spectroscopic measurements, due to both the technique and the depth of S-PLUS images. As presented in the Figure 6 of Smith Castelli et al. (2024), the depth of S-PLUS images varies significantly across different fields (up to 1 mag). However, Table 2 of Herpich et al. (2024) reports that the depth of r, J0660 and i filters (at S/N > 3) are 21.18, 20.98 and 20.79, respectively. These variations in depth introduce additional complexity to the analysis.
3.2. Validation of the code
A preliminary evaluation of PELE was presented in Thainá-Batista et al. (2023), comparing its results with those obtained from spectral energy distribution fitting using the AlSTAR code. The study found a strong agreement between both methods. Here, we further assess the effectiveness of our approach using 13 galaxies from MUSE data obtained in the context of the F3D project (see Subsection 2.3). The input Hα maps are the same as those presented in Iodice et al. (2019b)3. For a proper comparison, we aligned and degraded the MUSE images to match the observations of S-PLUS (i.e., pixscale and PSF matching). Fig. 3 shows two examples of the maps derived with PELE and their corresponding MUSE maps for the galaxies FCC 263 and FCC 312, along with a composite image g, r, and z bands from the Legacy Survey. Since we are comparing Hα maps with Hα+[N II] maps, we expect a general overestimation of our fluxes relative to MUSE due to the contribution of the [N II] line. Indeed, by visual inspection, we observe a systematic overestimation of flux in the outskirts of the galaxies, where the values based on MUSE data are lower.
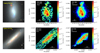 |
Fig. 3. Comparison of the Hα+[N II] maps derived from S-PLUS data with the Hα maps obtained from F3D/MUSE for FCC 263 (top) and FCC 312 (bottom). The left panels display the Legacy Survey images (a combination of g, r, and z bands) at the same scale as the Hα+[N II] maps from S-PLUS (middle panels) and MUSE (right panels). The contours are based on the MUSE Hα map, corresponding to isophotes of 1×10⁻¹⁸ (blue), 1×10⁻¹⁷ (green) and 1×10⁻¹⁶ (magenta) erg s−1 cm−2. No internal dust correction was applied to any map. |
With the purpose of obtaining a deep understanding of our results, we perform a pixel-by-pixel analysis of the maps generated by PELE and MUSE. As we have the same number of pixels in both PELE and MUSE, we can directly compare the maps, as shown in Fig. 4. We find that our method tends to overestimate fluxes below a specific threshold. Therefore, such detections are unreliable. After performing a 3σ clipping, we are able to remove the overestimation. We extended this analysis to all 13 galaxies and consistently found comparable detection thresholds. Consequently, we confirm that our procedure can reliably detect fluxes down to approximately 2×10⁻¹⁷ erg s−1 cm−2. As lower values are usually found on the outskirts of galaxies, as shown in Fig. 3. This indicates that accessing and studying the peripheral areas of galaxies presents significant challenges.
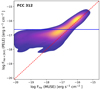 |
Fig. 4. Example of a pixel-by-pixel analysis of the Hα+[N II] flux derived from S-PLUS images using PELE and the Hα flux observed with MUSE for FCC 312. The lighter color (yellow) indicates a higher number of pixels, while the darker shade (purple) represents lower data density. The dashed red line is the 1-to-1 relation. The linear correlation diverges at ∼2×10⁻¹⁷ erg s−1 cm−2, marked by the solid blue line. |
4. Hα+[N II] emitters in Fornax
From the literature sample outlined in Subsection 2.1, we have identified 77 Hα+[N II] emitters with sufficient spatial resolution to generate emission line maps. Of these, only two (ESO 358-11 and ESO 359-25) lack spectroscopic confirmation of membership. Figs. A.1–A.4 show the maps derived with PELE and composite image g, r, and z bands from the Legacy Survey for the entire sample.
Additionally, compare to the Hα emitter catalog provided by Drinkwater et al. (2001), our method successfully recovers 78% of galaxies. Several of the missed objects are dwarf and/or elliptical galaxies with reported EW(Hα)≲5 Å. We then cross-matched our sample with the spectroscopic study conducted by Loubser et al. (2024), which analyzed 10 galaxies within the Fornax A group. We successfully obtained Hα+[N II] maps for all except for one, FCC 46, which has an EW(Hα) < 1 Å. In conclusion, PELE is particularly effective at identifying concentrated emissions, whether located centrally or in H II regions. However, capturing more diffuse, extended features is less consistent and depends on both flux levels and equivalent width.
4.1. Optical morphology
Analyzing the morphologies of these emitters is insightful for understanding their role in the evolutionary path of the cluster and also in the context of galaxy evolution. For such, we use images from the DESI Legacy Imaging Surveys (hereafter, Legacy)4, which are deeper than those from S-PLUS, reaching a median 5σ detection limit for galaxies at r∼23.4 AB mag (Dey et al. 2019). This survey is well-suited for morphological studies, as it allows for the detection of fainter and more extended features. Although FDS provides much deeper imaging than Legacy in the Fornax region, it does not encompass all 77 galaxies in our sample. Indeed, ∼32% of our selected objects are presented in previous papers from FDS. Therefore, to ensure a homogeneous morphological analysis across the entire dataset, we opted to use the Legacy images.
For the initial analysis, we begin with a basic visual inspection to distinguish between early- and late-type galaxies. Early-type galaxies (hereafter ETG), including ellipticals and lenticulars, are characterized by a smooth light distribution with no distinct features. In contrast, late-type galaxies (hereafter, LTG), such as spirals and irregulars, display visible spiral arms or multiple knots. Fig. 5 presents examples of both classifications. Among our detected emitters, 58 (75%) are LTG, while 19 (25%) are ETG.
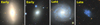 |
Fig. 5. Examples of galaxies classified as early and late type using images from the DESI Legacy Imaging Surveys. From left to right, the galaxies shown are NGC 1380, FCC 90, NGC 1310, and FCC 9. |
The next step is to assess whether these galaxies display any unique features, such as being part of a merger system or showing signs of disturbance. To do so, we employ the ASTROMORPHLIB code (Hernandez-Jimenez & Krabbe 2022), which conducts a non-parametric morphological analysis on the g-band images of the DESI Legacy Imaging Surveys. This code follows several steps: it calculates a 2D sky background model, masks foreground stars, creates a segmentation map, and executes the STATMORPH Python package (Rodriguez-Gomez et al. 2019). In the final phase, it fits a 2D Sérsic model to the galaxy's disk component and computes non-parametric metrics, including concentration (C), asymmetry (A), the Gini index, and the second moment of the galaxy's brightest regions (M20). In a forthcoming paper, the complete list of confirmed members of the Fornax cluster will have their morphology analyzed (Hernandez-Jimenez et al., in prep.).
In the literature, these parameters have been widely employed as key indicators of galaxy morphology. For instance, Conselice (2003) demonstrated that the concentration–asymmetry–smoothness (CAS) system correlates with critical phases of galaxy evolution. The study revealed a strong correlation between the Hα equivalent width and the clumpiness parameter, with star-forming galaxies displaying star-forming regions in distinct clumps. This underscores the parameter's effectiveness in tracing ongoing or recent star formation activity. Additionally, Lotz et al. (2004, 2008) combined the Gini index and M20 to classify galaxies into three groups: E/S0/Sa, Sb-Ir, and mergers. More recently, Krabbe et al. (2024) introduced the C−A diagram as a diagnostic tool to distinguish galaxies with disturbed features, possibly undergoing ram pressure stripping or tidal interactions.
Here we employ the classifications from Krabbe et al. (2024) and Lotz et al. (2008) to identify possibly perturbed and merger galaxies within our sample, as shown in Fig. 6. Out of the 77 Hα+[N II] emitters, we found that 29 (38%) display one or both designations, with 62% categorized as unperturbed objects. Among those classified as presenting any type of disturbance, 7 (24%) are seen as perturbed, 8 (28%) as mergers, and 14 (48%) exhibit both characteristics. From the 19 ETG analyzed, 1 (5%) is perturbed, 1 (5%) is merger, 1 (5%) displays both traits, and 16 (85%) are undisturbed. For the 58 LTG, 6 (10%) are perturbed, 7 (12%) are mergers, 13 (22%) exhibit both features, and 32 (56%) are labeled as unperturbed. This means that 15% of the early-type emitters display evidence of perturbation and/or merging, whereas the same occurs for 44% of the late-type emitters.
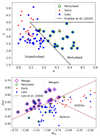 |
Fig. 6. Concentration versus asymmetry diagram (top panel) and Gini versus M20 diagram (bottom panel) for 77 Hα+[N II] emitters in the Fornax cluster. The solid black line in the top panel delineates the morphological transition zone boundaries, where the disturbed galaxies lie, given by C=−9.5A+4.85 and C<4 (Krabbe et al. 2024). The solid brown lines in the bottom panel are defined by Lotz et al. (2008). The galaxies belonging to merger systems are shown as open magenta diamonds and the perturbed ones with open green circles. |
4.2. Spatial distribution
Fig. 7 illustrates the spatial distribution of the 77 identified emitters, highlighting the previously discussed morphological classifications (top left) and the variation in radial velocity of the galaxy relative to the cluster's mean velocity Vcluster = 1442 km s−1 and velocity dispersion σcluster = 318 km s−1 (Maddox et al. 2019). Additionally, the figure includes a detailed view of the central cluster region (bottom right) and the area encompassing its infalling Fornax A group (bottom left). ETG emitters are predominantly concentrated in the north-west region of the cluster, while LTG ones appear more evenly distributed (top left panel). It is noteworthy that the most confirmed Fornax cluster members are concentrated in the northern region of the cluster, as shown in the right top panel. Since these objects serve as the basis for our analysis, there is a naturally lower number of emitters in the southern region, except for those associated with Fornax A.
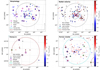 |
Fig. 7. Spatial distribution of the Fornax members around NGC 1399 (cyan star). The distribution is color-coded by radial velocity, Vgal, of each galaxy relative to the cluster's mean velocity, Vcluster = 1442 km s−1, and normalized by its velocity dispersion, σcluster = 318 km s−1 (Maddox et al. 2019) (top right panel) and morphological features for 77 Hα+[N II] emitters detected by PELE (top left panel). The bottom left provides a close-up view of the spatial distribution of 15 galaxies within the Fornax A group, while the bottom right panel focuses on the region within 1Rvir around the cluster center; both plots use the same symbol conventions. Only galaxies with detected emission are included in the morphological analysis described in Sect. 4.1. LTGs are depicted as squares, whereas ETGs are shown as triangles. Galaxies identified as perturbed are marked with open green circles, and mergers are denoted by open magenta diamonds. The solid cyan and brown lines represent the Rvir of the Fornax cluster and the Fornax A group, respectively, while the dashed black line indicates 3 Rvir. The black square and triangle in the top right panel correspond to two galaxies without known radial velocities but with detected Hα+[N II] emission. |
The top left (morphology) panel highlights another trend, showing a higher concentration of emission-line galaxies with additional features (classified as perturbed, merger, or both) predominantly located on the eastern side of the cluster. This trend is especially prominent within 1Rvir of NGC 1399. Notably, LEDA 707430, LEDA 655120 and FCC B2144, early-type emitters, are identified as perturbed and/or merger candidates and are positioned between 1Rvir and 3Rvir in the north. The not perturbed/merged early-type emitters are primarily distributed in the northwestern region within 3Rvir. In contrast, LTG emitters with single classifications or without any special feature appear more dispersed across the field, without any discernible spatial pattern. Beyond 3Rvir, only emitters displaying late-type morphologies are found.
In the top right (radial velocity) panel, general patterns can be observed in the emitters following the variations in their radial velocity relative to the cluster, ΔV/σ=(Vgalaxy−Vcluster)/σcluster. A velocity gradient is observed, increasing from east to west within the emitter sample. On the eastern side of the cluster, many galaxies exhibit comparable ΔV/σ values (shown in blue) extending from the cluster's interior to distances beyond 3Rvir. On the western side, several galaxies displaying similar ΔV/σ values (shown in red) encompassing most of the galaxies in the Fornax A group. Within 3Rvir, a southeast-to-northwest gradient is evident, marked by an different in the number of objects and their velocities. A similar result was obtained by Waugh et al. (2002) for 110 galaxies within an area of ∼620 deg2 and a H I mass limit of 1.4×10⁸ M⊙ using H I Parkes All Sky Survey (HIPASS) observations.
A closer examination of the Fornax A group (bottom left panel) and the cluster center (bottom right panel) provides a clearer comparison of the galaxies in both regions. This analysis is valuable for understanding the differences in galaxy behavior between a more virialized environment and a region where preprocessing is still occurring. The number of emitters around NGC 1316 extending to 1.05 deg (Fornax A Rvir) is 11 – about half the number found within 1Rvir of NGC 1399, which totals 20. This difference in the quantity of detections coincidentally scales with the size disparity between the two regions. However, when considering the objects with known radial velocities (233 in total), we observe a higher relative percentage of emitters within Fornax A, 73% (11 out of 15), compared to only 19% (20 out of 107) in the Fornax cluster. Unfortunately, the spectroscopic sampling of the Fornax cluster and the Fornax A group is not complete, so we cannot infer much more from these results.
4.3. Projected phase space diagrams
When a field galaxy enters a cluster or group, it takes time for the denser environment to influence its properties. Different studies suggest that quenching processes driven by the environment occur over several gigayears (e.g., De Lucia et al. 2012; Wetzel et al. 2013; Hirschmann et al. 2014; Oman & Hudson 2016). However, measuring local environmental density alone may not fully capture galaxy evolution, as properties also depend on how long a galaxy has been in its current environment. Some galaxies may still reflect the characteristics of their previous environment, especially in regions of rapid growth with many recent infallers. Understanding the effect of infall time (tinfall) would provide valuable insights into environmental influences on galaxy evolution.
Assuming a Λ cold dark matter cosmology, the infalling substructures have eccentric, descending orbits (Gill et al. 2005; Wetzel 2011). As a result, at any given radius, there is a broad range of infall times due to the mixture of objects entering the cluster for the first time and those that have been orbiting for several gigayears. However, incorporating both distance and velocity in phase-space diagrams reveals that recent infallers generally exhibit higher velocities, allowing for more accurate estimates of their infall times. In fact, Rhee et al. (2017) demonstrated that using velocities and distances in the projected phase-space (PPS) diagram helps separate populations with different infall times more clearly.
Recent studies have increasingly highlighted the connection between a galaxy's phase-space position and its star formation activity and stellar mass buildup (e.g., Mahajan et al. 2011; Muzzin et al. 2014; Hernández-Fernández et al. 2014; Pasquali et al. 2019; Sampaio et al. 2024; Romero-Gómez et al. 2024). These findings enhance our understanding of the morphology-density relation (Dressler 1980) and provide insights into how the environment shapes galaxy evolution within clusters. In this subsection, we apply the phase-space analysis of our emitter sample, combining this with its morphological results to infer the assembly history of Fornax cluster.
Assuming the cluster's mean velocity Vcluster = 1442 km s−1 and velocity dispersion σcluster = 318 km s−1 (Maddox et al. 2019) as reference, we constructed the PPS diagram for our sample of emitters, as presented in Fig. 8. Following the division proposed by Rhee et al. (2017), the PPS can be split up into five regions ranging from ancient infallers (tinfall<8 Gyr) to recent ones (tinfall<1 Gyr). We find that 91% of the Hα+[N II] emitters are located in regions (A, B and C) indicative of recent infall into the cluster. Of these, ∼77% are LTG, with 40% showing signs of perturbation or merger activity. The interaction between these infalling galaxies and the intracluster medium or nearby cluster galaxies may have triggered star formation, causing the observed Hα+[N II] emission associated with disturbed optical morphologies. Among the 23% of ETG in the recent infall regions, only three show evidence of disturbance or merger features.
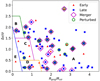 |
Fig. 8. Projected phase space diagram of the 77 Hα+[N II] emitters found using PELE. Rhee et al. (2017) defined different areas separated by solid lines; E is dominated by ancient infallers (tinfall>8 Gyr), D contains a mixed population with tinfall<4−7 Gyr, and regions A, B, and C correspond to galaxies that have fallen into the cluster less than 1 Gyr ago (recent infallers). |
The only emitter located in the regime of ancient infallers (region E in Fig. 8) is the early-type galaxy NGC 1387. In the intermediate infaller regime (region D), which corresponds to galaxies that entered the cluster between 4 and 8 Gyr ago, six galaxies are found: FCC 32, FCC 119, FCC 113, NGC 1436, NGC 1437B, and NGC 1351A. The first two are ETG, and the last four are LTG, with two presenting perturbed and/or merger classification.
Fig. 8 may differ from other PPS diagrams in the literature due to variations in the reference cluster mean velocity and velocity dispersion. As an example, Iodice et al. (2019b) adopts a line-of-sight radial velocity of Vrad = 1425 km s−1 for the brightest cluster galaxy, NGC 1399, and a cluster velocity dispersion of σcluster = 300 km s−1, as reported by Drinkwater et al. (2001), instead of the values derived by Maddox et al. (2019) based on the distribution of galaxies. Such differences in the chosen parameters can cause some galaxies to shift their positions within the PPS diagram. For instance, while NGC 1380 is classified as an ancient infaller (region E) in Iodice et al. (2019b), its location in Fig. 8 is the region C, near the boundary with region E. All other galaxies common to both studies occupy consistent locations.
This study expands the analysis of recent infallers in the outskirts of the Fornax cluster, identifying emission line galaxies at clustercentric distances out to 4Rvir.
4.4. Color magnitude relation and stellar mass
We used the catalog available in the S+FP collaboration (see Smith Castelli et al. 2024, for more details) to retrieve the location in the color magnitude diagram and the stellar mass of our working sample. The magnitude definition is AUTO, which is based on an estimate of the total flux given by the integration pixel values within an adaptively scale aperture (automatic radius derived from Kron's first moment; Kron 1980). These data were designed to properly recover the photometry of the larger galaxies of Fornax (Haack et al. 2024).
Fig. 9 shows the color-magnitude diagram for all spectroscopic members of the cluster. The brightest galaxy presented here is the central galaxy of Fornax A group, NGC 1316. We exclude NGC 1532 from this analysis as it is not fully captured in the images, making its magnitudes unreliable. The errors become relevant at r>16 mag. The majority (72%) of the emitters are located below the red sequence. However, it is noticeable that 90% of the disturbed emitters are found in the blue cloud and the green valley, whereas the red sequence is almost exclusively followed by unperturbed emitters. According to the HyperLeda database (Makarov et al. 2014)5, the few LTG with red color comparable to ELG are all galaxies with identified bars (NGC 1350, NGC 1436, NGC 1317, NGC 1386, NGC 1326, FCC 315).
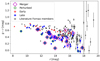 |
Fig. 9. Color magnitude relation for Fornax members, with the emitters highlighted according to their respective morphologies, as described in the legend. The dashed black line represents the magnitude limit of our sample. |
We derive the stellar mass from the average (g−i) color, using the empirical relation introduced in Taylor et al. (2011)6,
 (4)
(4)
where Mi is the absolute magnitude in the i-band. In Fig. 10, the upper panel shows a general descending gradient in the color (g−r) for ETG with the clustercentric distance, with a bump of redder galaxies at the projected distance of Fornax A. In comparison with the findings of Iodice et al. (2019a), who found that the average (g−r) color of bright ETG (mB<15) within 1Rvir of Fornax tends to decrease with increasing distance from cluster center, our sample of ETG emitters extends this trend out to 4Rvir. However, the majority of our ETG emitters exhibit (g−r)>0.4, which is redder than the ETGs discussed in Iodice et al. (2019a) within 0.4Rvir and 1Rvir. This suggests that the presence of emission does not necessarily lead to shift the overall (g−r) color of ETGs toward bluer values. In the bottom panel, we observe a broad range of stellar masses for galaxies located within projected distances (Rproj) of less than 2.5 Rvir. However, beyond this distance, the sample predominantly consists of low-mass galaxies (< 109 M⊙). Fornax A galaxies are distributed at 1.5<Rproj/Rvir<2.1.
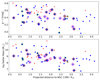 |
Fig. 10. Color (g−r) and stellar mass as function of projected distance from NGC 1399 for Hα+[N II] emitters. The galaxy with a higher stellar mass located at ∼1.8Rvir is the central galaxy of the group Fornax A. LTGs are represented as squares, whereas ETGs are denoted as triangles. Galaxies identified as perturbed are shown with open green circles, and mergers are marked by open magenta diamonds. |
Combining the mass distribution with the PPS diagram and spatial data reveals that at projected distances beyond 2.5 Rvir from the cluster center, Hα+[N II] emission line galaxies are predominantly recent infallers. These galaxies tend to be low-mass, blue, and late-type in nature, and those showing evidence of mergers and/or perturbations are preferentially located in the blue cloud and the green valley.
4.5. Comparison with radio results
In this subsection, we examine our findings on Hα+[N II] emission morphology in the context of previous studies that include radio data. The main categories for the emission classification include knots, extended structures, and centrally concentrated regions. This is based on visual inspection, and the categorization is done on the identification of the most prominent or defining characteristics. In some cases, knot structures may exhibit central concentrations, while extended emissions can also include distinct emission knots. We eventually will mention an offset concentration to account for a subset of galaxies that display an emission nucleus or dominating giant H II region displaced from their center. All the maps discussed are included in Appendix A, with Table A.1 presenting their main properties.
4.5.1. Fornax cluster
Inside 1Rvir around NGC 1399, we have 20 Hα+[N II] maps generated by PELE with 80% LTG and 20% ETG. Among the early-types, NGC 1387 and NGC 1380 exhibit centrally concentrated emission with no signs of perturbation or mergers in the optical images. Both are located near the cluster center. NGC 1386 is a recent infaller with extended emission with a distinct central peak. The irregular galaxies FCC B905 and FCC 302 exhibit a prominent offset knot. Seven galaxies–NGC 1427A, FCC 115, FCC 113, FCC 306, NGC 1437A, FCC 299, and FCC 267–show emission concentrated in knots. The remaining eight – FCC 90, FCC 263, FCC 282, FCC 312, NGC 1351A, NGC 1365, NGC 1436, and NGC 1437B – exhibit extended emission. Typically, ETG display centrally concentrated or extended emission without distinct knots, whereas irregulars often feature large, offset emission knots, and spirals show extended or knot-like emission along their arms.
Following results from Loni et al. (2021) we correlated emission data with cold gas morphology. They first conducted a blind H I survey using ATCA around NGC 1399, covering a region extending to approximately 1Rvir. This survey has a spatial resolution of ∼6×9 kpc at the Fornax cluster distance and a 3σ sensitivity in H I mass of ∼2×10⁷ M⊙. These authors detected 16 H I sources, which avoided the central cluster region in both sky distribution and projected phase-space (PPS) analysis, with several showing disturbed H I morphologies, particularly among LTG. These findings align with results from the F3D data (e.g., Iodice et al. 2019b), which indicates that these galaxies are actively forming stars and are located in the cluster's low-density regions, where X-ray emission is faint or absent. Similarly, our sample of Hα+[N II] emitters predominantly consists of recent infallers positioned farther from the cluster center, with many displaying disturbed or merger-like features in optical images. This suggests that several galaxies have recently entered the cluster and are experiencing interactions with other galaxies or the intergalactic medium. Since our selected emitters extend to distances beyond 1Rvir, we observe several galaxies with disturbed classifications but without available H I maps. Obtaining H I measurements for these outskirts objects in the future would be valuable, as their H I morphology could help determine whether these galaxies are already experiencing cluster-induced effects at such distances.
Additionally, Loni et al. (2021) analyzes the ratio of molecular to atomic gas mass as an indicator of environmental influence on galaxies. For instance, galaxies exhibiting disturbed H I but regular H2 suggest that only the atomic gas is impacted by the dense environment. Using the H2 masses derived by the conversion from CO given by Zabel et al. (2019), they found that the fast process of H I removal can be seen in the large scatter in the H2-to-H I mass ratio and in the high number of H I-undetected but H2-detected star-forming galaxies. Comparing our sample with the list of objects analyzed by Loni et al. (2021) and Zabel et al. (2019), we have 5 galaxies that overlap only with the first and 4 with the second, plus 7 objects that are common to all three studies. A summary of the gas morphology for these galaxies is shown in Table 1.
Gas morphology for galaxies around NGC 1399 reaching 1Rvir.
Three galaxies for which we possess Hα+[N II] maps and CO emission data (indicating the presence of H2) but lack H I detection are early-type systems, NGC 1387, NGC 1380 and FCC 282, while NGC 1386 is a late-type. The first two galaxies exhibit centrally concentrated emission accompanied by regular CO profiles. They are in the high-density region of the cluster (<0.4Rvir, e.g., Iodice et al. 2019a), within the area of detected X-ray emission (e.g., Frank et al. 2013). NGC 1386 and FCC 282 display extended emission, with the latter showing evidence of disturbed CO distribution. Both galaxies are recent infallers.
From our sample, four objects (FCC 306, FCC 113, FCC 115, and NGC 1437A) exhibit H I deficiency and display either extended structures or emission knots in their Hα+[N II] maps. NGC 1427A shows disturbed H I morphology, accompanied by asymmetric emission line knots and perturbed optical features. NGC 1437A has a truncated H I disk, characterized by Hα+[N II] emission knots and a disrupted optical structure.
FCC 90 and NGC 1437B are H I deficient with disturbed H I and CO profiles, and display extended emission. NGC 1365, FCC 312, and NGC 1351A present disturbed H I distributions but maintain regular CO profiles, with Hα+[N II] emission showing both extended regions and knots. FCC 263 is H I deficient, exhibits disturbed CO, and shows extended Hα+[N II] emission. NGC 1436 also displays H I deficiency with a truncated H I disk, regular CO, and emission appearing in knots.
4.5.2. Fornax A group
The Fornax A group is an ideal target for studying preprocessing effects on galaxies, as it is currently infalling toward the Fornax cluster. This group, rich in gas, predominantly consists of LTG. We obtained Hα+[N II] maps for 11 galaxies within Rvir of Fornax A centered around NGC 1316. From this sample, 9 sources were matched with neutral hydrogen detections from Meerkat observations presented in Kleiner et al. (2021). Based on the author's classification of preprocessing stages, which uses H I morphology along with H2 and CO measurements (Zabel et al. 2019; Morokuma-Matsui et al. 2019, 2022), the galaxies are separated in three categories:
-
Early: H I-rich with extended H I disks, H2-to-H I ratios lower than the median for their stellar mass (NGC 1326A, NGC 1326B);
-
Ongoing: H I tails and truncated H I disks, with typical H2-to-H I ratios (FCC 28, FCC 35, NGC 1310, NGC 1316, NGC 1326);
-
Advanced: H I deficient with no H I outer disk, H2-to-H I ratios higher than the median for their stellar mass (NGC 1316C, NGC 1317).
The galaxies NGC 1326A and NGC 1326B, categorized as being in the early stages of preprocessing present prominent knots in their emission line maps. Although they may appear to form an interacting pair due to their proximity in projection in the sky, their velocity difference of ∼832 km s−1 indicates they are not a close interacting system (Rosa et al. 2018). This distinction was also addressed by Raj et al. (2020), who noted that the two galaxies occupy different positions in the phase-space diagram of Fornax A, with NGC 1326A classified as an intermediate infaller and NGC 1326B as a recent infaller to the group (see Figure 7 therein).
The galaxies in advanced preprocessing, NGC 1316C and NGC 1317, present extended emission line maps. As can be seen in the panel located at the fourth line of the second column in Fig. A.4, NGC 1317 has a ring of emission located around the center of the galaxy. No emission was detected in the disk, which coincides with the lack of an H I disk in these galaxies.
The list of galaxies undergoing active preprocessing include several fascinating objects. Among them is FCC 28, which exhibits asymmetrically distributed emission knots, almost forming a ring-like structure. Two sources, NGC 1316 and NGC 1326, are classified as AGNs based on X-ray detections (e.g., Maccagni et al. 2020; Hou et al. 2024). NGC 1326 displays centrally concentrated emission with a few knots in its outer regions, while NGC 1316 features central emission accompanied by extended structures reminiscent of X-ray lobes, albeit on a smaller scale. NGC 1310 presents a more organized extended emission pattern, with knots aligning along its spiral arms. Lastly, FCC 35 exhibits distinctly extended emission.
4.6. Beyond Rvir and assembly history of the Fornax cluster
Forty eight of our emitters are galaxies distributed beyond 1Rvir of the Fornax cluster, but not belonging to the Fornax A group. From these objects, we find an extended emission in 24 (58%) extended, knots in 20 (42%), and 4 (6%) with central concentration. They are mostly LTG (73%) and 40% present at least one sign of perturbations and/or merger.
Studies such as F3D (e.g., Iodice et al. 2019b) and FDS (e.g., Iodice et al. 2019a; Spavone et al. 2020), that examine bright (mB≤15 mag) galaxies within the virial radius of the Fornax system have identified three main groups with galaxies with similar properties: the core, the north-south (N-S) clump and the infalling galaxies, which are added to the southwest Fornax A group centered on NGC 1316. The core is dominated by the massive luminous NGC 1399, which coincides with the X-ray emission detection (e.g., Frank et al. 2013). Still inside the X-ray halo, there is a high density region until 0.4Rvir, where the N-S clump is found. The galaxies located at the clump on the north-northwest side of the cluster are redder, fast rotators, and metal-rich. The third group is composed of intermediate and recent infallers positioned in an approximately symmetrical pattern around the core within the low-density region (0.4 < Rproj <1). These galaxies are predominantly late-type, exhibiting ongoing star formation and evidence of structural transformations. For instance, FCC 263 displays disturbed ionized gas (see Fig. 3), which is likely driven by environmental interactions or merger events.
Our results agree with previous findings with a low number of emitters being detected in the N-S clump. Agreeing with the conclusion that the star formation in these galaxies stopped earlier than for those that entered later into the cluster potential (Iodice et al. 2019b). As our focus is on Hα+[N II] emitters, the patterns seen in galaxies without signs of star formation or AGN activity, particularly ETG within Rproj<0.4Rvir, are not reproduced here. For instance, within 1Rvir, we successfully mapped Hα+[N II] emission in three ETG, NGC 1387 and NGC 1380, both situated in the high density core of the cluster, and FCC 90, located in the low density region. None of these objects present any disturbance or merger feature, agreeing with previous results from ETG (Spavone et al. 2020). Indeed, only three ETG presented indications of perturbed or merger features, and they are located at projected distances larger than 2Rvir.
We also expand the previous analysis to emission line galaxies located in regions outside the virial radius and r<18. We found the majority of emitters in the low density region of Fornax. A high number of emitters are located in the north-northwest side of the cluster between 1Rvir and 3Rvir. These galaxies seem be the ones belonging to the filament that connects the Fornax-Eridanus large scale structure, as suggested by Nasonova et al. (2011). In the west-southwest, the Fornax A group is the main location of the emitters.
In the context of the preprocessing scenario, McGee et al. (2009) found through hydrodynamical simulations that galaxies that were accreted recently into the cluster are more likely to have been in a group and that low-stellar-mass galaxies are effective tracers of the recent mass accretion history of the cluster. Within this framework, the spatial distribution of ETG and LTG presented in this paper traces the assembly history of Fornax. On one hand, most of our ETG emitters are first infallers and exhibit no signs of morphological disturbance. This suggests that these galaxies had already evolved prior to falling into the cluster environment. In fact, the ELG population may have been quenched prior to infall (the time when a galaxy enters for the first time the virial volume), as already indicated by Spavone et al. (2020). This interpretation is consistent with results from studies of high-redshift clusters (z≳1), such as those conducted by the Gemini Observations of Galaxies in Rich Early ENvironments (GOGREEN, Balogh et al. 2021) collaboration (see e.g., van der Burg et al. 2020; McNab et al. 2021; Baxter et al. 2022). On the other hand, the LTG population seems to be tracing the more recent mass-assembly from the field, with galaxies coming from different directions, including along filaments, as suggested by their spatial distribution (Figure 7). Evidence of morphological transformation during the cluster assembly process is more apparent among these star-forming systems. Notably, 44% of the late-type emitters show morphological signs of perturbation or merging process. In particular, LTG located at larger cluster-centric distances are low-mass, log(Mstellar)<109 M⊙, which is consistent with the scenario in which low-mass galaxies are more susceptible to environmental effects, such as galaxy-galaxy interactions in groups and filaments. The presence of star-forming, low-mass galaxies with disturbed morphologies at Rproj>2.5Rvir strongly supports a preprocessing scenario, i.e., galaxies start the transform processes prior to their accretion into the main cluster.
4.7. Fornax-like systems in IllustrisTNG-50
Hydrodynamical simulations have proven to be a key tool in understanding the role that the environment plays in galaxy evolution (e.g., Bahé et al. 2013; Wright et al. 2019; Donnari et al. 2021; Pallero et al. 2019, 2022). However, due to the lack of resolution in large cosmological hydrodynamical simulations, studying the evolution of dwarf galaxies in complex systems like Fornax has been a difficult task. To shed light on the matter, we will use the high-resolution box from the IllustrisTNG suite (Marinacci et al. 2018; Nelson et al. 2018; Pillepich et al. 2018; Springel et al. 2018) to look for the distribution of emitters in Fornax-like systems. The simulations from IllustrisTNG, count with a full-physics galaxy formation model, which includes magneto-hydrodynamic physics to model several processes affecting galaxy evolution, such as star formation, chemical enrichment, supernova feedback, AGN feedback, photoionization, etc. From this suite, IllustrisTNG-50 has the smallest volume (51.63 cMpc) and the highest resolution with a baryonic particle mass of 8.5×10⁴ M⊙ and dark matter of 4.5×10⁵ M⊙ (Nelson et al. 2019; Pillepich et al. 2019). This allows us to resolve satellites ∼107 M⋆/M⊙ with >100 stellar particles and ∼1000 dark matter particles. Moreover, despite the simulation's small box size, IllustrisTNG-50 counts with one Fornax-like system with a virial mass M200 = 6.7×10¹³ M⊙ and virial radii R200 of 846 kpc, with 303 satellite galaxies M⋆>107 M⊙ bound to the cluster.
Fig. 11 shows the galaxy distribution of the Fornax-like system and its surroundings up to 3R200 (left panel) and 1R200 (right panel). For visualization and to make a comparison with observations more clear, we split our satellite population into three samples based on its sSFR:
-
Late emitters: Galaxies with high sSFR, considered to be on the main sequence (log10sSFR >10.5)
-
Early emitters: Galaxies with low sSFR, considered below the star formation main sequence (log10sSFR <10.5), but with some emission.
-
Nonemitters: Galaxies with no star formation rate.
Squares (blue), triangles (red), and filled circles (maroon) show the distribution of galaxies bound to the Fornax-like system. The continuous (cyan) and dashed (black) lines correspond to 1 and 3R200, respectively. Gray dots show galaxies that are within 3R200 of the system but are not bound to the cluster, according to a FoF algorithm (Springel et al. 2001; Dolag et al. 2009). Of these 303 galaxies, only 40 galaxies are emitters, being 19 and 21 late- and early-emitters, respectively. Nonetheless, when counting all emitters within 3R200, we found 74 emitters around the Fornax-like system, similar to what we report in this work.
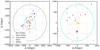 |
Fig. 11. Spatial distribution of simulated galaxies in the Fornax-like system present in IllustrisTNG-50. Left: Distribution of galaxies up to 1R200 (continuous cyan line) and 3R200 (dashed black line). Late, early, and nonemitter galaxies bound to the cluster are shown in squares (blue), triangles (red), and full circles (maroon), respectively. Additionally, gray dots show galaxies within 5R200 of the cluster that are not gravitationally bound to the cluster. Right: Zoom region showing the galaxy distribution within 1R200 of the Fornax-like system. |
To analyze the distribution of the star-forming regions from satellites in our Fornax-like system, we measure, per galaxy, the distance of each star-forming region to the center of the cluster and split the distance between 20 radial bins, normalized by the galaxy size. In each bin, we measure the resolved star-formation efficiency, defined as
 (5)
(5)
where SFRi is the star formation, per radial bin and Mgas,i is the gas mass enclosed in the ith radial bin. Then, we stacked the results for all our emitters as shown in Fig. 12. For visualization purposes, we fixed the x-axis to be from −1 to 1, where −1 is the bin closer to the center of the cluster, and 1 is the bin farthest to the center. The zero value marks the center of each galaxy. The left, middle, and rightmost panels show the distribution of RSFE for late- early and all-emitters, respectively. As can be seen, late-emitters increase their RSFE toward the outskirts of clusters, while early-emitters have this trend reversed. This change in the distribution is related to the dynamical state of early- and late-emitters regarding the cluster. Typically in our sample, late-emitters correspond to galaxies undergoing their first infall, while early-emitters have spent more time within the cluster. This distribution of misaligned RSFE could help us in the future to better constrain the direction of motion of galaxies during their infall into structures and will be further explored in a follow-up paper.
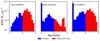 |
Fig. 12. Evidence of misaligned star formation rate for satellite galaxies from the Fornax-like cluster in IllustrisTNG-50. The left, central, and right panels show the resolved star formation efficiency spatial distribution for late, early, and all emitters, respectively. The zero value splits the galaxy into halves, with negative values (between [−1,0); blue bars) being the half of the galaxy that is closer to the cluster's center, and positive values (between (0,1]; red bars), the half of the galaxy that is on the outskirts of the cluster. Late emitters show a clear signal of a higher star formation rate toward the cluster's outskirts, while early emitters show the opposite trend. |
5. Conclusions
In this paper, we present an approach to create Hα+[N II] maps for S-PLUS images by applying the three-filter method in the region of the Fornax cluster. We successfully mapped the Hα+[N II] emission in 77 galaxies within the four virial radius of the Fornax cluster and with r<18 mag, with only two not being confirmed spectroscopic members. Our method reaches a limit of Hα flux ∼2×10⁻¹⁷ erg s−1 cm−2, when compared to IFS results from MUSE/F3D. The main findings of this study are summarized as follows:
-
25% are ETGs (elliptical or lenticular), while 75% are LTGs (spiral or irregular). The ETGs are predominantly concentrated in the northwest region of the cluster, whereas the LTGs are more evenly distributed.
-
The analysis of the morphologies using the ASTROMORPHLIB code applied to DESI Legacy g-band images of the galaxies revealed that about 38% of the Hα+[N II] emitters are experiencing morphological transformation, as determined by considering both the region defined as perturbed in the concentration versus asymmetry diagram from Krabbe et al. (2024) and the merger region in the Gini versus M20 diagram from Lotz et al. (2004), where galaxies that fall within these regions are considered to have disturbed morphologies.
-
Evidence of perturbation and/or merging is observed in 15% of the early-type emitters, while this fraction increases to 44% among late-type emitters.
-
91% of them are recent infallers, with ∼77% being LTGs and 40% showing signs of perturbation or merger activity. In contrast, only two ETGs, located near 3Rvir, show evidence of disturbance or merger features.
-
Only one emitter has entered the cluster at >8 Gyr, NGC 1387. In the intermediate regime, between 4 and 8 Gyr, we have six emitters, two displaying early and four late-type morphologies.
-
Among the emitters, 8% display centrally concentrated emission, 40% exhibit emission in knots, and 52% show extended emission. All galaxies with centrally concentrated emission are unperturbed objects, and the ones with radio data present a regular CO distribution.
-
At the projected distances beyond 2.5Rvir from the cluster center, the Hα+[N II] emitters are predominantly low-mass, blue, late-type recent infallers.
-
On the northwest outskirts of the cluster, a clump of emitters appears to extend the pattern observed in the north-south clump within the Fornax virial radius (Iodice et al. 2019a, b). This distribution suggests that they may be part of a filament feeding into the cluster, potentially linking Fornax to the Eridanus cluster to the north. Further analysis, extending observations toward Eridanus, is needed to confirm this connection.
-
The eastern region of the cluster, although hosting several disturbed galaxies, does not exhibit a distinct substructure.
-
In a Fornax-like system from the IllustrisTNG-50 simulation, we identified 74 emitters within 3R200, closely matching our observational results. The simulated galaxies exhibit a clear trend: ETGs show enhanced star formation toward the cluster center, while LTGs display the opposite behavior. The late-type emitters are typically first-infallers, whereas early-type emitters have resided in the cluster for longer. Future observational studies of such star formation rate misalignments could provide valuable insights into the dynamics of galaxy infall through substructures toward the cluster center.
It is well established that galaxy clusters grow by hierarchical assembling of structures. Therefore the analysis of galaxy properties in the outer regions of the cluster (beyond Rvir) provides valuable insight into the cluster's assembly history and its connection with galaxy evolution. Indeed, our results reflect the assembly history of the Fornax cluster. LTGs appear to trace the recent mass assembly of the cluster from the field, with galaxies infalling from multiple directions (see Figure 7), including a filament in the northwest of the cluster that possibly connects to the Eridanus system; in contrast, ETGs could have already evolved prior to falling into the cluster environment. Additionally, the presence of disturbed, low-mass galaxies beyond 2.5Rvir provides evidence of preprocessing, i.e., these galaxies begin undergoing transformation before entering into the main cluster.
It is important to note that while our photometric approach does not replace IFS spectroscopic analysis, it can be valuable for a broad assessment of a given emission line across larger areas, such as in galaxy clusters and groups. Some limitations of the results presented here will be addressed in forthcoming papers, including the absence of internal dust extinction and [N II] emission corrections, and the assessment of the equivalent width of Hα using S-PLUS filters. For such, we will evaluate current known recipes to correct for internal dust extinction and to remove the [N II] contamination using photometry, and potentially develop new ones. The absence of [N II] correction can lead to an overestimation of the Hα emission flux and, consequently, of the derived star formation rate. Correction factors based on nuclear measurements (e.g., slit spectroscopy) may also underestimate the true Hα flux in star-forming regions, particularly in spiral galaxies (James et al. 2005). Additionally, in cases such as active galactic nuclei, [N II] emission may dominate the narrow-band filter response, further biasing the results.
Several galaxies in our sample are located in the outskirts of the cluster, where no radio data is currently available. Although galaxies within 1Rvir of the Fornax cluster and the Fornax A group are being studied across multiple wavelengths, the outer regions still lack sufficient radio data coverage. The combination of cold and molecular gas is crucial for understanding how the environment impacts and transforms galaxies, providing valuable preprocessing diagnostics and revealing physical processes such as ram-pressure stripping and tidal stripping during interactions with the intracluster medium or other galaxies. Targeting these emitters for future radio observations would be highly beneficial.
Our results confirm that the Fornax cluster is still evolving, with numerous indications of morphological transformations occurring at large clustercentric distances. The distribution of Hα+[N II] emitters suggests a connection to the large-scale Fornax-Eridanus structure, which emphasizes their potential for tracing cosmic filaments and unveiling the underlying structure of the cosmic web.
This study highlights the effectiveness of S-PLUS in detecting and characterizing emission-line features in galaxy clusters, which makes a valuable tool for large-scale investigations of galaxy evolution. The observed trends reinforce the significant influence of environmental factors on star formation history and morphological transformations in galaxies. The methodology and findings presented here can be extended to other clusters, and offer broader insights into the role of cluster environments in galaxy evolution across cosmic scales.
Acknowledgments
We would like to thank the anonymous referee for their suggestions, which significantly helped us improve the paper. A.R.L. and A.V.S.C. acknowledge financial support from Consejo Nacional de Investigaciones Científicas y Técnicas (CONICET) (PIP 1504), Agencia I+D+i (PICT 2019–03299) and Universidad Nacional de La Plata (Argentina). A.C.K thanks Fundação de Amparo à Pesquisa do Estado de São Paulo (FAPESP) for the support grant 2024/05467-9 and the Conselho Nacional de Desenvolvimento Científico e Tecnológico (CNPq). A.R.L. also acknowledges the financial support from Conselho Nacional de Pesquisa (CNPq). J.T.B. acknowledges CAPES 88881.892595/2023-01, FAPESC (CP 48/2021). M.S.C acknowledges support from São Paulo Research Foundation (FAPESP), grant 2023/10774-5. D.P. acknowledges financial support from ANID through FONDECYT Postdoctrorado Project 3230379. C.L. acknowledges support by Fundação para a Ciência e a Tecnologia (FCT) through the research grants UIDB/04434/2020 and UIDP/04434/2020. DOI: 10.54499/UIDB/04434/2020 and DOI: 10.54499/UIDP/04434/2020. F.R.H. acknowledges support from FAPESP grants 2018/21661-9 and 2021/11345-5. R.D. gratefully acknowledges support by the ANID BASAL project FB210003. P.K.H. gratefully acknowledges the Fundação de Amparo à Pesquisa do Estado de São Paulo (FAPESP) for the support grant 2023/14272-4. L.L.N. thanks Fundação de Amparo à Pesquisa do Estado do Rio de Janeiro (FAPERJ) for granting the postdoctoral research fellowship E-40/2021(280692). C.L-D acknowledges financial support from the ESO Comite Mixto 2022. D.E.O-R acknowledges the financial support from the Chilean National Agency for Research and Development (ANID) through the InESGénero project INGE210025, and funding from the Fondo Aporte para el Desarrollo de Actividades de Interés Nacional from the Ministerio de Educación through the project TAL2293. S.V.W. is supported by the United Kingdom Research and Innovation (UKRI) Future Leaders Fellowship ‘Using Cosmic Beasts to uncover the Nature of Dark Matter’ (grant number MR/X006069/1). The S-PLUS project, including the T80-South robotic telescope and the S-PLUS scientific survey, was founded as a partnership between the Fundação de Amparo à Pesquisa do Estado de São Paulo (FAPESP), the Observatório Nacional (ON), the Federal University of Sergipe (UFS), and the Federal University of Santa Catarina (UFSC), with important financial and practical contributions from other collaborating institutes in Brazil, Chile (Universidad de La Serena), and Spain (Centro de Estudios de Física del Cosmos de Aragón, CEFCA). We further acknowledge financial support from the São Paulo Research Foundation (FAPESP), Fundação de Amparo à Pesquisa do Estado do RS (FAPERGS), the Brazilian National Research Council (CNPq), the Coordination for the Improvement of Higher Education Personnel (CAPES), the Carlos Chagas Filho Rio de Janeiro State Research Foundation (FAPERJ), and the Brazilian Innovation Agency (FINEP). The authors who are members of the S-PLUS collaboration are grateful for the contributions from CTIO staff in helping in the construction, commissioning and maintenance of the T80-South telescope and camera. We are also indebted to Rene Laporte and INPE, as well as Keith Taylor, for their important contributions to the project. From CEFCA, we particularly would like to thank Antonio Marín-Franch for his invaluable contributions in the early phases of the project, David Cristóbal-Hornillos and his team for their help with the installation of the data reduction package jype version 0.9.9, César Íñiguez for providing 2D measurements of the filter transmissions, and all other staff members for their support with various aspects of the project. The Legacy Surveys consist of three individual and complementary projects: the Dark Energy Camera Legacy Survey (DECaLS; Proposal ID 2014B-0404; PIs: David Schlegel and Arjun Dey), the Beijing-Arizona Sky Survey (BASS; NOAO Prop. ID 2015A-0801; PIs: Zhou Xu and Xiaohui Fan), and the Mayall z-band Legacy Survey (MzLS; Prop. ID 2016A-0453; PI: Arjun Dey). DECaLS, BASS and MzLS together include data obtained, respectively, at the Blanco telescope, Cerro Tololo Inter-American Observatory, NSF's NOIRLab; the Bok telescope, Steward Observatory, University of Arizona; and the Mayall telescope, Kitt Peak National Observatory, NOIRLab. Pipeline processing and analyses of the data were supported by NOIRLab and the Lawrence Berkeley National Laboratory (LBNL). The Legacy Surveys project is honored to be permitted to conduct astronomical research on Iolkam Du’ag (Kitt Peak), a mountain with particular significance to the Tohono O’odham Nation. This project used data obtained with the Dark Energy Camera (DECam), which was constructed by the Dark Energy Survey (DES) collaboration. Funding for the DES Projects has been provided by the U.S. Department of Energy, the U.S. National Science Foundation, the Ministry of Science and Education of Spain, the Science and Technology Facilities Council of the United Kingdom, the Higher Education Funding Council for England, the National Center for Supercomputing Applications at the University of Illinois at Urbana-Champaign, the Kavli Institute of Cosmological Physics at the University of Chicago, Center for Cosmology and Astro-Particle Physics at the Ohio State University, the Mitchell Institute for Fundamental Physics and Astronomy at Texas A&M University, Financiadora de Estudos e Projetos, Fundacao Carlos Chagas Filho de Amparo, Financiadora de Estudos e Projetos, Fundacao Carlos Chagas Filho de Amparo a Pesquisa do Estado do Rio de Janeiro, Conselho Nacional de Desenvolvimento Cientifico e Tecnologico and the Ministerio da Ciencia, Tecnologia e Inovacao, the Deutsche Forschungsgemeinschaft and the Collaborating Institutions in the Dark Energy Survey. The Collaborating Institutions are Argonne National Laboratory, the University of California at Santa Cruz, the University of Cambridge, Centro de Investigaciones Energeticas, Medioambientales y Tecnologicas-Madrid, the University of Chicago, University College London, the DES-Brazil Consortium, the University of Edinburgh, the Eidgenossische Technische Hochschule (ETH) Zurich, Fermi National Accelerator Laboratory, the University of Illinois at Urbana-Champaign, the Institut de Ciencies de l’Espai (IEEC/CSIC), the Institut de Fisica d’Altes Energies, Lawrence Berkeley National Laboratory, the Ludwig Maximilians Universitat Munchen and the associated Excellence Cluster Universe, the University of Michigan, NSF's NOIRLab, the University of Nottingham, the Ohio State University, the University of Pennsylvania, the University of Portsmouth, SLAC National Accelerator Laboratory, Stanford University, the University of Sussex, and Texas A&M University. BASS is a key project of the Telescope Access Program (TAP), which has been funded by the National Astronomical Observatories of China, the Chinese Academy of Sciences (the Strategic Priority Research Program “The Emergence of Cosmological Structures” Grant XDB09000000), and the Special Fund for Astronomy from the Ministry of Finance. The BASS is also supported by the External Cooperation Program of Chinese Academy of Sciences (Grant 114A11KYSB20160057), and Chinese National Natural Science Foundation (Grant 12120101003, 11433005). The Legacy Survey team makes use of data products from the Near-Earth Object Wide-field Infrared Survey Explorer (NEOWISE), which is a project of the Jet Propulsion Laboratory/California Institute of Technology. NEOWISE is funded by the National Aeronautics and Space Administration. The Legacy Surveys imaging of the DESI footprint is supported by the Director, Office of Science, Office of High Energy Physics of the U.S. Department of Energy under Contract No. DE-AC02-05CH1123, by the National Energy Research Scientific Computing Center, a DOE Office of Science User Facility under the same contract; and by the U.S. National Science Foundation, Division of Astronomical Sciences under Contract No. AST-0950945 to NOAO. This research has made use of NASA's Astrophysics Data System (ADS) Bibliographic Services. The ADS is operated by the Smithsonian Astrophysical Observatory under NASA Cooperative Agreement 80NSSC21M0056.
Available at https://splus-collab.github.io/s-cubes/
Provided via private communication by Dr. Enrichetta Iodice.
It assumes the Chabrier (2003) initial mass function.
References
- Bacon, R., Accardo, M., Adjali, L., et al. 2010, in Ground-based and Airborne Instrumentation for Astronomy III, eds. I. S. McLean, S. K. Ramsay, & H. Takami, SPIE Conf. Ser., 7735, 773508 [Google Scholar]
- Bahé, Y. M., McCarthy, I. G., Balogh, M. L., & Font, A. S. 2013, MNRAS, 430, 3017 [Google Scholar]
- Balogh, M. L., Morris, S. L., Yee, H. K. C., Carlberg, R. G., & Ellingson, E. 1999, ApJ, 527, 54 [Google Scholar]
- Balogh, M. L., van der Burg, R. F. J., Muzzin, A., et al. 2021, MNRAS, 500, 358 [Google Scholar]
- Baxter, D. C., Cooper, M. C., Balogh, M. L., et al. 2022, MNRAS, 515, 5479 [NASA ADS] [CrossRef] [Google Scholar]
- Benitez, N., Dupke, R., Moles, M., et al. 2014, ArXiv e-prints [arXiv:1403.5237] [Google Scholar]
- Blakeslee, J. P., Jordán, A., Mei, S., et al. 2009, ApJ, 694, 556 [Google Scholar]
- Boselli, A., Voyer, E., Boissier, S., et al. 2014, A&A, 570, A69 [NASA ADS] [CrossRef] [EDP Sciences] [Google Scholar]
- Cantiello, M., Venhola, A., Grado, A., et al. 2020, A&A, 639, A136 [NASA ADS] [CrossRef] [EDP Sciences] [Google Scholar]
- Cappellari, M., & Copin, Y. 2003, MNRAS, 342, 345 [Google Scholar]
- Cardamone, C. N., van Dokkum, P. G., Urry, C. M., et al. 2010, ApJS, 189, 270 [Google Scholar]
- Cenarro, A. J., Moles, M., Cristóbal-Hornillos, D., et al. 2019, A&A, 622, A176 [NASA ADS] [CrossRef] [EDP Sciences] [Google Scholar]
- Chabrier, G. 2003, PASP, 115, 763 [Google Scholar]
- Chevance, M., Kruijssen, J. M. D., Hygate, A. P. S., et al. 2020, MNRAS, 493, 2872 [NASA ADS] [CrossRef] [Google Scholar]
- Combes, F., Dupraz, C., Casoli, F., & Pagani, L. 1988, A&A, 203, L9 [Google Scholar]
- Conselice, C. J. 2003, ApJS, 147, 1 [NASA ADS] [CrossRef] [Google Scholar]
- Cook, D. O., Kasliwal, M. M., Van Sistine, A., et al. 2019, ApJ, 880, 7 [Google Scholar]
- De Lucia, G., Weinmann, S., Poggianti, B. M., Aragón-Salamanca, A., & Zaritsky, D. 2012, MNRAS, 423, 1277 [NASA ADS] [CrossRef] [Google Scholar]
- Dey, A., Schlegel, D. J., Lang, D., et al. 2019, AJ, 157, 168 [Google Scholar]
- Dolag, K., Borgani, S., Murante, G., & Springel, V. 2009, MNRAS, 399, 497 [Google Scholar]
- Donnari, M., Pillepich, A., Nelson, D., et al. 2021, MNRAS, 506, 4760 [NASA ADS] [CrossRef] [Google Scholar]
- Dressler, A. 1980, ApJ, 236, 351 [Google Scholar]
- Drinkwater, M. J., Gregg, M. D., & Colless, M. 2001, ApJ, 548, L139 [Google Scholar]
- Fahrion, K., Lyubenova, M., Hilker, M., et al. 2020a, A&A, 637, A26 [NASA ADS] [CrossRef] [EDP Sciences] [Google Scholar]
- Fahrion, K., Lyubenova, M., Hilker, M., et al. 2020b, A&A, 637, A27 [NASA ADS] [CrossRef] [EDP Sciences] [Google Scholar]
- Fossati, M., Fumagalli, M., Gavazzi, G., et al. 2019, MNRAS, 484, 2212 [NASA ADS] [CrossRef] [Google Scholar]
- Frank, K. A., Peterson, J. R., Andersson, K., Fabian, A. C., & Sanders, J. S. 2013, ApJ, 764, 46 [Google Scholar]
- Fujita, S. S., Ajiki, M., Shioya, Y., et al. 2003, AJ, 125, 13 [NASA ADS] [CrossRef] [Google Scholar]
- Geach, J. E., Smail, I., Best, P. N., et al. 2008, MNRAS, 388, 1473 [NASA ADS] [CrossRef] [Google Scholar]
- Gill, S. P. D., Knebe, A., & Gibson, B. K. 2005, MNRAS, 356, 1327 [CrossRef] [Google Scholar]
- Giovanelli, R., & Haynes, M. P. 1983, AJ, 88, 881 [Google Scholar]
- Glazebrook, K., Tober, J., Thomson, S., Bland-Hawthorn, J., & Abraham, R. 2004, AJ, 128, 2652 [Google Scholar]
- Gunn, J. E., Gott, J., & Richard, I. 1972, ApJ, 176, 1 [Google Scholar]
- Haack, R. F., Smith Castelli, A. V., Mendes de Oliveira, C., et al. 2024, MNRAS, 530, 3195 [Google Scholar]
- Haines, C. P., Pereira, M. J., Smith, G. P., et al. 2013, ApJ, 775, 126 [NASA ADS] [CrossRef] [Google Scholar]
- Haines, C. P., Pereira, M. J., Smith, G. P., et al. 2015, ApJ, 806, 101 [NASA ADS] [CrossRef] [Google Scholar]
- Hernández-Fernández, J. D., Haines, C. P., Diaferio, A., et al. 2014, MNRAS, 438, 2186 [CrossRef] [Google Scholar]
- Hernandez-Jimenez, J. A., & Krabbe, A. C. 2022, https://doi.org/10.5281/zenodo.6940848 [Google Scholar]
- Herpich, F. R., Almeida-Fernandes, F., Oliveira Schwarz, G. B., et al. 2024, A&A, 689, A249 [NASA ADS] [CrossRef] [EDP Sciences] [Google Scholar]
- Hirschmann, M., De Lucia, G., Wilman, D., et al. 2014, MNRAS, 444, 2938 [NASA ADS] [CrossRef] [Google Scholar]
- Horellou, C., Casoli, F., & Dupraz, C. 1995, A&A, 303, 361 [NASA ADS] [Google Scholar]
- Hou, M., Hu, Z., & Li, Z. 2024, ApJ, 965, L24 [Google Scholar]
- Iodice, E., Capaccioli, M., Grado, A., et al. 2016, ApJ, 820, 42 [Google Scholar]
- Iodice, E., Spavone, M., Capaccioli, M., et al. 2017, ApJ, 839, 21 [Google Scholar]
- Iodice, E., Spavone, M., Capaccioli, M., et al. 2019a, A&A, 623, A1 [NASA ADS] [CrossRef] [EDP Sciences] [Google Scholar]
- Iodice, E., Sarzi, M., Bittner, A., et al. 2019b, A&A, 627, A136 [NASA ADS] [CrossRef] [EDP Sciences] [Google Scholar]
- Jáchym, P., Sun, M., Kenney, J. D. P., et al. 2017, ApJ, 839, 114 [Google Scholar]
- James, P. A., Shane, N. S., Knapen, J. H., Etherton, J., & Percival, S. M. 2005, A&A, 429, 851 [NASA ADS] [CrossRef] [EDP Sciences] [Google Scholar]
- Jones, C., Stern, C., Forman, W., et al. 1997, ApJ, 482, 143 [Google Scholar]
- Kauffmann, G., Heckman, T. M., White, S. D. M., et al. 2003, MNRAS, 341, 33 [Google Scholar]
- Kellar, J. A., Salzer, J. J., Wegner, G., Gronwall, C., & Williams, A. 2012, AJ, 143, 145 [NASA ADS] [CrossRef] [Google Scholar]
- Kenney, J. D. P., Rubin, V. C., Planesas, P., & Young, J. S. 1995, ApJ, 438, 135 [Google Scholar]
- Khostovan, A. A., Malhotra, S., Rhoads, J. E., et al. 2020, MNRAS, 493, 3966 [NASA ADS] [CrossRef] [Google Scholar]
- Kleiner, D., Serra, P., Maccagni, F. M., et al. 2021, A&A, 648, A32 [NASA ADS] [CrossRef] [EDP Sciences] [Google Scholar]
- Krabbe, A. C., Hernandez-Jimenez, J. A., Mendes de Oliveira, C., et al. 2024, MNRAS, 528, 1125 [NASA ADS] [CrossRef] [Google Scholar]
- Kreckel, K., Blanc, G. A., Schinnerer, E., et al. 2016, ApJ, 827, 103 [NASA ADS] [CrossRef] [Google Scholar]
- Kron, R. G. 1980, ApJS, 43, 305 [Google Scholar]
- Lara-López, M. A., Galán-de Anta, P. M., Sarzi, M., et al. 2022, A&A, 660, A105 [NASA ADS] [CrossRef] [EDP Sciences] [Google Scholar]
- Loni, A., Serra, P., Kleiner, D., et al. 2021, A&A, 648, A31 [NASA ADS] [CrossRef] [EDP Sciences] [Google Scholar]
- Lopes, P. A. A., Ribeiro, A. L. B., & Brambila, D. 2024, MNRAS, 527, L19 [Google Scholar]
- Lotz, J. M., Primack, J., & Madau, P. 2004, AJ, 128, 163 [NASA ADS] [CrossRef] [Google Scholar]
- Lotz, J. M., Davis, M., Faber, S. M., et al. 2008, ApJ, 672, 177 [NASA ADS] [CrossRef] [Google Scholar]
- Loubser, S. I., Mosia, K., Serra, P., et al. 2024, MNRAS, 527, 7158 [Google Scholar]
- Ly, C., Lee, J. C., Dale, D. A., et al. 2011, ApJ, 726, 109 [Google Scholar]
- Maccagni, F. M., Murgia, M., Serra, P., et al. 2020, A&A, 634, A9 [NASA ADS] [CrossRef] [EDP Sciences] [Google Scholar]
- Maddox, N., Serra, P., Venhola, A., et al. 2019, MNRAS, 490, 1666 [Google Scholar]
- Mahajan, S., Mamon, G. A., & Raychaudhury, S. 2011, MNRAS, 416, 2882 [NASA ADS] [CrossRef] [Google Scholar]
- Makarov, D., Prugniel, P., Terekhova, N., Courtois, H., & Vauglin, I. 2014, A&A, 570, A13 [NASA ADS] [CrossRef] [EDP Sciences] [Google Scholar]
- Marinacci, F., Vogelsberger, M., Pakmor, R., et al. 2018, MNRAS, 480, 5113 [NASA ADS] [Google Scholar]
- McGee, S. L., Balogh, M. L., Bower, R. G., Font, A. S., & McCarthy, I. G. 2009, MNRAS, 400, 937 [Google Scholar]
- McNab, K., Balogh, M. L., van der Burg, R. F. J., et al. 2021, MNRAS, 508, 157 [CrossRef] [Google Scholar]
- Mendes de Oliveira, C., Ribeiro, T., Schoenell, W., et al. 2019, MNRAS, 489, 241 [NASA ADS] [CrossRef] [Google Scholar]
- Menezes, R. B., Steiner, J. E., & Ricci, T. V. 2014, MNRAS, 438, 2597 [Google Scholar]
- Moles, M., Benítez, N., Aguerri, J. A. L., et al. 2008, AJ, 136, 1325 [NASA ADS] [CrossRef] [Google Scholar]
- Morokuma-Matsui, K., Serra, P., Maccagni, F. M., et al. 2019, PASJ, 71, 85 [NASA ADS] [CrossRef] [Google Scholar]
- Morokuma-Matsui, K., Bekki, K., Wang, J., et al. 2022, ApJS, 263, 40 [NASA ADS] [CrossRef] [Google Scholar]
- Muzzin, A., van der Burg, R. F. J., McGee, S. L., et al. 2014, ApJ, 796, 65 [Google Scholar]
- Nasonova, O. G., de Freitas Pacheco, J. A., & Karachentsev, I. D. 2011, A&A, 532, A104 [NASA ADS] [CrossRef] [EDP Sciences] [Google Scholar]
- Nelson, D., Pillepich, A., Springel, V., et al. 2018, MNRAS, 475, 624 [Google Scholar]
- Nelson, D., Pillepich, A., Springel, V., et al. 2019, MNRAS, 490, 3234 [Google Scholar]
- Oman, K. A., & Hudson, M. J. 2016, MNRAS, 463, 3083 [Google Scholar]
- Pallero, D., Gómez, F. A., Padilla, N. D., et al. 2019, MNRAS, 488, 847 [NASA ADS] [CrossRef] [Google Scholar]
- Pallero, D., Gómez, F. A., Padilla, N. D., et al. 2022, MNRAS, 511, 3210 [NASA ADS] [CrossRef] [Google Scholar]
- Pascual, S., Gallego, J., & Zamorano, J. 2007, PASP, 119, 30 [Google Scholar]
- Pasquali, A., Smith, R., Gallazzi, A., et al. 2019, MNRAS, 484, 1702 [Google Scholar]
- Pedrini, A., Fossati, M., Gavazzi, G., et al. 2022, MNRAS, 511, 5180 [NASA ADS] [CrossRef] [Google Scholar]
- Pérez-González, P. G., Cava, A., Barro, G., et al. 2013, ApJ, 762, 46 [Google Scholar]
- Pillepich, A., Nelson, D., Hernquist, L., et al. 2018, MNRAS, 475, 648 [Google Scholar]
- Pillepich, A., Nelson, D., Springel, V., et al. 2019, MNRAS, 490, 3196 [Google Scholar]
- Pinna, F., Falcón-Barroso, J., Martig, M., et al. 2019a, A&A, 623, A19 [NASA ADS] [CrossRef] [EDP Sciences] [Google Scholar]
- Pinna, F., Falcón-Barroso, J., Martig, M., et al. 2019b, A&A, 625, A95 [NASA ADS] [CrossRef] [EDP Sciences] [Google Scholar]
- Poci, A., McDermid, R. M., Lyubenova, M., et al. 2021, A&A, 647, A145 [NASA ADS] [CrossRef] [EDP Sciences] [Google Scholar]
- Raj, M. A., Iodice, E., Napolitano, N. R., et al. 2019, A&A, 628, A4 [NASA ADS] [CrossRef] [EDP Sciences] [Google Scholar]
- Raj, M. A., Iodice, E., Napolitano, N. R., et al. 2020, A&A, 640, A137 [EDP Sciences] [Google Scholar]
- Rhee, J., Smith, R., Choi, H., et al. 2017, ApJ, 843, 128 [Google Scholar]
- Rodriguez-Gomez, V., Snyder, G. F., Lotz, J. M., et al. 2019, MNRAS, 483, 4140 [NASA ADS] [CrossRef] [Google Scholar]
- Romero-Gómez, J., Peletier, R. F., Aguerri, J. A. L., & Smith, R. 2024, A&A, 689, A40 [NASA ADS] [CrossRef] [EDP Sciences] [Google Scholar]
- Rosa, D. A., Milone, A. C., Krabbe, A. C., & Rodrigues, I. 2018, Ap&SS, 363, 131 [NASA ADS] [CrossRef] [Google Scholar]
- Salzer, J. J., Carr, D. J., Sieben, J., Brunker, S. W., & Hirschauer, A. S. 2023, AJ, 166, 81 [Google Scholar]
- Sampaio, V. M., de Carvalho, R. R., Aragón-Salamanca, A., et al. 2024, MNRAS, 532, 982 [NASA ADS] [CrossRef] [Google Scholar]
- Sarzi, M., Iodice, E., Coccato, L., et al. 2018, A&A, 616, A121 [NASA ADS] [CrossRef] [EDP Sciences] [Google Scholar]
- Scharf, C. A., Zurek, D. R., & Bureau, M. 2005, ApJ, 633, 154 [NASA ADS] [CrossRef] [Google Scholar]
- Serra, P., Maccagni, F. M., Kleiner, D., et al. 2019, A&A, 628, A122 [NASA ADS] [CrossRef] [EDP Sciences] [Google Scholar]
- Smith Castelli, A. V., Cortesi, A., Haack, R. F., et al. 2024, MNRAS, 530, 3787 [CrossRef] [Google Scholar]
- Sobral, D., Best, P. N., Geach, J. E., et al. 2009, MNRAS, 398, 75 [NASA ADS] [CrossRef] [Google Scholar]
- Spavone, M., Iodice, E., van de Ven, G., et al. 2020, A&A, 639, A14 [NASA ADS] [CrossRef] [EDP Sciences] [Google Scholar]
- Spavone, M., Iodice, E., D’Ago, G., et al. 2022, A&A, 663, A135 [NASA ADS] [CrossRef] [EDP Sciences] [Google Scholar]
- Spilker, J. S., Suess, K. A., Setton, D. J., et al. 2022, ApJ, 936, L11 [Google Scholar]
- Spriggs, T. W., Sarzi, M., Napiwotzki, R., et al. 2020, A&A, 637, A62 [NASA ADS] [CrossRef] [EDP Sciences] [Google Scholar]
- Spriggs, T. W., Sarzi, M., Galán-de Anta, P. M., et al. 2021, A&A, 653, A167 [NASA ADS] [CrossRef] [EDP Sciences] [Google Scholar]
- Springel, V., White, S. D. M., Tormen, G., & Kauffmann, G. 2001, MNRAS, 328, 726 [Google Scholar]
- Springel, V., Pakmor, R., Pillepich, A., et al. 2018, MNRAS, 475, 676 [Google Scholar]
- Su, A. H., Salo, H., Janz, J., et al. 2021, A&A, 647, A100 [EDP Sciences] [Google Scholar]
- Taniguchi, Y., Kajisawa, M., Kobayashi, M. A. R., et al. 2015, PASJ, 67, 104 [NASA ADS] [Google Scholar]
- Taylor, E. N., Hopkins, A. M., Baldry, I. K., et al. 2011, MNRAS, 418, 1587 [Google Scholar]
- Thainá-Batista, J., Cid Fernandes, R., Herpich, F. R., et al. 2023, MNRAS, 526, 1874 [Google Scholar]
- Thainá-Batista, J., Cid Fernandes, R., Herpich, F. R., et al. 2025, A&A, 699, A45 [NASA ADS] [CrossRef] [EDP Sciences] [Google Scholar]
- van der Burg, R. F. J., Rudnick, G., Balogh, M. L., et al. 2020, A&A, 638, A112 [NASA ADS] [CrossRef] [EDP Sciences] [Google Scholar]
- Venhola, A., Peletier, R., Laurikainen, E., et al. 2017, A&A, 608, A142 [NASA ADS] [CrossRef] [EDP Sciences] [Google Scholar]
- Venhola, A., Peletier, R., Laurikainen, E., et al. 2018, A&A, 620, A165 [NASA ADS] [CrossRef] [EDP Sciences] [Google Scholar]
- Venhola, A., Peletier, R., Laurikainen, E., et al. 2019, A&A, 625, A143 [EDP Sciences] [Google Scholar]
- Venhola, A., Peletier, R. F., Salo, H., et al. 2022, A&A, 662, A43 [NASA ADS] [CrossRef] [EDP Sciences] [Google Scholar]
- Vilella-Rojo, G., Viironen, K., López-Sanjuan, C., et al. 2015, A&A, 580, A47 [NASA ADS] [CrossRef] [EDP Sciences] [Google Scholar]
- Vollmer, B., Soida, M., Chung, A., et al. 2009, A&A, 496, 669 [NASA ADS] [CrossRef] [EDP Sciences] [Google Scholar]
- Waugh, M., Drinkwater, M. J., Webster, R. L., et al. 2002, MNRAS, 337, 641 [Google Scholar]
- Wetzel, A. R. 2011, MNRAS, 412, 49 [NASA ADS] [CrossRef] [Google Scholar]
- Wetzel, A. R., Tinker, J. L., Conroy, C., & van den Bosch, F. C. 2013, MNRAS, 432, 336 [Google Scholar]
- Wolf, C., Meisenheimer, K., Rix, H. W., et al. 2003, A&A, 401, 73 [NASA ADS] [CrossRef] [EDP Sciences] [Google Scholar]
- Wright, R. J., Lagos, C. d. P., Davies, L. J. M., et al. 2019, MNRAS, 487, 3740 [NASA ADS] [CrossRef] [Google Scholar]
- Zabel, N., Davis, T. A., Smith, M. W. L., et al. 2019, MNRAS, 483, 2251 [Google Scholar]
- Zabludoff, A. I., Zaritsky, D., Lin, H., et al. 1996, ApJ, 466, 104 [NASA ADS] [CrossRef] [Google Scholar]
Appendix A: Emission line maps and galaxy features
In this appendix, we present the 77 Hα+[N II] maps obtained by the PELE code, as described in Section 3. The galaxies located within 1 Rvir of Fornax A include NGC 1341, NGC 1326B, NGC 1326A, FCC 35, NGC 1326, NGC 1316C, NGC 1317, FCC 28, NGC 1316, NGC 1310 and FCC B112, and shown in Fig. A.3 and Fig. A.4. In Table A.1, we present the main properties displayed by the 77 Hα+[N II] emitters. In the case of the morphology of the emission, we consider as central emission that corresponding to a central compact region, knots indicates emission in several discrete compact regions, and extended emission corresponds to contiguous regions displaying Hα+[N II] emission. If two types can be associated with the morphology of the emission, we indicate the one we consider to be dominant.
List of galaxies with derived Hα+[N II] maps using 3FM with S-PLUS images.
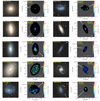 |
Fig. A.1. Images from DESI Legacy Imaging Surveys (left panels) and the corresponding Hα+[N II] maps (right panels) for all emitters located at a projected radius R <0.62 Rvir from NGC 1399. From left to right and from top to bottom, we show the galaxies ordered from the closest to NGC 1399 to the farthest. The white arrow points to the center of the Fornax cluster. |
All Tables
All Figures
|
Fig. 1. Redshift evolution of the observed wavelength of the [O II], [O III]λ5007, Hα+[N II] and Hβ emission lines. At the distance of the Fornax cluster (indicated by the dashed purple line), we can potentially detect two of these emission lines, [O II] and Hα+[N II], in the narrow-band filters J0378 (blue region) and J0660 (red region), respectively. The shaded gray regions are the remaining narrow-band filters of SPLUS. |
| In the text | |
|
Fig. 2. Workflow associated with the PELE code. The input information is a list of galaxies with ID, RA, Dec, and size of the images, followed by the creation of masks, in which the user can check the objects to be masked and labeled as stars and main galaxy. Then the code automatically performs the image processing, including PSF homogenization, Butterworth filtering, binning functions, and the three-filter method. Prior to generating the final emission-line map, sigma clipping is applied to remove outliers that are overestimated, as discussed in Sect. 3.2. |
| In the text | |
|
Fig. 3. Comparison of the Hα+[N II] maps derived from S-PLUS data with the Hα maps obtained from F3D/MUSE for FCC 263 (top) and FCC 312 (bottom). The left panels display the Legacy Survey images (a combination of g, r, and z bands) at the same scale as the Hα+[N II] maps from S-PLUS (middle panels) and MUSE (right panels). The contours are based on the MUSE Hα map, corresponding to isophotes of 1×10⁻¹⁸ (blue), 1×10⁻¹⁷ (green) and 1×10⁻¹⁶ (magenta) erg s−1 cm−2. No internal dust correction was applied to any map. |
| In the text | |
|
Fig. 4. Example of a pixel-by-pixel analysis of the Hα+[N II] flux derived from S-PLUS images using PELE and the Hα flux observed with MUSE for FCC 312. The lighter color (yellow) indicates a higher number of pixels, while the darker shade (purple) represents lower data density. The dashed red line is the 1-to-1 relation. The linear correlation diverges at ∼2×10⁻¹⁷ erg s−1 cm−2, marked by the solid blue line. |
| In the text | |
|
Fig. 5. Examples of galaxies classified as early and late type using images from the DESI Legacy Imaging Surveys. From left to right, the galaxies shown are NGC 1380, FCC 90, NGC 1310, and FCC 9. |
| In the text | |
|
Fig. 6. Concentration versus asymmetry diagram (top panel) and Gini versus M20 diagram (bottom panel) for 77 Hα+[N II] emitters in the Fornax cluster. The solid black line in the top panel delineates the morphological transition zone boundaries, where the disturbed galaxies lie, given by C=−9.5A+4.85 and C<4 (Krabbe et al. 2024). The solid brown lines in the bottom panel are defined by Lotz et al. (2008). The galaxies belonging to merger systems are shown as open magenta diamonds and the perturbed ones with open green circles. |
| In the text | |
|
Fig. 7. Spatial distribution of the Fornax members around NGC 1399 (cyan star). The distribution is color-coded by radial velocity, Vgal, of each galaxy relative to the cluster's mean velocity, Vcluster = 1442 km s−1, and normalized by its velocity dispersion, σcluster = 318 km s−1 (Maddox et al. 2019) (top right panel) and morphological features for 77 Hα+[N II] emitters detected by PELE (top left panel). The bottom left provides a close-up view of the spatial distribution of 15 galaxies within the Fornax A group, while the bottom right panel focuses on the region within 1Rvir around the cluster center; both plots use the same symbol conventions. Only galaxies with detected emission are included in the morphological analysis described in Sect. 4.1. LTGs are depicted as squares, whereas ETGs are shown as triangles. Galaxies identified as perturbed are marked with open green circles, and mergers are denoted by open magenta diamonds. The solid cyan and brown lines represent the Rvir of the Fornax cluster and the Fornax A group, respectively, while the dashed black line indicates 3 Rvir. The black square and triangle in the top right panel correspond to two galaxies without known radial velocities but with detected Hα+[N II] emission. |
| In the text | |
|
Fig. 8. Projected phase space diagram of the 77 Hα+[N II] emitters found using PELE. Rhee et al. (2017) defined different areas separated by solid lines; E is dominated by ancient infallers (tinfall>8 Gyr), D contains a mixed population with tinfall<4−7 Gyr, and regions A, B, and C correspond to galaxies that have fallen into the cluster less than 1 Gyr ago (recent infallers). |
| In the text | |
|
Fig. 9. Color magnitude relation for Fornax members, with the emitters highlighted according to their respective morphologies, as described in the legend. The dashed black line represents the magnitude limit of our sample. |
| In the text | |
|
Fig. 10. Color (g−r) and stellar mass as function of projected distance from NGC 1399 for Hα+[N II] emitters. The galaxy with a higher stellar mass located at ∼1.8Rvir is the central galaxy of the group Fornax A. LTGs are represented as squares, whereas ETGs are denoted as triangles. Galaxies identified as perturbed are shown with open green circles, and mergers are marked by open magenta diamonds. |
| In the text | |
|
Fig. 11. Spatial distribution of simulated galaxies in the Fornax-like system present in IllustrisTNG-50. Left: Distribution of galaxies up to 1R200 (continuous cyan line) and 3R200 (dashed black line). Late, early, and nonemitter galaxies bound to the cluster are shown in squares (blue), triangles (red), and full circles (maroon), respectively. Additionally, gray dots show galaxies within 5R200 of the cluster that are not gravitationally bound to the cluster. Right: Zoom region showing the galaxy distribution within 1R200 of the Fornax-like system. |
| In the text | |
|
Fig. 12. Evidence of misaligned star formation rate for satellite galaxies from the Fornax-like cluster in IllustrisTNG-50. The left, central, and right panels show the resolved star formation efficiency spatial distribution for late, early, and all emitters, respectively. The zero value splits the galaxy into halves, with negative values (between [−1,0); blue bars) being the half of the galaxy that is closer to the cluster's center, and positive values (between (0,1]; red bars), the half of the galaxy that is on the outskirts of the cluster. Late emitters show a clear signal of a higher star formation rate toward the cluster's outskirts, while early emitters show the opposite trend. |
| In the text | |
|
Fig. A.1. Images from DESI Legacy Imaging Surveys (left panels) and the corresponding Hα+[N II] maps (right panels) for all emitters located at a projected radius R <0.62 Rvir from NGC 1399. From left to right and from top to bottom, we show the galaxies ordered from the closest to NGC 1399 to the farthest. The white arrow points to the center of the Fornax cluster. |
| In the text | |
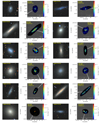 |
Fig. A.2. Same as Figure A.1 but for emitters located at 0.62 Rvir ≤ R ≤ 1.1 Rvir. |
| In the text | |
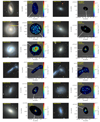 |
Fig. A.3. Same as Figure A.1 but for emitters located at 1.1 Rvir <R <1.54 Rvir. |
| In the text | |
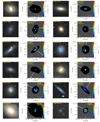 |
Fig. A.4. Same as Figure A.1 but for emitters located at 1.54 Rvir ≤ R <1.85 Rvir. |
| In the text | |
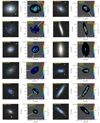 |
Fig. A.5. Same as Figure A.1 but for emitters located at 1.85 Rvir ≤ R <2.65 Rvir. |
| In the text | |
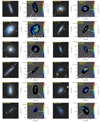 |
Fig. A.6. Same as Figure A.1 but for emitters located at 2.65 Rvir ≤ R <3.47 Rvir. |
| In the text | |
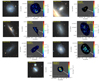 |
Fig. A.7. Same as Figure A.1 but for emitters located at R ≥ 3.47 Rvir. |
| In the text | |
Current usage metrics show cumulative count of Article Views (full-text article views including HTML views, PDF and ePub downloads, according to the available data) and Abstracts Views on Vision4Press platform.
Data correspond to usage on the plateform after 2015. The current usage metrics is available 48-96 hours after online publication and is updated daily on week days.
Initial download of the metrics may take a while.