Fig. 3.
Download original image
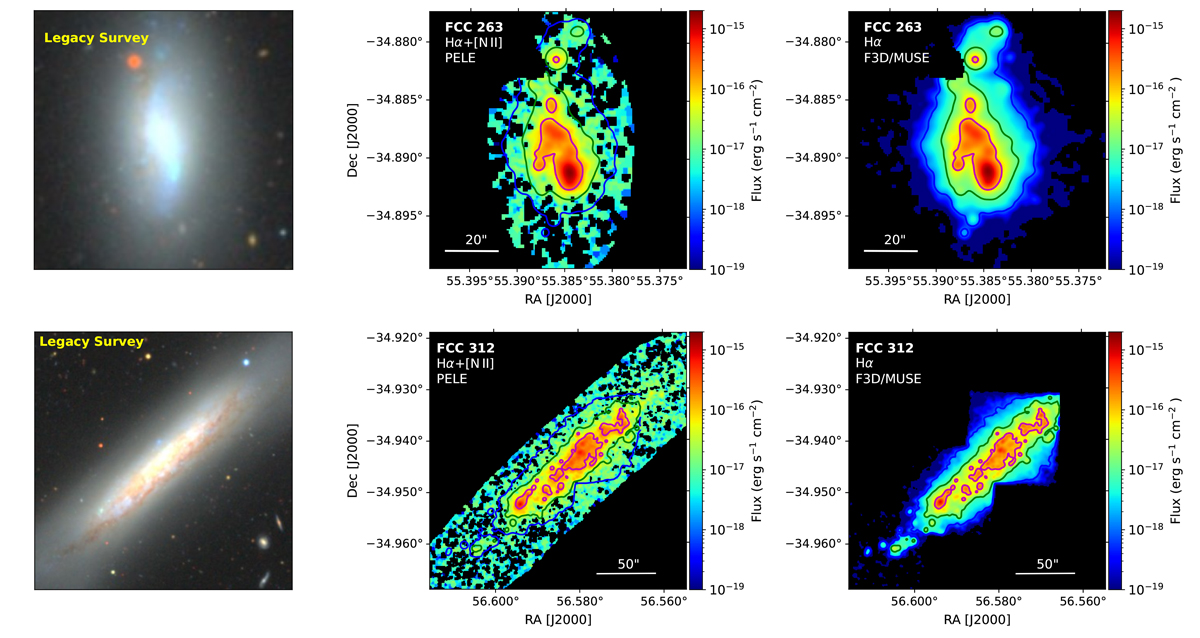
Comparison of the Hα+[N II] maps derived from S-PLUS data with the Hα maps obtained from F3D/MUSE for FCC 263 (top) and FCC 312 (bottom). The left panels display the Legacy Survey images (a combination of g, r, and z bands) at the same scale as the Hα+[N II] maps from S-PLUS (middle panels) and MUSE (right panels). The contours are based on the MUSE Hα map, corresponding to isophotes of 1×10⁻¹⁸ (blue), 1×10⁻¹⁷ (green) and 1×10⁻¹⁶ (magenta) erg s−1 cm−2. No internal dust correction was applied to any map.
Current usage metrics show cumulative count of Article Views (full-text article views including HTML views, PDF and ePub downloads, according to the available data) and Abstracts Views on Vision4Press platform.
Data correspond to usage on the plateform after 2015. The current usage metrics is available 48-96 hours after online publication and is updated daily on week days.
Initial download of the metrics may take a while.