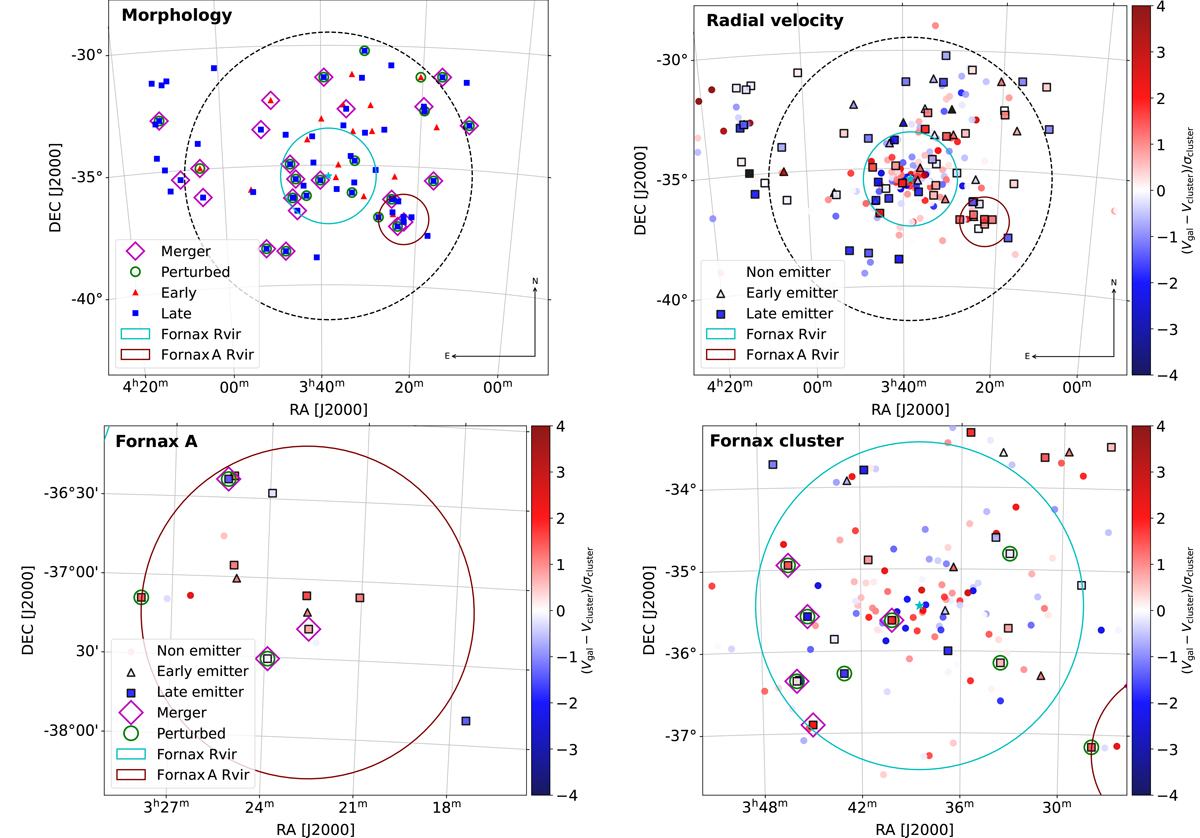
Fig. 7.
Download original image
Spatial distribution of the Fornax members around NGC 1399 (cyan star). The distribution is color-coded by radial velocity, Vgal, of each galaxy relative to the cluster's mean velocity, Vcluster = 1442 km s−1, and normalized by its velocity dispersion, σcluster = 318 km s−1 (Maddox et al. 2019) (top right panel) and morphological features for 77 Hα+[N II] emitters detected by PELE (top left panel). The bottom left provides a close-up view of the spatial distribution of 15 galaxies within the Fornax A group, while the bottom right panel focuses on the region within 1Rvir around the cluster center; both plots use the same symbol conventions. Only galaxies with detected emission are included in the morphological analysis described in Sect. 4.1. LTGs are depicted as squares, whereas ETGs are shown as triangles. Galaxies identified as perturbed are marked with open green circles, and mergers are denoted by open magenta diamonds. The solid cyan and brown lines represent the Rvir of the Fornax cluster and the Fornax A group, respectively, while the dashed black line indicates 3 Rvir. The black square and triangle in the top right panel correspond to two galaxies without known radial velocities but with detected Hα+[N II] emission.
Current usage metrics show cumulative count of Article Views (full-text article views including HTML views, PDF and ePub downloads, according to the available data) and Abstracts Views on Vision4Press platform.
Data correspond to usage on the plateform after 2015. The current usage metrics is available 48-96 hours after online publication and is updated daily on week days.
Initial download of the metrics may take a while.