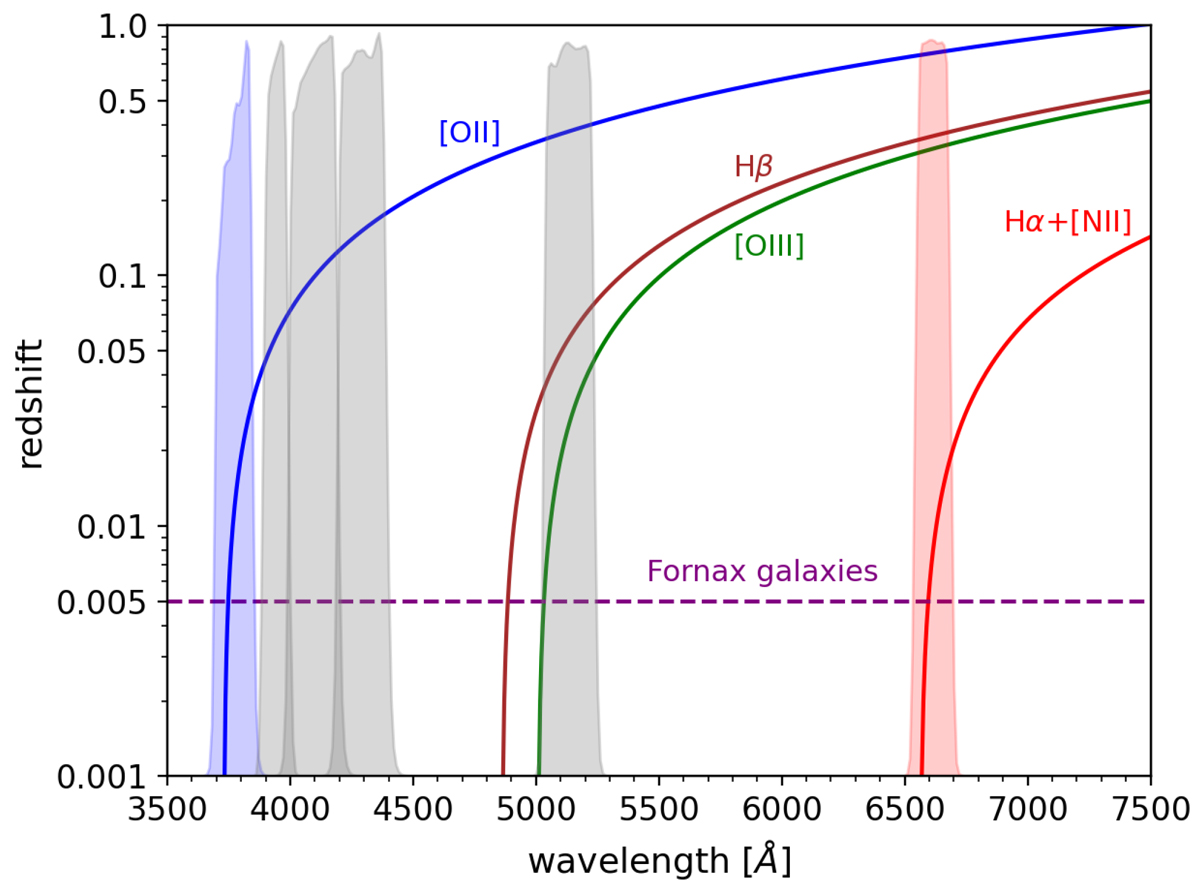
Fig. 1.
Download original image
Redshift evolution of the observed wavelength of the [O II], [O III]λ5007, Hα+[N II] and Hβ emission lines. At the distance of the Fornax cluster (indicated by the dashed purple line), we can potentially detect two of these emission lines, [O II] and Hα+[N II], in the narrow-band filters J0378 (blue region) and J0660 (red region), respectively. The shaded gray regions are the remaining narrow-band filters of SPLUS.
Current usage metrics show cumulative count of Article Views (full-text article views including HTML views, PDF and ePub downloads, according to the available data) and Abstracts Views on Vision4Press platform.
Data correspond to usage on the plateform after 2015. The current usage metrics is available 48-96 hours after online publication and is updated daily on week days.
Initial download of the metrics may take a while.