Fig. A.2.
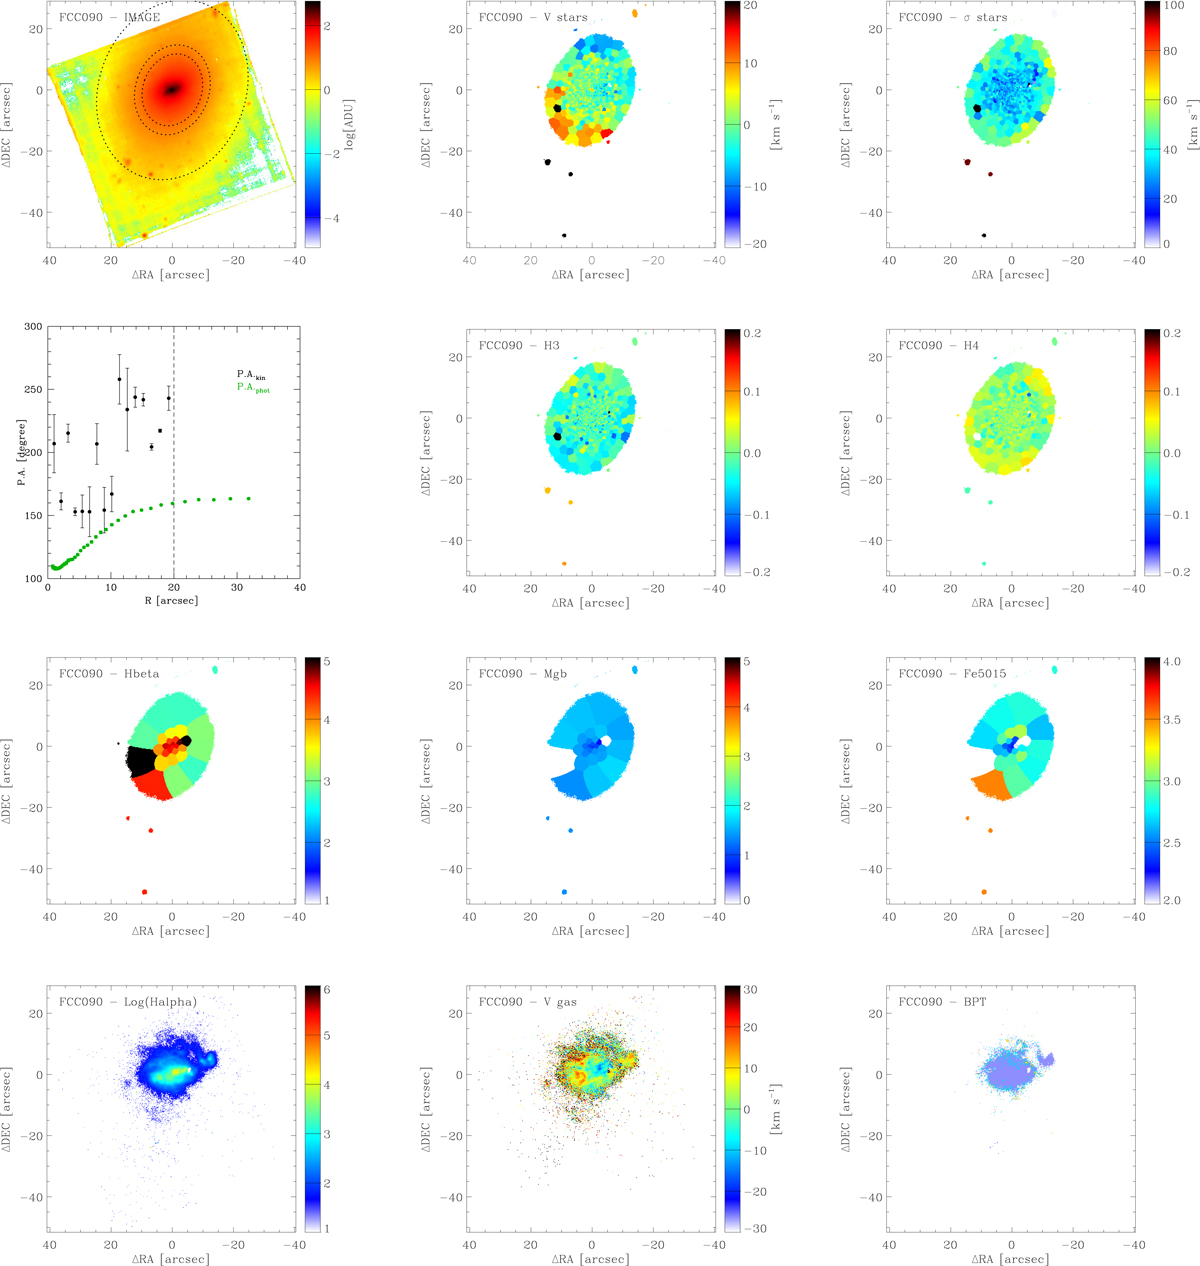
Stellar and ionised-gas analysis for FCC 90. First row panels: MUSE reconstructed image (left). The dotted ellipses correspond to the isophotes at 0.5 Re, Rtr, and μB = 25 mag arcsec−2, respectively. Maps of the mean velocity (middle) and velocity dispersion (right) of the stellar LOSVD. Second row panels: radial profiles of the kinematic (black circles) and photometric (green circles) position angle (left). The vertical dashed lines mark the radial range where the average position angles are computed. Maps of the third (middle) and fourth Gauss-Hermite coefficient (right) of the stellar LOSVD. Third row panels: maps of the Hβ (left), Mgb (middle), and Fe5015 line-strength index (right). Fourth row panels: map of the Hα flux (left). Data are shown in logarithmic scale and in units of 10−20 erg cm−2 s−1 where the S/N of the line is sufficiently elevated to exclude a false positive detection. Map of the Hα velocity (middle) with respect to the systemic velocity, as derived from the median gas-velocity value in the central regions of the galaxy. Map of the ionised-gas classification (right) into H II regions (blue), highly-ionised or AGN regions (yellow), LINER-like emission regions (red), and regions where the nebular emission is powered by some combination of massive-star radiation and other ionisation sources (green).
Current usage metrics show cumulative count of Article Views (full-text article views including HTML views, PDF and ePub downloads, according to the available data) and Abstracts Views on Vision4Press platform.
Data correspond to usage on the plateform after 2015. The current usage metrics is available 48-96 hours after online publication and is updated daily on week days.
Initial download of the metrics may take a while.