Fig. 1.
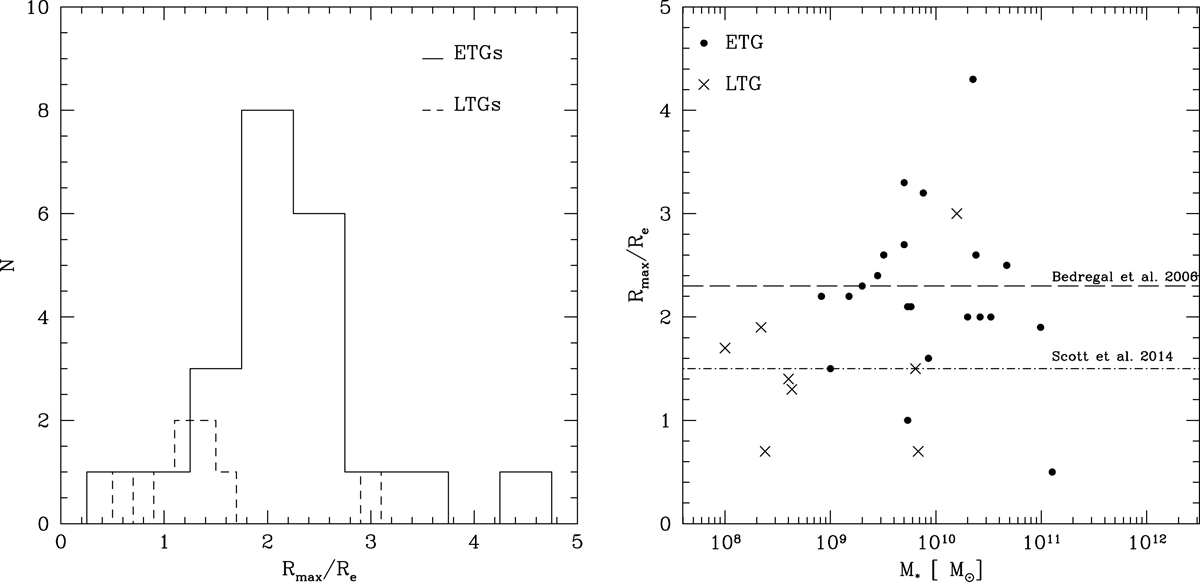
Left: distribution of the spatial coverage of the F3D MUSE data for ETGs (solid line) and LTGs (dashed line) in units of effective radius, as measured along the major axis. Right: spatial coverage of the F3D ETGs (circles) and LTGs (crosses) as a function of the total stellar mass. The long-dashed and dash-dotted lines correspond to the average spatial coverage from the long-slit data of Bedregal et al. (2006) and integral-field data of Scott et al. (2014), respectively. The adopted values of Re for the comparison with literature are given in Table C.1.
Current usage metrics show cumulative count of Article Views (full-text article views including HTML views, PDF and ePub downloads, according to the available data) and Abstracts Views on Vision4Press platform.
Data correspond to usage on the plateform after 2015. The current usage metrics is available 48-96 hours after online publication and is updated daily on week days.
Initial download of the metrics may take a while.