Fig. 6.
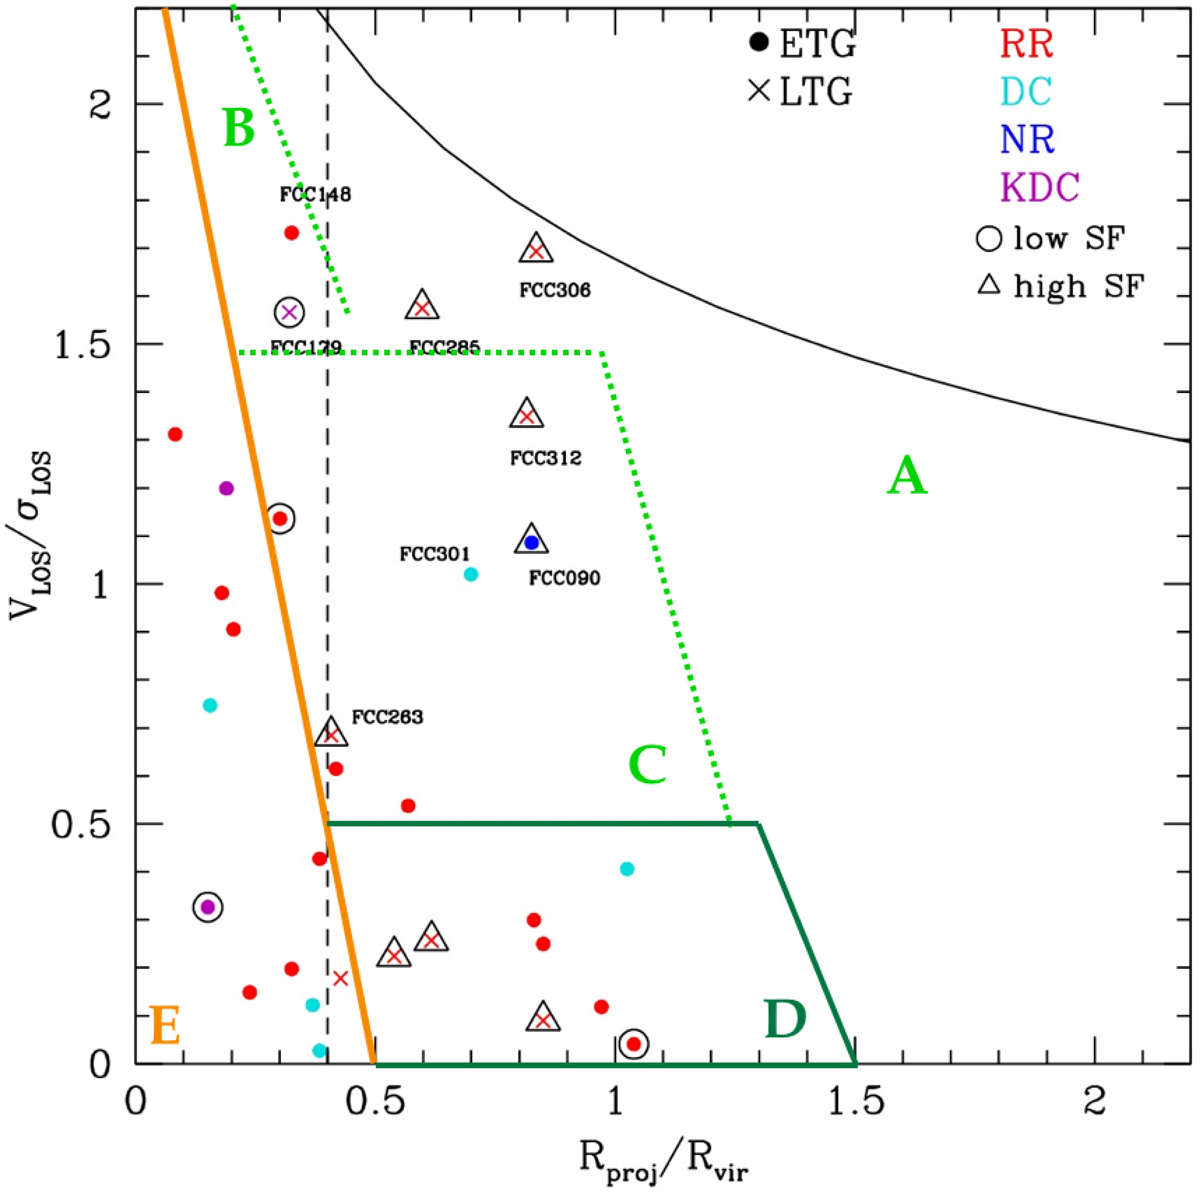
Projected phase-space diagram of the F3D ETGs (filled circles) and LTGs (crosses). Symbols are as in the left panel of Fig. 3. Galaxies with low (black open triangles) and high star formation (black open circles) are also shown. The black solid line corresponds to the cluster escape velocity. The vertical dashed line separates the high and low-density regions of the cluster. According to Rhee et al. (2017), region A is populated by the first infallers, regions B and C (together delimited by the dashed light-green, solid orange, and solid green lines) contain 80% of the recent infallers, regions D (delimited by the solid green and solid orange lines) and E (delimited by the solid orange line) contain 40% of the intermediate infallers, and the ancient infallers are found in region E. The name of the galaxies classified as recent infallers are also indicated on the plot.
Current usage metrics show cumulative count of Article Views (full-text article views including HTML views, PDF and ePub downloads, according to the available data) and Abstracts Views on Vision4Press platform.
Data correspond to usage on the plateform after 2015. The current usage metrics is available 48-96 hours after online publication and is updated daily on week days.
Initial download of the metrics may take a while.