Fig. 5.
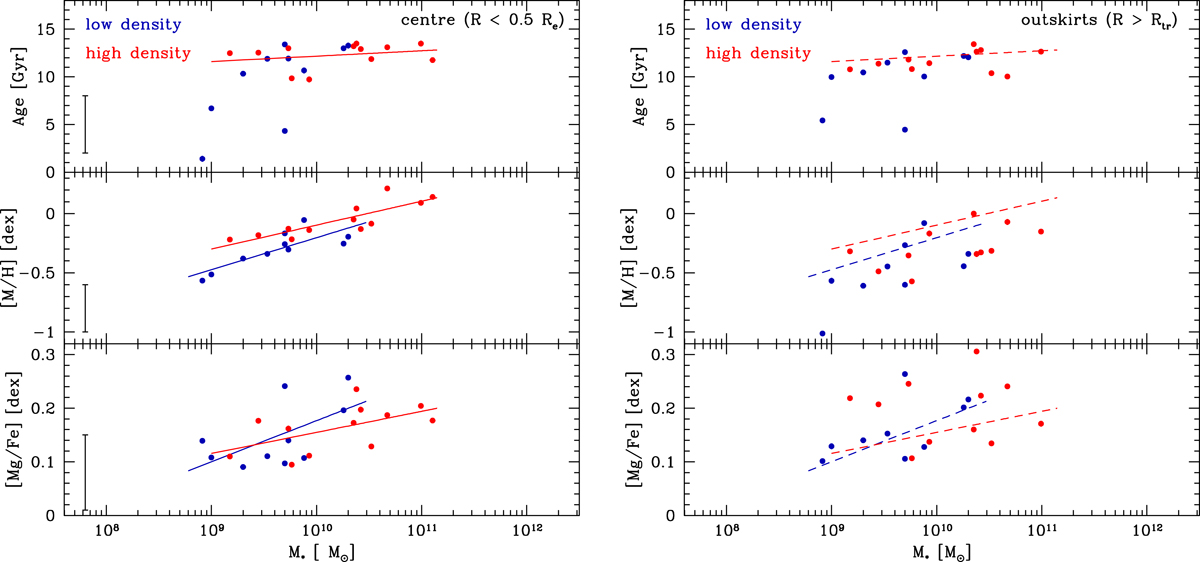
Left: mean age (top), total metallicity [M/H] (middle), and [Mg/Fe] abundance ratio (bottom) in the central parts of the F3D ETGs located in the high (red circles) and low-density region (blue circles) of the cluster as a function of the total stellar mass. The red and blue lines in the middle and bottom panels are the least-square fits of the values for the central parts of the ETGs in the high and low-density regions of the cluster, respectively. The error bars in the low-left corner indicate the average uncertainty derived for each quantity. Right: same as in the left panels but for the outskirts of the F3D ETGs. The least-square fitting lines of the left panels are shown as dashed lines for comparison.
Current usage metrics show cumulative count of Article Views (full-text article views including HTML views, PDF and ePub downloads, according to the available data) and Abstracts Views on Vision4Press platform.
Data correspond to usage on the plateform after 2015. The current usage metrics is available 48-96 hours after online publication and is updated daily on week days.
Initial download of the metrics may take a while.