Fig. 7.
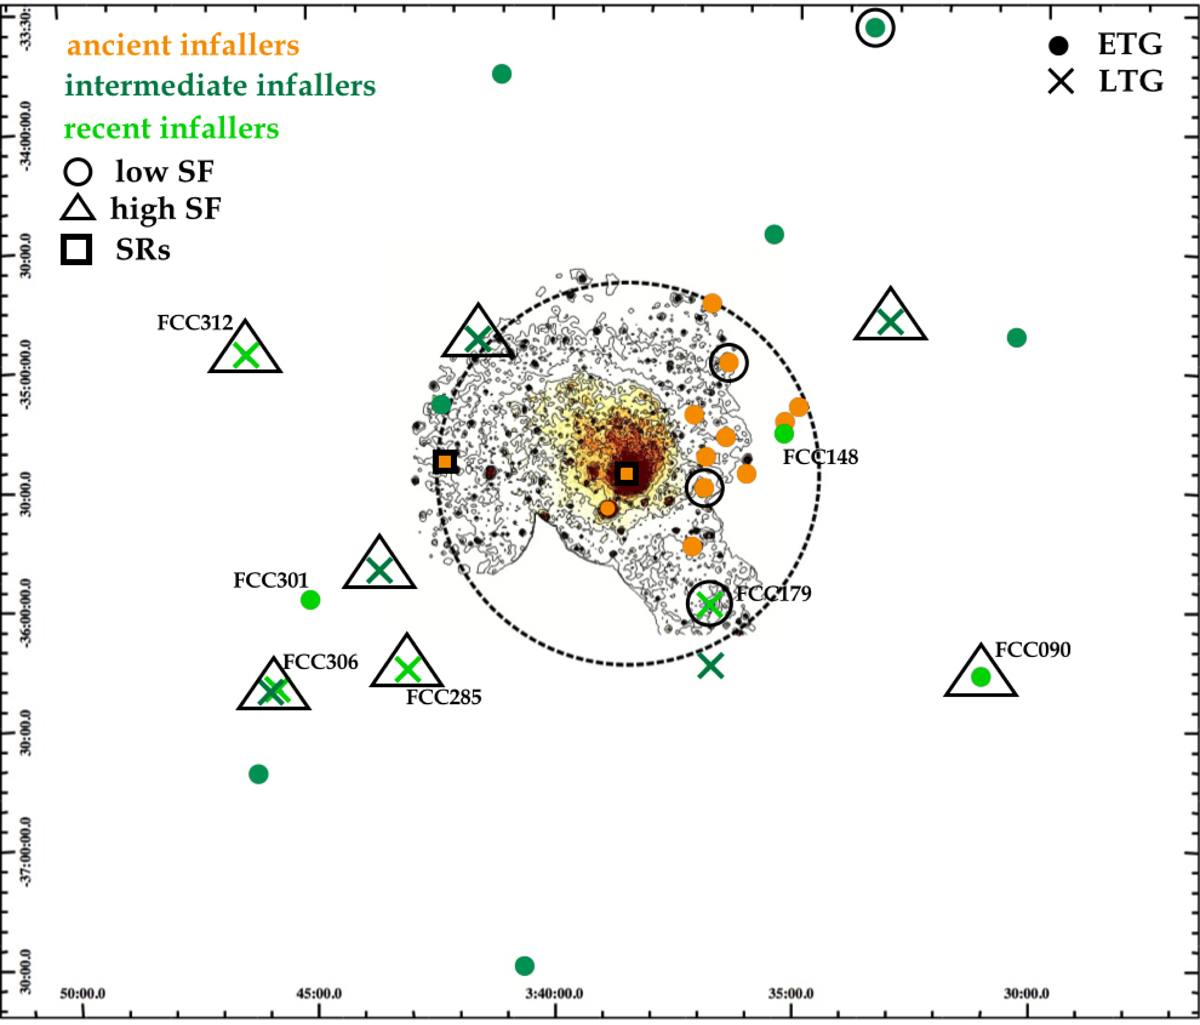
Distribution of the F3D ETGs (circles) and LTGs (crosses) onto the sky plane. The right ascension and declination (J2000.0) are given in degrees on the horizontal and vertical axes of the field of view, respectively. The background image and contours map the X-ray emission in the energy range 0.4–1.3 KeV as measured by XMM-Newton (Frank et al. 2013). The dashed circle indicates the transition from the high-to-low density region of the cluster at 0.4 Rvir. Orange, green, and light-green symbols represent the ancient, intermediate, and recent infallers, respectively, according to the analysis of the PPS diagram shown in Fig. 6. Galaxies with low (black open triangles) and high star formation (black open circles) are also shown. The slow rotators (SRs) are marked with open black squares. As in Fig. 6, all the recent infallers are labelled.
Current usage metrics show cumulative count of Article Views (full-text article views including HTML views, PDF and ePub downloads, according to the available data) and Abstracts Views on Vision4Press platform.
Data correspond to usage on the plateform after 2015. The current usage metrics is available 48-96 hours after online publication and is updated daily on week days.
Initial download of the metrics may take a while.