Fig. 3.
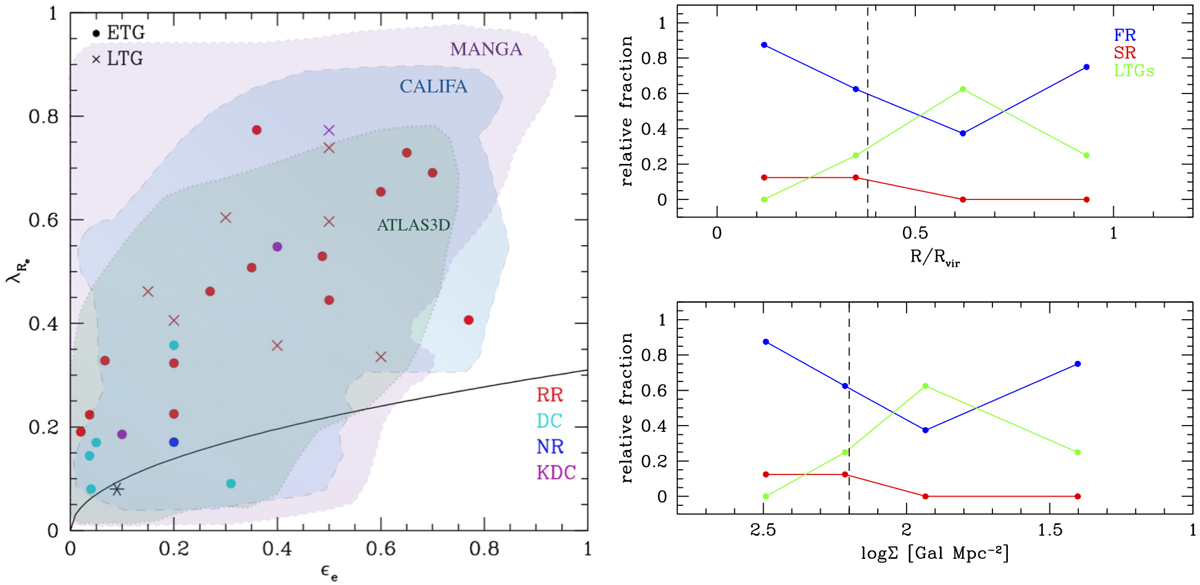
Left: specific stellar angular momentum of the F3D ETGs (circles) and LTGs (crosses) as a function of the ellipticity measured at the effective radius. Galaxies classified as regular rotators (RRs) are shown with red symbols. The light-blue symbols correspond to galaxies with a distinct core (DC). The blue circle corresponds to the only non-rotating ETG of the sample (NR). Galaxies with a kinematically decoupled core (KDC) are shown with magenta symbols. The black asterisk corresponds to FCC 213 (NGC 1399) and it is taken from Scott et al. (2014). The black solid line divides FRs from SRs according to Emsellem et al. (2011). The light green, light blue, and light magenta areas indicate the location of the galaxies from the ATLAS3D (Emsellem et al. 2011), CALIFA (Falcón-Barroso et al. 2011), and MANGA survey (Graham et al. 2018), respectively.. Right: relative fraction of the F3D SRs (red circles), FRs (blue circles), and LTGs (green circles) as function of the projected radius from the centre of the Fornax cluster in units of virial radius (top) and as a function of the local projected density of the cluster (bottom). The vertical dashed line separates the high and low-density regions of the cluster.
Current usage metrics show cumulative count of Article Views (full-text article views including HTML views, PDF and ePub downloads, according to the available data) and Abstracts Views on Vision4Press platform.
Data correspond to usage on the plateform after 2015. The current usage metrics is available 48-96 hours after online publication and is updated daily on week days.
Initial download of the metrics may take a while.