


| Issue |
A&A
Volume 711, July 2026
|
|
|---|---|---|
| Article Number | A276 | |
| Number of page(s) | 13 | |
| Section | Planets, planetary systems, and small bodies | |
| DOI | https://doi.org/10.1051/0004-6361/202659664 | |
| Published online | 22 July 2026 | |
MINDS: Complementary inclinations in the binary system HK Tau reveal gas- and ice-phase chemistry
1
Max-Planck-Institut für Astronomie,
Königstuhl 17,
69117
Heidelberg,
Germany
2
Niels Bohr Institute, University of Copenhagen,
NBB BA2, Jagtvej 155A,
2200
Copenhagen,
Denmark
3
Max-Planck-Institut für Extraterrestrische Physik,
Giessenbachstrasse 1,
85748
Garching,
Germany
4
Leiden Observatory, Leiden University,
PO Box 9513,
2300
RA
Leiden,
The Netherlands
5
Kapteyn Astronomical Institute, Rijksuniversiteit Groningen,
Postbus 800,
9700AV
Groningen,
The Netherlands
6
INAF – Osservatorio Astronomico di Capodimonte,
Salita Moiariello 16,
80131
Napoli,
Italy
7
Institute of Astronomy, KU Leuven,
Celestijnenlaan 200D,
3001
Leuven,
Belgium
8
STAR Institute, Université de Liège,
Allée du Six Août 19c,
4000
Liège,
Belgium
9
Earth and Planets Laboratory, Carnegie Institution for Science,
5241 Broad Branch Road, NW,
Washington,
DC
20015,
USA
10
Department of Astrophysics, University of Vienna,
Türkenschanzstr. 17,
1180
Vienna,
Austria
11
ETH Zürich, Institute for Particle Physics and Astrophysics,
Wolfgang-Pauli-Str. 27,
8093
Zürich,
Switzerland
12
Department of Physics and Astronomy, University of Exeter,
Exeter
EX4 4QL,
UK
13
Université Paris-Saclay, CNRS, Institut d’Astrophysique Spatiale,
91405
Orsay,
France
★ Corresponding author: This email address is being protected from spambots. You need JavaScript enabled to view it.
Received:
2
March
2026
Accepted:
16
June
2026
Abstract
HK Tau is a roughly equal-mass pre-main-sequence binary system consisting of a low-inclination primary (57°) and an edge-on (83°) secondary. We present JWST Mid-Infrared Instrument (MIRI) observations targeting both sources, taken as part of the JWST GTO program MIND. The mid-infrared spectra reveal a line-rich CO2-dominated primary and a line-poor secondary. This evidence, albeit in line with the evolution-motivated trend uncovered by recent observations of binaries at MIRI wavelengths, is likely due to the different configuration of the two sources. Thermochemical disc models coupled with radiative transfer indeed show that at inclinations comparable to that of HK Tau B, only ionised atomic lines are expected to remain visible in the spectra. While it blocks molecular emission lines, however, the edge-on configuration allows ice absorption bands to be visible against the continuum. In this framework, the HK Tau system provides an unprecedented opportunity for a simultaneous view of the solid and gaseous component of a pair of coeval protoplanetary discs thanks to the complementary inclination of the two sources. We detect water ice at 6.2 and 13.6 μm, CO2 ice at 15.2 μm, and NH4+ ice at 6.85 μm in the spectrum of HK Tau B. An additional absorption band between 8.3 and 9 μm is compatible with both silicate stretching and C-H bending. Neither the primary nor the secondary shows signs of polycyclic aromatic hydrocarbons. Extended H2 emission is present around both sources, but is much more elongated in HK Tau B. The distinctive X shape centred at the location of B, combined with the intensity, morphology, and spectral characteristics of the ionised atomic lines [Ar II], [Ne II], and [Ne III], suggests a low-velocity wind origin with a wide (~ 70°) semi-opening angle. The lower forbidden line fluxes and smaller spatial extent of the H2 emission around A imply that if a wind is launched from the primary as well, it is too cold or dense to be ionised and emit brightly.
Key words: accretion, accretion disks / planets and satellites: formation / protoplanetary disks
© The Authors 2026
 Open Access article, published by EDP Sciences, under the terms of the Creative Commons Attribution License (https://creativecommons.org/licenses/by/4.0), which permits unrestricted use, distribution, and reproduction in any medium, provided the original work is properly cited.
This article is published in open access under the Subscribe to Open model.
Open Access funding provided by Max Planck Society.
1 Introduction
The majority of stars forms in binary or higher multiplicity stellar systems (Offner et al. 2023). The dynamical interaction between stars and discs in multiple systems has a major effect on the presence and evolution of the discs themselves, which in turn determines the budget and potential for planet formation. Theoretical studies predict mechanisms such as outer disc truncation, inner disc warping, and material ejection (Papaloizou & Pringle 1977; Artymowicz & Lubow 1994; Kuruwita & Haugbølle 2023) to be common in multiple systems. In the past decade, facilities such as the Atacama Large Millimeter Array (ALMA) and the Very Large Telescope (VLT) have provided observational confirmation of these dynamical interactions (Akeson et al. 2019; Manara et al. 2019; Tobin et al. 2020; Rota et al. 2022; Zagaria et al. 2022).
At infrared wavelengths, surveys with the Spitzer Space Telescope (Werner et al. 2004) have targeted ~90% of the star-forming regions within 500 pc of the Sun (Evans et al. 2009), obtaining mid-infrared spectra with the InfraRed Spectrograph (IRS) for over 2000 young stellar objects (Kessler-Silacci et al. 2007; Evans et al. 2009; Furlan et al. 2009; Oliveira et al. 2010). These early studies placed constraints on the disc frequency and lifetimes (Bouwman et al. 2006), dust growth and settling (Furlan et al. 2006, 2009), and spectral properties. The latter have allowed us to constrain molecular inventories through the detection of several lines (C2H2, HCN, CO2, OH, and H2O; Lahuis et al. 2006; Carr & Najita 2008; Salyk et al. 2008; Pontoppidan et al. 2010). Furthermore, the detection of [Ne II] emission (Pascucci et al. 2007; Lahuis et al. 2007; Najita et al. 2010; Güdel et al. 2010; Espaillat et al. 2013) paved the way for direct infrared observations of jets (Güdel et al. 2010) and photoevaporative winds (Pascucci & Sterzik 2009; see Pascucci et al. 2023 for a review). However, the spatial resolution of Spitzer/IRS did not allow us to separate the contribution of the individual stars and discs in multiple stellar systems, which ultimately resulted in the spectrum of multiples being dominated by the primary. Since the advent of the Mid-InfraRed Instrument (MIRI; Rieke et al. 2015; Wright et al. 2015, 2023) on the James Webb Space Telescope (JWST; Rigby et al. 2023), the available spatial resolution and sensitivity are high enough for separating the spectra of multiple stellar systems in the mid-infrared wavelength regime. The first JWST/MIRI analysis of a multiple system in the medium-resolution spectrometer mode (MRS; 4.9–27.9 μm, Wells et al. 2015; Argyriou et al. 2023) was performed on DF Tau (Grant et al. 2024), although the small separation on the sky plane (around 70 mas, 10 au) only allowed us to recover a combined spectrum for the two sources. The sample of binary systems observed with JWST/MIRI-MRS was then expanded by Arulanantham et al. (2025), with the addition of AS 205 N and S, and by Kurtovic et al. (2026), who targeted VW Cha, WX Cha, and RW Aur. Because the separation of these systems is larger than the angular resolution of the instrument at short wavelengths, they were able to separate the emission from the primary and secondary component. Interestingly, the spectra showed dramatic differences, with the primary stars being water rich and the secondaries line poor, at least at the current sensitivity. These findings might be a consequence of the increased accretion and radial drift resulting from dynamical disc truncation, and they call for a larger sample of binary systems to assess the robustness of the trend.
Along with the molecular gas composition, ice spectroscopy is a key focus of infrared observations. Ice studies with Spitzer mostly targeted embedded Class 0/I protostars, probing ices in protostellar envelopes (Pontoppidan et al. 2008; Boogert et al. 2008; Öberg et al. 2011). In the case of Class II systems, where the surrounding envelope has completely dissipated, ice absorption features are primarily observable in the edge-on configuration: at high inclinations (>75°), the disc itself blocks the light from the central star and bright inner region, which improves the contrast between the ice species and the disc continuum. Observing edge-on discs in the mid-infrared, however, requires high sensitivity, which was limited to a few sources in the Spitzer era (e.g. in Pontoppidan et al. 2005, 2007). JWST enabled us to characterise ices in edge-on Class II systems: MIRI/MRS observed Tau 042021 (Arulanantham et al. 2024), HH 48 NE (Sturm et al. 2024), and d216-0939 (Potapov et al. 2025), which show H2O and CO2 ice features, the latter also NH3 and tentatively CH4 and NH4+. Furthermore, H2O and CO ice bands in the JWST/Near Infrared Spectrograph (NIRSpec) (Sturm et al. 2023a; Pascucci et al. 2025) and JWST/Near Infrared Camera (NIRCam) (Ballering et al. 2025) have been detected in edge-on Class II discs. Recently, Bergner et al. (2026) compiled NIRSpec and MIRI observations of five additional targets, detecting H2O, CO2, and CO ice in all of them.
We present JWST/MIRI-MRS observations of the pre-main-sequence binary system HK Tauri (HK Tau), a ~0.4 M⊙ roughly equal-mass binary, that were taken as part of the MIRI Mid-Infrared Disk Survey (MINDS; Henning et al. 2024). HK Tau is located in the L1529/B 18 molecular cloud in the Taurus star-forming region (distance 128 ± 4 pc, Gaia Collaboration 2021; Luhman 2023). It is a well-characterised system that has been observed with several facilities (with the Hubble Space Telescope by Koresko 1998; Stapelfeldt et al. 1998; with the Plateau de Bure telescope by Duchêne et al. 2003; with Keck by McCabe et al. 2003; with Subaru by Terada et al. 2007; with the VLT by Appenzeller et al. 2005; McCabe et al. 2011; with Spitzer by Furlan et al. 2006; with AKARI by Aikawa et al. 2012; and with ALMA by Villenave et al. 2020). We summarise its main properties in Table 1.
Interestingly, the disc around HK Tau A has a smaller radius than that around HK Tau B, although the disc mass is higher (Duchêne et al. 2003). This implies that the disc sizes were established during the formation of the binary system and not during the subsequent dynamical evolution (Artymowicz & Lubow 1994; Kuffmeier et al. 2020). While the primary HK Tau A is a classical T Tauri star surrounded by a disc seen at an inclination of ~60° (Manara et al. 2019), HK Tau B offers a nearly edge-on view of its disc (> 83°; Stapelfeldt et al. 1998; McCabe et al. 2011; Villenave et al. 2020) and is therefore much fainter at visible and near-infrared wavelengths. Although the two stars have very similar spectral types (we adopted the M1 and M2 classification for the primary and secondary, respectively, of Monin et al. 1998), the edge-on disc of HK Tau B blocks the light from the central star (Stapelfeldt et al. 1998) and only allows scattered photons to reach the observer. The high inclination gives a direct insight into the disc vertical structure, which has been shown to be stratified, with the larger dust closer to the midplane (Duchêne et al. 2003). The binary nature of the system, with similar spectral types but complementary inclinations of the two sources, offers a unique opportunity to explore the disc chemistry in the gaseous and icy reservoirs of a pair of coeval sources with a common formation history.
The paper is structured as follows. In Section 2, we describe the observations and data reduction process. In Section 3, we show the mid-infrared spectra of the two sources and analyse their molecular and atomic emission lines as well as the ice absorption features in the spectrum of B. In Section 4, we focus on the extended molecular hydrogen emission and derive a temperature and density 2D map. Finally, we discuss the results in Section 5 and draw our conclusions in Section 6.
Properties of the HK Tau system.
2 Observations and data reduction
The HK Tau system was observed with JWST/MIRI-MRS on February 27–28, 2023, as part of the MINDS GTO program (PID: 1282; PI: Th. Henning; Kamp et al. 2023; Henning et al. 2024). A four-point dither was performed in the positive direction. The total exposure time was 21.1 min per grating setting (for a total of 1.03 h). The data were reduced with the MINDS pipeline1 (Christiaens et al. 2024), a hybrid pipeline that combines routines from the standard JWST pipeline (Bushouse et al. 2024, v1.14.0) and the VIP package (Gomez-Gonzalez et al. 2017; Christiaens et al. 2023).
The separation between the sources in the HK Tau system is 2.4″, which allows us to spatially resolve them at the wavelengths of MIRI-MRS. At longer wavelengths, however, the point spread function (PSF) becomes wider, and the wings of the PSF of the sources overlap with each other, blending their fluxes. To extract the spectrum of HK Tau A and B, we applied the method of Kurtovic et al. (2026), which combines forward modelling with a theoretical PSF for each channel and aperture photometry to disentangle the emission of each of the two components. The emission of a source can extend farther than the FWHM of the PSF, and the wings of the PSF of each source can overlap with the location of the other. Thus, the main reason for subtracting a forward model is to avoid contaminating the spectrum of a source with emission from the PSF wing of its companion. The separation between the sources was computed by fitting their position at each wavelength in band 1 short, and the centroid of the PSF and background level were free parameters, determined with a Markov chain Monte Carlo (MCMC) approach. The highest-amplitude residuals were found within one FWHM of the PSF, which is enclosed in the aperture for each disc. Therefore, these residuals were included in the spectra (we refer to Appendix A of Kurtovic et al. (2026) for a detailed description of the method). We estimated the aperture size as θ = 1.22 λ/D, where λ is the channel wavelength, and D is the diameter of JWST. As in Kurtovic et al. (2026), we used 2θ for the primary and θ for the secondary. We confirm that these apertures were large enough to include all relevant residuals. At the longest wavelength of interest (20 μm), the aperture is three times smaller than the binary separation. Assuming that all the noise is stochastic, we found in the line-free emission range from 16.34 to 16.36 μm a noise level of 2 mJy (relative to the combined spectra). Because our method for recovering the spectra is unconventional, our uncertainty is dominated by the systematic uncertainties of the extraction method and not by the sensitivity of the observations. The continuum emission in the 1D spectrum was estimated iteratively with a Savitzky–Golay filter by fitting a third-order polynomial, masking spikes deviating by 2σ in the positive direction and 3σ in the negative direction of the spectra (Temmink et al. 2024). The baseline of the filtered spectrum was then determined using PyBaselines (Erb 2022) and sdither as background-subtraction method.
3 Mid-infrared spectra
Figure 1 shows the MIRI-MRS spectrum of HK Tau A (top panel) and B (bottom panel). The secondary is dimmer, with a flux lower than the primary by a factor varying between 50 and 10 (at 5 and 20 μm respectively). The two sources show molecular hydrogen emission lines, and while only the S(1) to S(5) transitions of the eight that fall in the MIRI range are visible in the spectrum of A, all of them are visible in B (although with different intensities). Furthermore, at first glance, the atomic ion emission in B from [Ar II] at 6.98 μm, [Ne II] at 12.81 μm, and [Ne III] at 15.55 μmare strong. In A, on the other hand, only [Ne II] is immediately visible and far less bright than the continuum. In contrast to all five T Tauri edge-on discs observed with MIRI-MRS so far, there is no signature of polycyclic aromatic hydrocarbon (PAH) emission (expected to peak at 6.2, 7.7, and 11.3 μm; see Dartois et al. 2025 for a template) in either source. The edge-on configuration of B makes ices visible in the spectrum as absorption bands, which we show as coloured shaded areas. In the following, we characterise and discuss the spectral features from the molecular (Section 3.1) and the atomic ions emission lines (Section 3.2) to the ice features in the secondary in more detail (Section 3.3).
3.1 Gas lines
Figure 2 shows the continuum-subtracted spectrum of HK Tau A (top panel, dark grey) and B (bottom panel) in the 13.5–16.2 μm range. We selected this wavelength range because it is rich in molecular features (Carr & Najita 2008). While the total spectrum of B is richer in forbidden line emission and ice absorption bands, it is extremely poor in high-contrast molecular lines, such as those associated with the warm-water emission of other T-Tauri discs (e.g. Gasman et al. 2023; Grant et al. 2024; Temmink et al. 2024; Banzatti et al. 2025). This agrees with the results for other binary systems (Kurtovic et al. 2026; see Section 5.1). The continuum-subtracted spectrum of B shows some wiggles, including a bump at ~15 μm that is compatible with 12CO2. The noise level is too high for a confident claim of molecular emission, however. The only convincing feature in the secondary spectrum at this wavelength range is the [Ne III] line at 15.5 μm. On the other hand, the primary shows several gas emission lines: the strong 12CO2 Q-branch feature at ~15 μm and a few water lines are particularly straightforward to identify.
To constrain the molecular composition of HK Tau A, we fitted the continuum-subtracted spectrum with local thermodynamical equilibrium (LTE) 0D slab models (Grant et al. 2023; Perotti et al. 2023; Tabone et al. 2023). The 13.5–16.2 μm region, which falls in the band 3 medium and long, allowed us to study the emission of H2O, CO2, HCN, and OH. We set the spectral resolution of the slab models in accordance with the most recent estimates (2500 – Pontoppidan et al. 2024; Banzatti et al. 2025; see also the original commissioning estimates by Argyriou et al. 2023) and used the line transitions derived from the HITRAN database (Gordon et al. 2022). We used as line width ΔV = 4.71 km/s as in Salyk et al. (2008, 2011). Following Grant et al. (2023), we performed the fit by χ-squared minimisation iteratively and subtracted the contribution of each molecule after fitting for it, choosing common bright lines, in the order H2O, OH, CO2, and HCN. We detected emission from all of them and show the fitted spectrum in the top panel of Figure 2. Each slab model had three free parameters that were varied to fit the emission features: the temperature T, the column density N, and the emitting area πRslab2, which is characterised by an emitting radius Rslab. The minimum allowed temperature was 100 K, and the maximum emitting radius was 10 au. The results of the fit are reported in Table B.1: we found H2O at 725 K with a column density of 2.15 × 1018 cm−2, and CO2 at 350 K and a column density of 4.64 × 1017 cm−2. Based on Spitzer observations, Bosman et al. (2017) identified HK Tau as a CO2-only source (i.e. without water signatures). The sensitivity and spatial resolution of the Spitzer observations were not high enough to separate the two components of the binary system2, while JWST/MIRI now shows that the bulk of the CO2 emission comes from the primary. Furthermore, HK Tau A is rich in molecular emission in general and also shows water features. The 12CO2 Q-branch stands out in the spectrum compared to the water features, which agrees with the empirical definition of CO2-dominated sources. Despite the strong 12CO2 emission, however, no 13CO2 or other minor isotopologues were detected – unlike the case of MY Lup (Salyk et al. 2025).
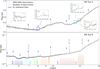 |
Fig. 1 Integrated MIRI-MRS spectrum of HK Tau A (top) and B (bottom) in grey. The black line represents the continuum baseline. Insets in the top panel zoom into wavelength regions that shows molecular emission from 12CO, H2O, 12CO2, and H2. The shaded bands in the bottom panel indicate the main ice absorption regions. H2 rotational lines are marked with blue ticks, and gas emission features are labelled where present. |
3.2 Forbidden emission lines from atomic ions
Figure 3 shows the continuum-subtracted spectrum of HK Tau A (dashed yellow line) and HK Tau B (solid pink line) in the wavelength ranges around the centre of the [Ar II], [Ne II], and [Ne III] forbidden emission lines. These lines trace ionised outflowing gas and are interpreted as signatures of disc winds and jets, depending on their velocity and morphology. In particular, [Ne II] is traditionally classified into a high or low- velocity component (HVC or LVC; associated with jets and winds, respectively, Pascucci et al. 2020), depending on whether the line centroid is shifted by more or less than 30 km/s.
The lines in HK Tau A are more noisy and contaminated, mostly by water lines, due to the rich molecular emission. Because [Ar II] and [Ne III] fall in water-rich wavelength ranges, Figure 3 also shows the best-fit water spectrum (shaded light blue) and the water-subtracted HK Tau A spectrum (dotted orange line). After the water-line subtraction, HK Tau A preserves emission associated with [Ar II], while the emission at the rest frame wavelength of [Ne III] is entirely removed. Therefore, we conclude that no [Ne III] emission comes from the primary disc.
To study the resulting forbidden line emission, we fitted a Gaussian profile to each line and determined their total flux and velocity relative to the rest wavelength. We report the results in Table 2. The primary shows redshifted [Ar II] and blueshifted [Ne II], and the secondary shows redshifted emission for all three lines, which is consistent with a radial velocity close to the rest velocity. The [Ne II] in HK Tau B shows an LVC wind with 16.3 km/s, while HK Tau A has a HVC with −35 km/s instead. The high inclination of HK Tau B is such that in the case of emission from a collimated flow, the measured velocity represents the projected velocity, thus requiring a correction factor of 1/ cos (i). This translates into a factor of 8 for the inclination of this source (corresponding to a velocity of ~130 km/s), which would lead this to be classified as an HVC jet rather than an LVC wind (see Pascucci et al. 2020 for examples of HVC sources that look like LVC in projection). However, if the emission comes from a less collimated flow (which can be determined from its morphology), then the correction factor may be lower and the flow may truly be an LVC. We discuss this further in Section 5.4.
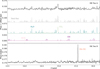 |
Fig. 2 Comparison of the continuum-subtracted spectrum of HK Tau A (top panel, dark grey) and B (bottom panel) in the 13.5–16.2 μm range. The primary shows emission lines from several molecular components (H2O, 12CO2, HCN, and OH), to which we show the total fit (light grey) and the single molecular components (coloured lines). On the other hand, the noise level in HK Tau B is too high for any confident claim of molecular emission, and only the bright [Ne III] line is visible. |
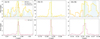 |
Fig. 3 Emission at the wavelength of [Ar II], [Ne II], and [Ne III] from HK Tau A (top panel, yellow line) and B (bottom panel, pink line), from left to right. For [Ar II] and [Ne III], the top panel includes the fitted water spectrum for HK Tau A, as the lines fall in a water-rich wavelength region. We also show the resulting water-subtracted spectra for HK Tau A (dashed orange line). The rest-frame wavelength is highlighted in green. |
3.3 Ice features in HK Tau B
The strongest ice absorption feature detected in the spectrum of HK Tau B is the bending mode of water at 6.2 μm. Water ice is also identified in the libration mode at 13.6 μm, although this band is significantly weaker. The second most evident absorption feature is CO2 at 15.2 μm, while the broad dip around 6.85 μm is usually associated with NH4+. Finally, between 8.3 and 9 μm, lies an absorption band that includes two separate dips at 8.50 and 8.85 μm. In the following, we discuss the details and implications of each of these signatures.
Water ice. In our spectrum, the bending mode of water is stronger than the libration mode. As pure water ices are expected to show the opposite behaviour, with a stronger libration than bending mode (Öberg et al. 2007), the 6.2 μm absorption feature is likely a blend of H2O and CH3OH;
NH4+. The broad 6.85 μm band likely includes a contribution by CH3OH, with its C–H deformation mode. This feature, however, might also be due to HCOOH, H2O, or NH3, together with the NH4+ bend (Keane et al. 2001; Schutte et al. 1996; Slavicinska et al. 2025). The production of NH4+ from the dissociation of NH4CN is associated with OCN− absorption at around 4.6 μm (Gerakines et al. 2024), which is indeed detected in the NIRSpec spectrum of HK Tau B (Smith et al., in prep.);
CH4. In contrast to other sources (e.g. HH 48 NE; Sturm et al. 2023a), the CH4 feature at 7.71 μm is not detected with confidence; we highlight the expected location in the spectrum, which shows a barely visible dip;
Silicate feature and C-H bend. The absorption band at 8.3–9 μm is consistent with the silicate stretching band that usually peaks at 9.7 μm in systems at lower inclinations (Henning 2010, visible in HK Tau A in emission with the characteristic shape). This shift to shorter wavelengths was also observed in HH 48 NE (Sturm et al. 2024) and was predicted by Sturm et al. (2023b) with radiative transfer models: the offset is due to an additional emission component from the inner disc, which is scattered in a similar way to the continuum. We note that inclination has been shown to affect the shape and wavelength of the water-ice bands as well (Martinien et al. 2025). It is nonetheless tempting to try and attribute the two distinct peaks in HK Tau B to specific ice features: their weakness, however, makes it difficult to associate them with anything beyond the general C–H bond bending mode around 8.6 μm.
Forbidden atomic line fluxes and velocities in HK Tau A and B.
4 Extended H2 emission
We detected extended emission for the H2 transitions from S(1) to S(5) around both sources, and also the other three that fall in the MIRI-MRS range, S(6) to S(8), around HK Tau B. Figure 4 presents the moment 0 maps at the three longest wavelengths, corresponding to S(3), S(2), and S(1) from left to right, which fall in band 2 medium (9.665 μm), 3 short (12.279 μm), and 3 long (17.035 μm), respectively (for the moment maps of all H2 transitions, see Appendix C).
The most prominent feature of the extended emission in Figure 4 is the X-shaped structure around HK Tau B: the location and inclination of the disc are compatible with this emission originating from the surface of the disc around HK Tau B, that is, tracing the disc surface itself or a wind. We computed the semi-opening angle by rotating the S(1) moment 0 map and determining the maximum brightness at 1.5″ from HK Tau B, which was the largest distance with maxima at either side of the emission. We found a semi-opening angle of 77° ± 13° for the north-west and 69° ± 12° for the south-east surface. The higher brightness of the north-east filament (most clearly seen in S(1) and S(3), but present at all wavelengths) is likely due to the three-dimensional position of the sources: as noted by Koresko (1998), and visible already in the scattered-light image presented by McCabe et al. (2011), the disc around HK Tau B is not symmetric, and the north side is brighter than the south side. This is compatible with a higher irradiation from HK Tau A. The brightest spot in scattered light is on the north-eastern side of the disc, at the same location as the brightest emission in the H2 map. To investigate the nature of the X-shaped H2 emission, we compared its extent with that of the ALMA continuum and CO, overlaid in Figure 4. As expected in edge-on discs, the continuum emission is concentrated in a horizontally thin structure that traces the dust-rich midplane. The Keplerian CO is slightly more extended vertically and radially, but still less so than H2. Furthermore, no signatures of the X-shape are detected, which points in the direction of the H2 being entrained in a wind and rather than sitting at the disc surface. To constrain the temperature T and column density N of the H2, we performed a rotational diagram analysis (see Section 4.2) at each pixel of the moment 0 maps. As the H2 transitions span from channel 1 short to channel 3 long (subbands 1A to 3 C), the resulting maps have different pixel sizes and angular resolutions. For this reason, we performed a PSF matching and resampling algorithm before the fit.
4.1 PSF matching and resampling
The PSF of MIRI-MRS is larger at longer wavelengths. As the H2 rotational lines span from 5.053 to 17.035 μm, the maps have different PSFs (and therefore, different resolutions) that need to be matched before any spatial analysis. As we are interested in the extended emission between the two sources and therefore did not need a particularly high spatial resolution, we decided to match the lowest emission (corresponding to the S(1) line). This also prevented the introduction of sampling artifacts. We downgraded the resolution of all lines to that of S(1) by convolving the maps with an appropriate (i.e. FWHM-based) wavelength-dependent Gaussian kernel. When all maps had the same resolution, we ensured a homogeneous sampling by interpolating them on a same grid with even spacing. We chose to have four pixels per beam, leading to a sampling of 200 mas per pixel.
4.2 H2 rotational diagram
To obtain an estimate of the gas temperature and column density, we performed a rotational diagram analysis (Goldsmith & Langer 1999) on the H2 rotational lines. This analysis can be applied to populations of molecules under the assumption of (1) local thermodynamic equilibrium (LTE), (2) optically thin emission, and (3) that the column of H2 contributing to the emission has a single T and N at all wavelengths. In LTE (1), the column density at the upper state excitation level Nu can be written as
![Mathematical equation: $\[N_u=\frac{N_{\text {tot }}}{Q(T)} g_u ~\exp \left(-\frac{E_u}{k T}\right),\]$](/articles/aa/full_html/2026/07/aa59664-26/aa59664-26-eq10.png) (1)
(1)
where N is the total column density, Q(T) is the partition function at the excitation temperature T, Eu is the upper state with energy with statistical weight gu, and k is the Boltzmann constant. Furthermore, if the emission is optically thin (2), the upper state column density is directly linked to the observed flux Fu,
![Mathematical equation: $\[N_u=\frac{4 \pi F_u}{A_u h \nu \Omega},\]$](/articles/aa/full_html/2026/07/aa59664-26/aa59664-26-eq11.png) (2)
(2)
where Ω is the emitting area, and Au is the Einstein rate coefficient for spontaneous emission. Substituting Nu in Equation (2), we can then write a linear relation (in logarithmic space) between Fu and Eu/k,
![Mathematical equation: $\[\ln \left(\frac{4 \pi F_u}{A_u h \nu \Omega} \frac{1}{g_u}\right)=-\frac{1}{T} \frac{E_u}{k T}+\ln \left(\frac{N_{\mathrm{tot}}}{Q(T)}\right)\]$](/articles/aa/full_html/2026/07/aa59664-26/aa59664-26-eq12.png) (3)
(3)
with a slope m = −1/T and an intercept q = ln(Ntot/Q(T)). The transitional constants Eu, gu, and Au used in the rotational diagram analysis for the H2 lines are given in Table C.1. The (normal) partition function Q(T) was taken from Popovas & Jørgensen (2016)3.
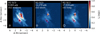 |
Fig. 4 Moment 0 maps of the S(1), S(2), and S(3) H2 extended lines. The yellow and black stars mark the coordinates of the centre of HK Tau A and B. The white circles in the bottom left corner of each panel show the full width at half maximum of the PSF at the corresponding band. North is up, and east is to the left. The solid pink and dashed purple contours represent the extent of the ALMA continuum emission at 0.87 mm (published in Villenave et al. 2020) and the peak emission map of CO J=2–1 (published in Rota et al. 2022; estimated with the quadratic method of bettermoments (Teague & Foreman-Mackey 2018; Teague 2019)). |
4.3 Temperature and column density 2D maps
When all maps had the same resolution, number of pixels, and pixel sampling, we performed a one-component rotational diagram analysis in each pixel for all transitions to obtain a temperature and column density value. The top row of Figure 5 shows the resulting 2D T (left) and N (centre) maps, next to the S(1) emission to facilitate comparison (right). In the bottom row, we report the result of the fit for four specific locations (marked in the moment 0 map by coloured squares) to validate the assumption of one-component fits. The maps are centred on the location of HK Tau A, marked by the yellow star, while the centre of HK Tau B is represented by the black star. The white contours show the extent of the ALMA continuum emission. We applied a mask on the line intensity to remove all pixels with a flux lower than 0.1 mJy, and we discarded all pixels with fewer than three detected H2 lines to ensure a more reliable fit.
The temperature in the region around HK Tau B in which the continuum emission originates is about 800 K, which extends to the X structure visible in the S(1) line centred in B. Parallel to the midplane of the disc around B lie two lobes with a lower temperature of around 500 K. This lower temperature might be a result of the system geometry, with the disc obscuring its surrounding exactly beyond the major axis of the disc. The column density in the higher-temperature region is around 2 × 1021 cm−2, and it varies across the system between ~0.5–2 × 1021 cm−2 in general. The temperature is in line with that of other Class II sources showing extended H2 emission, varying between ~400 and ~1100 K (Narang et al. 2026). The column density, on the other hand, is somewhat higher than the maximum value in the sample of Narang et al. (2026) (log10(N) = 19.5).
5 Discussion
5.1 The impact of the disc inclination on the molecular emission
The dichotomy in molecular features of the two sources, with a line-rich primary and line-poor (except for extended emission) secondary, is similar to the trend found by Kurtovic et al. (2026) for the three binary systems VW Cha, WX Cha, and RW Aur, and to the suggested case of DF Tau (Grant et al. 2024). In all of these systems, the molecular emission at MIRI-MRS wavelengths is dominated by the primary star, which is brighter by more than a factor of 7 in flux with respect to the secondary on average. This evidence has been interpreted as a consequence of secular evolution, with tidal interactions truncating the discs (more effectively around the secondaries) and therefore draining the supply of molecules to the inner disc, where they then emit at MIRI-MRS wavelengths.
HK Tau shares the line-rich primary and line-poor secondary behaviour, but differs fundamentally from the systems mentioned above in that (i) the mass ratio is close to one, and (ii) the secondary is seen edge-on. This has two main implications: on the one hand, with the mass ratio being close to unity, the distinction between primary and secondary is blurrier and ultimately determined by the inclination, which affects the luminosity of the two sources. On the other hand, the high inclination is also likely to affect the luminosity of the lines originating in the inner disc, as they have to go through multiple scatterings in the thick disc midplane.
To assess the impact of the disc inclination on the expected molecular emission, we produced synthetic MIR spectra from a fiducial T Tauri disc model (published in Arabhavi et al. 2026 and computed with ProDimo, Woitke et al. 2009), running radiative transfer models with Fast Line Tracers (FLiTs; Woitke et al. 2018) to calculate the spectra at different viewing angles. Figure 6 shows the expected spectral features in the 13.5–16 μm wavelength range for inclinations increasing from 0° to 82° (corresponding to the inclination of HK Tau B), without accounting for scattering effects. The molecular flux is reduced at increasing inclination, but remains detectable up to ~75°. At nearly edge-on configurations (>75°), the molecular lines instead disappear from the spectrum, which only shows signatures of ionised atomic emission. This occurs because the atomic ion emission originates in the upper layers of the disc, either on the disc surface itself or in winds and outflows, as opposed to the molecular component, which instead comes from the midplane. As a consequence, the molecular emission is hidden behind a larger amount of material compared to the atomic ions, which remain visible (albeit damped) even in the edge-on configuration. Interestingly, the inclination threshold to maintain molecular emission coincides with the sweet spot for the detection of ice absorption features: this means that only sources at the interface between the face-on and edge-on configuration can show both gas- and ice-phase features.
It is worth noting that other edge-on sources in the literature do show scattered molecular emission. Nonetheless, their spectra remain poorer in that only CO emission is present (Arulanantham et al. 2024; Sturm et al. 2024; Bergner et al. 2026), with the exception of Tau 042021, where both CO and water are detected (Arulanantham et al. 2024). This suggests that in HK Tau B, where no molecular emission is present at all, a combination of the high inclination and other geometrical effects (e.g. misaligned inner disc or substructures) results in reduced scattering. The line-poor spectrum of RW Aur B (Kurtovic et al. 2026) has been interpreted as a consequence of a cavity in the inner disc. This hypothesis might hold for HK Tau B as well and is supported by a marginal rise at the edges of the ALMA radial brightness profile (Villenave et al. 2020).
The HK Tau system provides an unprecedented opportunity: the very close spectral type of the two sources combined with the complementary inclinations and reduced scattering effects allow us a simultaneous view of the gaseous and solid components of the disc under the assumption that the two sources underwent a similar evolution. To probe the chemical similarity between HK Tau A and B, we can exploit the edge-on nature of B to search for the icy counterpart of the molecules emitting in A. This is however non-trivial: while we do see H2O and CO2 ices at 6, 13.6, and 15 μm, detecting signatures of OH and HCN ice is less straightforward. OH is a minor component in solid phases, emitting a weak signal; the presence of HCN instead is linked to NH4+ at 6.964 μm, which is detected in absorption (see Figure 1), and OCN− at 4.6 μm (Lacy et al. 1984). Despite these limitations, the gas- and ice-phase molecular signatures in the two sources indicate a similar chemical composition.
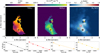 |
Fig. 5 Pixel-by-pixel temperature (left) and total column density (centre) maps of the extended H2 emission in the surroundings of HK Tau B, compared to the S(1) moment 0 map (right). The maps are centred at the location of HK Tau A, marked by the yellow star, and the black star represents the location of HK Tau B. The white contours represent the extent of the ALMA continuum emission as in Figure 4. The bottom row shows the rotational diagram at each of the four locations marked in the S(1) moment 0 map by the coloured squares. |
 |
Fig. 6 Synthetic spectra of a fiducial T Tauri disc model (Arabhavi et al. 2026) showing the impact of the disc inclination on the molecular features at 13.5–16 μm. |
5.2 Other spectral features: H2 and forbidden lines
The spectra of HK Tau A and B differ not only in the molecular lines, but also in the extended H2 and forbidden line emission. H2 is visible in the spectra of both stars, although the relative intensity of the lines is higher by between a factor of 5 and 10 in the primary. The spatial extension of the H2 emission is also different: in the moment 0 maps, it appears far brighter and more extended around B, and indeed, it traces not only the immediate surroundings of the central star, but also a radial extent about three times that of the ALMA continuum. The shape of the emission itself is expected to be due to the geometry, as the X-shape is a signature of the high inclination. If the H2 emission were similarly strong around the primary as well, however, we would still expect to see it spread over a larger area in the moment 0 maps.
The spectra also diverge in the presence and intensity of the forbidden atomic lines. While HK Tau B shows bright [Ne II], [Ne III], and [Ar II] emission, only [Ne II] and [Ar II] are present in HK Tau A. [Ne II] has been routinely detected in several sources since the Spitzer/IRS surveys (Pascucci et al. 2007; Lahuis et al. 2007; Ratzka et al. 2007; Najita et al. 2010; Güdel et al. 2010; Espaillat et al. 2013), and in later observations at higher spectral resolution, which enabled a distinction between a wind and jet origin (see e.g. Pascucci et al. 2020). On the other hand, [Ne III] is harder to detect and remained rare in the Spitzer era (Lahuis et al. 2007; Najita et al. 2010; Szulágyi et al. 2012; Espaillat et al. 2013); its emitting wavelength of 15.55 μm overlaps with warm (~ 600 K) water features, which makes it challenging to disentangle in water-rich sources even with JWST. The case of HK Tau, with a water-rich primary and line-poor secondary, is a good example of this issue, in a similar fashion to the binary sample of Kurtovic et al. (2026). This work therefore adds HK Tau B to the sample of line-poor Class II sources with detected [Ne III] emission (alongside T Cha, Bajaj et al. 2024, VW Cha BC, and RW Aur B, Kurtovic et al. 2026). As shown in Figure 6, forbidden lines are expected to remain visible (although with potentially different fluxes) at all inclinations. Because these lines trace winds and jets, we suggest that if a wind is emitted by HK Tau A, it is too cold or dense to be ionised and brightly emitting. Pascucci et al. (2020, 2023) suggested that the presence of [Ne II] in an HVC might be evidence for a dense inner wind blocking the X-rays from ionising the Ne in the extended wind, therefore rendering the LVC absent.
5.3 Forbidden line ratios
The detection and flux measurement of [Ne III] is especially relevant in comparison with [Ne II] for studying the high-energy radiation absorbed by the emitting material in the inner disc in the context of photoevaporation. Combined with [Ar II], the three atomic lines trace either high- or low-velocity winds, depending on the strength of the disc accretion rate (high-velocity for ![Mathematical equation: $\[\dot{M}>10^{-8} \mathrm{M}_{\odot} \mathrm{yr}^{-1}\]$](/articles/aa/full_html/2026/07/aa59664-26/aa59664-26-eq13.png) ; Pascucci et al. 2020; low-velocity otherwise; Hollenbach & Gorti 2009; Szulágyi et al. 2012; Espaillat et al. 2013; Sellek et al. 2024). The values of the [Ne III]/[Ne II] and [Ne II]/[Ar II] line ratios are predicted to depend on the dominant source of irradiation: from photoevaporative models, we know that it is easier to produce [Ne III] over [Ne II] with extreme-UV (EUV) spectra, while X-ray ionisation produces multiply charged ions that then rapidly recombine and exchange charge with hydrogen atoms, leading to a higher [Ne II] production (Glassgold et al. 2007). As a consequence, we expect [Ne III]/[Ne II] < 1 if X-ray irradiation dominates the disc ionisation, while on the other hand, [Ne III]/[Ne II] > 1 would be indicative of an EUV-driven wind (Hollenbach & Gorti 2009; Espaillat et al. 2013; Bajaj et al. 2024). [Ne II]/[Ar II], on the other hand, is expected to be <2.5 for EUV or soft X-ray radiation fields and >2.5 for hard X-rays (Espaillat et al. 2023).
; Pascucci et al. 2020; low-velocity otherwise; Hollenbach & Gorti 2009; Szulágyi et al. 2012; Espaillat et al. 2013; Sellek et al. 2024). The values of the [Ne III]/[Ne II] and [Ne II]/[Ar II] line ratios are predicted to depend on the dominant source of irradiation: from photoevaporative models, we know that it is easier to produce [Ne III] over [Ne II] with extreme-UV (EUV) spectra, while X-ray ionisation produces multiply charged ions that then rapidly recombine and exchange charge with hydrogen atoms, leading to a higher [Ne II] production (Glassgold et al. 2007). As a consequence, we expect [Ne III]/[Ne II] < 1 if X-ray irradiation dominates the disc ionisation, while on the other hand, [Ne III]/[Ne II] > 1 would be indicative of an EUV-driven wind (Hollenbach & Gorti 2009; Espaillat et al. 2013; Bajaj et al. 2024). [Ne II]/[Ar II], on the other hand, is expected to be <2.5 for EUV or soft X-ray radiation fields and >2.5 for hard X-rays (Espaillat et al. 2023).
Figure 7 shows the [Ne III]/[Ne II] (top panel) and [Ne II]/[Ar II] (bottom panel) ratios for HK Tau A and B, highlighted with the orange shaded regions, compared to all other protoplanetary discs with published line fluxes in the literature4. The horizontal dashed lines represent the [Ne III]/[Ne II] = 1 and [Ne II]/[Ar II] = 2.5 thresholds. Binary systems are marked with a black outline. With a [Ne III]/[Ne II] ratio of 0.36, HK Tau B falls well within the X-ray irradiation regime. This seems to be the most frequently found in discs, with only a few (GQ Lup and VW Cha BC, Arulanantham et al. 2025 and Kurtovic et al. 2026, respectively) showing neon ratios above 0.5. For [Ne II]/[Ar II], which we detect for both HK Tau A and B, we recovered 3.3 and 2.7, respectively, which places both of them above the 2.5 threshold. This indicates hard X-rays and is consistent with a sufficiently dense inner wind to absorb them.
5.4 A wind originating from HK Tau B
The X-shape of the extended H2 emission centred in HK Tau B, recovered also in the derived temperature and density structure, is consistent with tracing a wind with a wide opening angle (77° ± 13° on the north-west and 69° ± 12° in the south-east surface) launching from the upper disc layer. This interpretation is further supported by the difference in the morphology of the H2 compared to the Keplerian CO, which is significantly less extended (see Figure 4).
To investigate the disc or wind origin, we inspected the moment 8 map of [Ne II] (Figure 8). In the surroundings of HK Tau B, [Ne II] has a hourglass shape, perpendicular to the orientation of the continuum; furthermore it is significantly less extended than the H2. This suggests not scattered emission, but rather that the H2 traces the base of a wind originating from HK Tau B. Furthermore, the broad shape of the [Ne II] emission is more compatible with a wind than a high-velocity collimated jet. This implies that the caveat on the velocity measurement mentioned in Section 3.2 on the possibility of a HVC seen as LVC because of inclination effects does not apply. The average H2 temperature and column density are also consistent with a wind origin. In this interpretation, the large opening angles we recovered would suggest that the H2 is efficiently destroyed in the wind and is therefore only seen near its base. Another argument in favour of H2 being entrained in a wind is that its temperature is higher than the escape temperature Tesc (Owen et al. 2012); for example, at the location of the red square in Figure 5, Tesc ≃ 100 K, while the H2 temperature is higher by a factor of 8.
Traditionally, H2 emission has preferentially been interpreted as a signpost for magnetohydrodynamic disc winds. However, Nakatani et al. (2026) have shown that the observed H2 extended emission can be broadly reproduced by photoevaporation, both in its X-shaped morphology and in the line fluxes. Their radiation hydrodynamics simulations, while not intended to fit any particular source, recovered opening angles and excitation temperatures remarkably similar to the observations of Tau 042021 (Arulanantham et al. 2024) and SY Cha (Schwarz et al. 2025), suggesting that photoevaporation is indeed a viable explanation. While the opening angles recovered from the theoretical models of Nakatani et al. (2026) span between 37 and 50°, which is significantly smaller than the ~70°–77° we find in HK Tau B, we note that the authors did not conduct a full parameter space exploration, and larger opening angles are not ruled out a priori. Furthermore, an increased FUV luminosity is expected to broaden the H2 dissociation front, therefore widening the opening angle; this is consistent with the north-western side of the disc having a larger opening angle, as is illuminated by HK Tau A, as opposed to the south-eastern side. While magnetohydrodynamic winds remain a valid explanation for the observed H2 emission, we emphasise that a photoevaporative origin cannot be excluded.
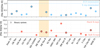 |
Fig. 7 Comparison of the [Ne III]/[Ne II] (top panel) and [Ne II]/[Ar II] (bottom panel) line ratios for HK Tau A and B (orange shaded region) and the other published detections. Binary systems are marked with a black contour. The dashed coloured lines show the line ratio thresholds for determining the dominant irradiation source. Sz Cha is taken from Espaillat et al. (2023), T Cha is taken from Bajaj et al. (2024), RW Aur B and VW Cha BC are taken from Kurtovic et al. (2026), and all others are taken from Arulanantham et al. (2025). |
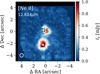 |
Fig. 8 Moment 8 map of the [Ne II] emission around HK Tau A (yellow star) and B (white star). |
5.5 Lack of PAH emission
The lack of PAH emission in HK Tau B contrasts with the recently growing evidence of a regular detection of PAH features in edge-on protoplanetary discs. While face-on sources show limited to no evidence of PAHs (with a detection rate of ~8% in discs around T Tauri stars; Geers et al. 2006), highly inclined systems observed with MIRI-MRS indeed display strong PAH features, especially at 8 and 11 μm. This is the case of Tau 042021 (88°, Arulanantham et al. 2024), HH 48 NE (82.3°, Sturm et al. 2024), and T Cha (73°, Bajaj et al. 2024; Arun 2025).
The PAHs emit in the infrared when exposed to UV radiation, which can explain the lack of features in discs around brown dwarfs (Perotti et al. 2026), very low-mass stars (Arabhavi et al. 2025), and low-mass T Tauri stars as opposed to intermediate-mass T Tauris (PAHs detected in 40 % of the observed discs; Valegård et al. 2021) and Ae/Be Herbig stars (PAHs detected in 70% of the targets; Acke et al. 2010). The lower stellar emission at UV wavelengths combined with depletion of gas-phase PAHs by several orders of magnitude is commonly indicated to be the reason for the low detection rates in discs around low-mass stars. On the other hand, it is debated whether the disc inclination would impact the presence of PAH emission. A possible explanation might be localised emission, although the model of Sturm et al. (2024) predicts that the PAHs in HH 48 NE would be observable even in a face-on configuration. Another option is the disc geometry favouring the exposure of PAHs to UV radiation (e.g. the presence of a cavity in the case of HH 48 NE; Sturm et al. 2023b), as well as high UV radiation from the companion under certain orientations or a higher accretion rate. All of these possibilities require further exploration with source-specific modelling. In this context, HK Tau B stands out as the only T Tauri edge-on source observed at MIRI-MRS wavelengths that shows no signs of PAH emission. We will expand the statistics in a forthcoming paper, which we refer to for a deeper analysis of the presence of PAH features in edge-on T Tauri stars.
6 Conclusions
We have presented JWST/MIRI-MRS observations of the binary system HK Tau, which is composed of a low-inclination primary and close-to-edge-on secondary. We analysed the mid-infrared spectra of the two sources and discussed their molecular and atomic emission features, as well as ice absorption bands visible in the secondary. Our main results are listed below:
While HK Tau A shows a line-rich spectrum (especially CO2), HK Tau B is stunningly line poor, except for atomic ions and H2 emission. This is likely a consequence of the geometrical configuration, as we showed that sources with inclinations >75° are expected to lose molecular emission signatures while maintaining ionised atomic lines that originate in the upper layers of the disc;
The high inclination of HK Tau B allowed us to detect ice absorption bands: we confidently detected H2O at 6 and 13.6 μm, CO2 at 15 μm, and NH4+ at 6.85 μm. We tentatively detected CH4 at 7.6 μm;
Under the assumption of coeval sources and similar disc evolution, the complementary inclination of the two sources allowed us to simultaneously probe the solid- and gas-phase content of the system. The MIR spectra suggest a similar chemical composition with significant water and CO2;
The H2 emission is extended in both sources. The X-shaped emission centred in B shows thermochemical conditions compatible with a wind (photoevaporative or MHD) origin. The asymmetric wide opening angle (77° and 69° for the upper and lower surfaces, respectively) suggests that the outflowing H2 is efficiently destroyed in the wind and is therefore only seen near the wind base;
We detected [Ne II] and [Ar II] in both sources, as well as [Ne III] in HK Tau B. The hourglass shape of the [Ne II] emission further points in the direction of a wind irradiating from HK Tau B. The line ratios place HK Tau A and B in the X-ray dominated irradiation regime;
Unlike all other T Tauri edge-on protoplanetary discs observed with MIRI-MRS so far, HK Tau B shows no sign of PAH emission. Larger samples of edge-on discs are needed to place this result in context.
The peculiar configuration of HK Tau offers the unprecedented opportunity of a simultaneous view on two coeval almost identical mass pre-main-sequence objects with complementary inclinations. The high angular resolution of JWST/MIRI-MRS has allowed us to separate the contributions of the two sources, shedding light on molecular diversity, atomic emission lines, and wind tracers. With this work, we proceed in the JWST/MIRI characterisation of multiple systems and edge-on discs, and we highlight the need for larger statistical samples to interpret our results in a population framework.
Acknowledgements
We thank an anonymous referee for constructive input that has helped us improve the quality and clarity of the manuscript. AS thanks Jennifer Bergner, Gabriele Cugno, Jenny Frediani, Ryohei Nakatani, and Tushar Suhasaria for interesting discussions. This work is based on observations made with the NASA/ESA/CSA James Webb Space Telescope. The data were obtained from the Mikulski Archive for Space Telescopes at the Space Telescope Science Institute, which is operated by the Association of Universities for Research in Astronomy, Inc., under NASA contract NAS 5-03127 for JWST. These observations are associated with program #1282. The specific observations analysed can be accessed via https://doi.org/10.17909/p7x7-ps95. STScI is operated by the Association of Universities for Research in Astronomy, Inc., under NASA contract NAS5–26555. Support to MAST for these data is provided by the NASA Office of Space Science via grant NAG5–7584 and by other grants and contracts. The following National and International Funding Agencies funded and supported the MIRI development: NASA; ESA; Belgian Science Policy Office (BELSPO); Centre Nationale d’Etudes Spatiales (CNES); Danish National Space Centre; Deutsches Zentrum fur Luft- und Raumfahrt (DLR); Enterprise Ireland; Ministerio De Economía y Competividad; Netherlands Research School for Astronomy (NOVA); Netherlands Organisation for Scientific Research (NWO); Science and Technology Facilities Council; Swiss Space Office; Swedish National Space Agency; and UK Space Agency. This paper makes use of the following ALMA data: ADS/JAO.ALMA#2016.1.00460.S, ADS/JAO.ALMA#2018.1.00771.S. ALMA is a partnership of ESO (representing its member states), NSF (USA) and NINS (Japan), together with NRC (Canada), NSTC and ASIAA (Taiwan), and KASI (Republic of Korea), in cooperation with the Republic of Chile. The Joint ALMA Observatory is operated by ESO, AUI/NRAO and NAOJ. The National Radio Astronomy Observatory is a facility of the National Science Foundation operated under cooperative agreement by Associated Universities, Inc. G.P. gratefully acknowledges support from the Carlsberg Foundation, grant CF23-0481 and from the Max Planck Society. T.H. acknowledges support from the European Research Council under the Horizon 2020 Framework Program via the ERC Advanced Grant Origins 83 24 28. E.v.D. acknowledges support from the ERC grant 101019751 MOLDISK and the Danish National Research Foundation through the Center of Excellence “InterCat” (DNRF150). A.D.S., M.T., and M.V. acknowledge support from the ERC grant 101019751 MOLDISK. I.K., A.M.A., and E.v.D. acknowledge support from grant TOP-1 614.001.751 from the Dutch Research Council (NWO). A.C.G. acknowledges support from PRIN-MUR 2022 20228JPA3A “The path to star and planet formation in the JWST era (PATH)” funded by NextGeneration EU and by INAF-GoG 2022 “NIR-dark Accretion Outbursts in Massive Young stellar objects (NAOMY)” and Large Gran INAF-2024 “Spectral Key fea-tures of Young stellar objects: Wind-Accretion LinKs Explored in the infraRed (SKYWALKER)”. V.C. acknowledges funding from the Belgian F.R.S.-FNRS. T.K. acknowledges support from STFC Grant ST/Y002415/1. L.M.S. has received funding from the European Research Council (ERC) under the European Union’s Horizon 2020 research and innovation programme (PROTOPLANETS, grant agreement No. 101002188). B.T. is a Laureate of the Paris Region fellowship program, which is supported by the Ile-de-France Region and has received funding under the Horizon 2020 innovation framework program and Marie Sklodowska-Curie grant agreement no. 945298.
References
- Acke, B., Bouwman, J., Juhász, A., et al. 2010, ApJ, 718, 558 [Google Scholar]
- Aikawa, Y., Kamuro, D., Sakon, I., et al. 2012, A&A, 538, A57 [NASA ADS] [CrossRef] [EDP Sciences] [Google Scholar]
- Akeson, R. L., Jensen, E. L. N., Carpenter, J., et al. 2019, ApJ, 872, 158 [Google Scholar]
- Appenzeller, I., Bertout, C., & Stahl, O. 2005, A&A, 434, 1005 [NASA ADS] [CrossRef] [EDP Sciences] [Google Scholar]
- Arabhavi, A. M., Kamp, I., Henning, T., et al. 2025, A&A, 699, A194 [NASA ADS] [CrossRef] [EDP Sciences] [Google Scholar]
- Arabhavi, A. M., Kamp, I., Dishoeck, E. F. v., et al. 2026, A&A, 708, A82 [NASA ADS] [CrossRef] [EDP Sciences] [Google Scholar]
- Argyriou, I., Glasse, A., Law, D. R., et al. 2023, A&A, 675, A111 [NASA ADS] [CrossRef] [EDP Sciences] [Google Scholar]
- Artymowicz, P., & Lubow, S. H. 1994, ApJ, 421, 651 [Google Scholar]
- Arulanantham, N., McClure, M. K., Pontoppidan, K., et al. 2024, ApJ, 965, L13 [NASA ADS] [CrossRef] [Google Scholar]
- Arulanantham, N., Salyk, C., Pontoppidan, K., et al. 2025, AJ, 170, 67 [Google Scholar]
- Arun, R. 2025, AJ, 170, 196 [Google Scholar]
- Bajaj, N. S., Pascucci, I., Gorti, U., et al. 2024, AJ, 167, 127 [NASA ADS] [CrossRef] [Google Scholar]
- Ballering, N. P., Cleeves, L. I., Boyden, R. D., et al. 2025, ApJ, 979, 110 [Google Scholar]
- Banzatti, A., Salyk, C., Pontoppidan, K. M., et al. 2025, AJ, 169, 165 [Google Scholar]
- Bergner, J. B., Arulanantham, N., Dartois, E., et al. 2026, ApJ, 1002, 17 [Google Scholar]
- Boogert, A. C. A., Pontoppidan, K. M., Knez, C., et al. 2008, ApJ, 678, 985 [Google Scholar]
- Bosman, A. D., Bruderer, S., & van Dishoeck, E. 2017, A&A, 601, A36 [NASA ADS] [CrossRef] [EDP Sciences] [Google Scholar]
- Bouwman, J., Lawson, W. A., Dominik, C., et al. 2006, ApJ, 653, L57 [NASA ADS] [CrossRef] [Google Scholar]
- Braun, T. A. M., Yen, H.-W., Koch, P. M., et al. 2021, ApJ, 908, 46 [NASA ADS] [CrossRef] [Google Scholar]
- Bushouse, H., Eisenhamer, J., Dencheva, N., et al. 2024, https://doi.org/10.5281/zenodo.20058613 [Google Scholar]
- Carr, J. S., & Najita, J. R. 2008, Science, 319, 1504 [Google Scholar]
- Christiaens, V., Gomez-Gonzalez, C. A., Farkas, R., et al. 2023, JOSS, 8, 4774 [Google Scholar]
- Christiaens, V., Samland, M., Gasman, D., Temmink, M., & Perotti, G. 2024, ASCL [record ascl:2403.007] [Google Scholar]
- Dartois, E., Noble, J. A., McClure, M. K., et al. 2025, A&A, 698, A8 [NASA ADS] [CrossRef] [EDP Sciences] [Google Scholar]
- Duchêne, G., Ménard, F., Stapelfeldt, K., & Duvert, G. 2003, A&A, 400, 559 [NASA ADS] [CrossRef] [EDP Sciences] [Google Scholar]
- Erb, D. 2022, https://doi.org/10.5281/zenodo.7255880 [Google Scholar]
- Espaillat, C., Furlan, E., D’Alessio, P., et al. 2011, ApJ, 728, 49 [NASA ADS] [CrossRef] [Google Scholar]
- Espaillat, C., Ingleby, L., Furlan, E., et al. 2013, ApJ, 762, 62 [NASA ADS] [CrossRef] [Google Scholar]
- Espaillat, C. C., Thanathibodee, T., Pittman, C. V., et al. 2023, ApJ, 958, L4 [NASA ADS] [CrossRef] [Google Scholar]
- Evans, N. J., Dunham, M. M., Jørgensen, J. K., et al. 2009, ApJS, 181, 321 [NASA ADS] [CrossRef] [Google Scholar]
- Furlan, E., Hartmann, L., Calvet, N., et al. 2006, ApJS, 165, 568 [CrossRef] [Google Scholar]
- Furlan, E., Watson, D. M., McClure, M. K., et al. 2009, ApJ, 703, 1964 [Google Scholar]
- Gaia Collaboration (Smart, R. L., et al.) 2021, A&A, 649, A6 [EDP Sciences] [Google Scholar]
- Gasman, D., van Dishoeck, E., Grant, S., et al. 2023, A&A, 679, A117 [NASA ADS] [CrossRef] [EDP Sciences] [Google Scholar]
- Geers, V. C., Augereau, J.-C., Pontoppidan, K. M., et al. 2006, A&A, 459, 545 [NASA ADS] [CrossRef] [EDP Sciences] [Google Scholar]
- Gerakines, P. A., Yarnall, Y. Y., & Hudson, R. L. 2024, Icarus, 413, 116007 [Google Scholar]
- Glassgold, A. E., Najita, J. R., & Igea, J. 2007, ApJ, 656, 515 [NASA ADS] [CrossRef] [Google Scholar]
- Goldsmith, P. F., & Langer, W. D. 1999, ApJ, 517, 209 [Google Scholar]
- Gomez-Gonzalez, C. A., Wertz, O., Absil, O., et al. 2017, AJ, 154, 7 [NASA ADS] [CrossRef] [Google Scholar]
- Gordon, I., Rothman, L., Hargreaves, R., et al. 2022, JQSRT, 277, 107949 [CrossRef] [Google Scholar]
- Grant, S. L., van Dishoeck, E., Tabone, B., et al. 2023, ApJ, 947, L6 [NASA ADS] [CrossRef] [Google Scholar]
- Grant, S. L., Kurtovic, N. T., van Dishoeck, E., et al. 2024, A&A, 689, A85 [NASA ADS] [CrossRef] [EDP Sciences] [Google Scholar]
- Güdel, M., Lahuis, F., Briggs, K. R., et al. 2010, A&A, 519, A113 [CrossRef] [EDP Sciences] [Google Scholar]
- Henning, T. 2010, ARAA, 48, 21 [Google Scholar]
- Henning, T., Kamp, I., Samland, M., et al. 2024, PASP, 136 [Google Scholar]
- Hollenbach, D., & Gorti, U. 2009, ApJ, 703, 1203 [NASA ADS] [CrossRef] [Google Scholar]
- Kamp, I., Henning, T., Arabhavi, A. M., et al. 2023, Faraday Discuss., 245, 112 [NASA ADS] [CrossRef] [Google Scholar]
- Keane, J. V., Tielens, A. G. G. M., Boogert, A. C. A., Schutte, W. A., & Whittet, D. C. B. 2001, A&A, 376, 254 [NASA ADS] [CrossRef] [EDP Sciences] [Google Scholar]
- Kessler-Silacci, J. E., Dullemond, C. P., Augereau, J.-C., et al. 2007, ApJ, 659, 680 [NASA ADS] [CrossRef] [Google Scholar]
- Koresko, C. D. 1998, ApJ, 507, L145 [Google Scholar]
- Kuffmeier, M., Zhao, B., & Caselli, P. 2020, A&A, 639, A86 [NASA ADS] [CrossRef] [EDP Sciences] [Google Scholar]
- Kurtovic, N. T., Grant, S. L., Temmink, M., et al. 2026, A&A, 705, A97 [NASA ADS] [CrossRef] [EDP Sciences] [Google Scholar]
- Kuruwita, R. L., & Haugbølle, T. 2023, A&A, 674, A196 [NASA ADS] [CrossRef] [EDP Sciences] [Google Scholar]
- Lacy, J. H., Baas, F., Allamandola, L. J., et al. 1984, ApJ, 276, 533 [NASA ADS] [CrossRef] [Google Scholar]
- Lahuis, F., van Dishoeck, E., Blake, G. A., et al. 2007, ApJ, 665, 492 [NASA ADS] [CrossRef] [Google Scholar]
- Lahuis, F., van Dishoeck, E., Boogert, A. C. A., et al. 2006, ApJ, 636, L145 [NASA ADS] [CrossRef] [Google Scholar]
- Leinert, C., Zinnecker, H., Weitzel, N., et al. 1993, A&A, 278, 129 [NASA ADS] [Google Scholar]
- Luhman, K. L. 2023, AJ, 165, 37 [NASA ADS] [CrossRef] [Google Scholar]
- Manara, C. F., Tazzari, M., Long, F., et al. 2019, A&A, 628, A95 [NASA ADS] [CrossRef] [EDP Sciences] [Google Scholar]
- Martinien, L., Duchêne, G., Ménard, F., Tazaki, R., & Stapelfeldt, K. R. 2025, A&A, 696, L6 [NASA ADS] [CrossRef] [EDP Sciences] [Google Scholar]
- McCabe, C., Duchêne, G., & Ghez, A. M. 2003, ApJ, 588, L113 [Google Scholar]
- McCabe, C., Duchêne, G., Pinte, C., et al. 2011, ApJ, 727, 90 [NASA ADS] [CrossRef] [Google Scholar]
- Monin, J. L., Menard, F., & Duchene, G. 1998, A&A, 339, 113 [Google Scholar]
- Najita, J. R., Carr, J. S., Strom, S. E., et al. 2010, ApJ, 712, 274 [NASA ADS] [CrossRef] [Google Scholar]
- Nakatani, R., Rosotti, G., Tabone, B., & Sellek, A. 2026, A&A, 706, A295 [NASA ADS] [CrossRef] [EDP Sciences] [Google Scholar]
- Narang, M., Pontoppidan, K. M., Salyk, C., et al. 2026, ApJ, 1004, 188 [Google Scholar]
- Nofi, L. A., Johns-Krull, C. M., López-Valdivia, R., et al. 2021, ApJ, 911, 138 [NASA ADS] [CrossRef] [Google Scholar]
- Öberg, K. I., Fraser, H. J., Boogert, A. C. A., et al. 2007, A&A, 462, 1187 [NASA ADS] [CrossRef] [EDP Sciences] [Google Scholar]
- Öberg, K. I., Boogert, A. C. A., Pontoppidan, K. M., et al. 2011, ApJ, 740, 109 [Google Scholar]
- Offner, S. S. R., Moe, M., Kratter, K. M., et al. 2023, in ASP Conf. Ser., 534, Protostars and Planets VII, eds. S. Inutsuka, Y. Aikawa, T. Muto, K. Tomida, & M. Tamura, 275 [Google Scholar]
- Oliveira, I., Pontoppidan, K. M., Merín, B., et al. 2010, ApJ, 714, 778 [NASA ADS] [CrossRef] [Google Scholar]
- Owen, J. E., Clarke, C. J., & Ercolano, B. 2012, MNRAS, 422, 1880 [Google Scholar]
- Papaloizou, J., & Pringle, J. E. 1977, MNRAS, 181, 441 [NASA ADS] [CrossRef] [Google Scholar]
- Pascucci, I., Banzatti, A., Gorti, U., et al. 2020, ApJ, 903, 78 [Google Scholar]
- Pascucci, I., & Sterzik, M. 2009, ApJ, 702, 724 [NASA ADS] [CrossRef] [Google Scholar]
- Pascucci, I., Hollenbach, D., Najita, J., et al. 2007, ApJ, 663, 383 [NASA ADS] [CrossRef] [Google Scholar]
- Pascucci, I., Cabrit, S., Edwards, S., et al. 2023, in ASP Conf. Ser., 534, 567 [NASA ADS] [Google Scholar]
- Pascucci, I., Beck, T. L., Cabrit, S., et al. 2025, Nature, 9, 81 [Google Scholar]
- Perotti, G., Christiaens, V., Henning, T., et al. 2023, Nature, 620, 516 [NASA ADS] [CrossRef] [Google Scholar]
- Perotti, G., Kurtovic, N. T., Henning, T., et al. 2026, ApJ, 997, 281 [Google Scholar]
- Pontoppidan, K. M., Dullemond, C. P., van Dishoeck, E., et al. 2005, ApJ, 622, 463 [NASA ADS] [CrossRef] [Google Scholar]
- Pontoppidan, K. M., Stapelfeldt, K. R., Blake, G. A., van Dishoeck, E., & Dullemond, C. P. 2007, ApJ, 658, L111 [CrossRef] [Google Scholar]
- Pontoppidan, K. M., Boogert, A. C. A., Fraser, H. J., et al. 2008, ApJ, 678, 1005 [NASA ADS] [CrossRef] [Google Scholar]
- Pontoppidan, K. M., Salyk, C., Blake, G. A., et al. 2010, ApJ, 720, 887 [CrossRef] [Google Scholar]
- Pontoppidan, K. M., Salyk, C., Banzatti, A., et al. 2024, ApJ, 963, 158 [NASA ADS] [CrossRef] [Google Scholar]
- Popovas, A., & Jørgensen, U. G. 2016, A&A, 595, A130 [NASA ADS] [CrossRef] [EDP Sciences] [Google Scholar]
- Potapov, A., Linz, H., Bouwman, J., et al. 2025, A&A, 697, A53 [NASA ADS] [CrossRef] [EDP Sciences] [Google Scholar]
- Ratzka, T., Leinert, C., Henning, T., et al. 2007, A&A, 471, 173 [EDP Sciences] [Google Scholar]
- Rieke, G. H., Wright, G. S., Böker, T., et al. 2015, PASP, 127, 584 [NASA ADS] [CrossRef] [Google Scholar]
- Rigby, J., Perrin, M., McElwain, M., et al. 2023, PASP, 135, 048001 [NASA ADS] [CrossRef] [Google Scholar]
- Rota, A. A., Manara, C. F., Miotello, A., et al. 2022, A&A, 662, A121 [NASA ADS] [CrossRef] [EDP Sciences] [Google Scholar]
- Roueff, E., Abgrall, H., Czachorowski, P., et al. 2019, A&A, 630, A58 [NASA ADS] [CrossRef] [EDP Sciences] [Google Scholar]
- Salyk, C., Blake, G. A., Boogert, A. C. A., & Brown, J. M. 2011, ApJ, 743, 112 [NASA ADS] [CrossRef] [Google Scholar]
- Salyk, C., Pontoppidan, K. M., Blake, G. A., et al. 2008, ApJ, 676, L49 [NASA ADS] [CrossRef] [Google Scholar]
- Salyk, C., Pontoppidan, K. M., Banzatti, A., et al. 2025, AJ, 169, 184 [Google Scholar]
- Schutte, W., Tielens, A. G. G. M., Whitter, D. C. B., et al. 1996, A&A, 315, L333 [NASA ADS] [Google Scholar]
- Schwarz, K. R., Samland, M., Olofsson, G., et al. 2025, ApJ, 991, 232 [Google Scholar]
- Sellek, A. D., Bajaj, N. S., Pascucci, I., et al. 2024, AJ, 167, 223 [NASA ADS] [CrossRef] [Google Scholar]
- Simon, M., Guilloteau, S., Beck, T. L., et al. 2019, ApJ, 884, 42 [NASA ADS] [CrossRef] [Google Scholar]
- Slavicinska, K., Boogert, A. C. A., Tychoniec, L., et al. 2025, A&A, 693, A146 [NASA ADS] [CrossRef] [EDP Sciences] [Google Scholar]
- Stapelfeldt, K. R., Krist, J. E., Ménard, F., et al. 1998, ApJ, 502, L65 [Google Scholar]
- Sturm, J. A., McClure, M. K., Beck, T. L., et al. 2023a, A&A, 679, A138 [NASA ADS] [CrossRef] [EDP Sciences] [Google Scholar]
- Sturm, J. A., McClure, M. K., Bergner, J. B., et al. 2023b, A&A, 677, A18 [NASA ADS] [CrossRef] [EDP Sciences] [Google Scholar]
- Sturm, J. A., McClure, M. K., Harsono, D., et al. 2024, A&A, 689, A92 [NASA ADS] [CrossRef] [EDP Sciences] [Google Scholar]
- Szulágyi, J., Pascucci, I., Ábrahám, P., et al. 2012, ApJ, 759, 47 [CrossRef] [Google Scholar]
- Tabone, B., Hemert, M. C. v., Dishoeck, E. F. v., & Black, J. H. 2021, A&A, 650, A192 [NASA ADS] [CrossRef] [EDP Sciences] [Google Scholar]
- Tabone, B., Bettoni, G., van Dishoeck, E., et al. 2023, Nature, 7, 805 [Google Scholar]
- Tabone, B., van Dishoeck, E., & Black, J. H. 2024, A&A, 691, A11 [NASA ADS] [CrossRef] [EDP Sciences] [Google Scholar]
- Teague, R. 2019, RNAAS, 3, 74 [NASA ADS] [Google Scholar]
- Teague, R., & Foreman-Mackey, D. 2018, RNAAS, 2, 173 [NASA ADS] [Google Scholar]
- Temmink, M., van Dishoeck, E., Gasman, D., et al. 2024, A&A, 689, A330 [NASA ADS] [CrossRef] [EDP Sciences] [Google Scholar]
- Terada, H., Tokunaga, A. T., Kobayashi, N., et al. 2007, ApJ, 667, 303 [NASA ADS] [CrossRef] [Google Scholar]
- Tobin, J. J., Sheehan, P. D., Megeath, S. T., et al. 2020, ApJ, 890, 130 [CrossRef] [Google Scholar]
- Valegård, P.-G., Waters, L. B. F. M., & Dominik, C. 2021, A&A, 652, A133 [NASA ADS] [CrossRef] [EDP Sciences] [Google Scholar]
- Villenave, M., Ménard, F., Dent, W. R. F., et al. 2020, A&A, 642, A164 [EDP Sciences] [Google Scholar]
- Watson, D. M., Leisenring, J. M., Furlan, E., et al. 2009, ApJS, 180, 84 [Google Scholar]
- Wells, M., Pel, J.-W., Glasse, A., et al. 2015, PASP, 127, 646 [NASA ADS] [CrossRef] [Google Scholar]
- Werner, M. W., Roellig, T. L., Low, F. J., et al. 2004, ApJS, 154, 1 [NASA ADS] [CrossRef] [Google Scholar]
- White, R. J., & Ghez, A. M. 2001, ApJ, 556, 265 [Google Scholar]
- Woitke, P., Kamp, I., & Thi, W.-F. 2009, A&A, 501, 383 [NASA ADS] [CrossRef] [EDP Sciences] [Google Scholar]
- Woitke, P., Min, M., Thi, W.-F., et al. 2018, A&A, 618, A57 [NASA ADS] [CrossRef] [EDP Sciences] [Google Scholar]
- Wright, G. S., Wright, D., Goodson, G. B., et al. 2015, PASP, 127, 595 [NASA ADS] [CrossRef] [Google Scholar]
- Wright, G. S., Rieke, G. H., Glasse, A., et al. 2023, PASP, 135, 048003 [NASA ADS] [CrossRef] [Google Scholar]
- Zagaria, F., Clarke, C., Rosotti, G., & Manara, C. 2022, MNRAS, 512, 3538 [NASA ADS] [CrossRef] [Google Scholar]
The pipeline and its documentation are available at https://github.com/VChristiaens/MINDS
For a comparison of the Spitzer IRS and JWST/MIRI-MRS spectra, see Appendix A.
Note that Popovas & Jørgensen (2016) define the ortho-para ratio as 3/4:1/4 rather than 3:1, therefore the resulting partition function needs to be normalised by a factor 4.
To ensure consistency in the derived line intensities, we applied our pipeline to the sample of Arulanantham et al. (2025).
Reduced data credits: Klaus Pontoppidan (available for download at https://www.stsci.edu/~pontoppi/#data).
Appendix A Comparison with Spitzer spectrum
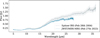 |
Fig. A.1 Comparison of the total spectrum of the HK Tau system obtained with Spitzer IRS (grey) and JWST/MIRI-MRS (blue), taken 19 years apart. The combined spectrum is dominated by the primary component. The shaded regions represent the reported spectrophotometric accuracy for both instruments. |
The HK Tau system has been observed with the Spitzer InfraRed Spectrograph (IRS), 19 years before the MINDS observations. Figure A.1 shows the JWST/MIRI-MRS spectrum compared with the archival IRS spectrum5. While we are able to disentangle the two components of the binary system in MIRI-MRS, this is not the case for IRS, hence we compare the fluxes of the combination of HK Tau A and HK Tau B. We note that the flux of HK Tau A is approximately two orders of magnitude larger than that of B, therefore the spectra in Figure A.1 are dominated by the primary component.
The Spitzer flux is systematically higher than that obtained with JWST, which could in principle suggest variability. Mid-infrared variability in Class II discs, observed when comparing IRS and MIRI-MRS spectra, usually shows one of two behaviours – a consistently stronger, or weaker, flux across the whole wavelength range (attributed to a change in the incident flux from the central object) and a ‘seesaw’ pattern, with the emission varying inversely at wavelengths shorter and longer than a pivotal point (see, e.g., Espaillat et al. 2011; Perotti et al. 2026). As we do not have access to the IRS flux at wavelengths shorter than 10 μm, we cannot rule out any of the two behaviours. Furthermore, once we account for the expected calibration errors – based on the spectrophotometric accuracy of both instruments: between 2 and 10% for IRS (Furlan et al. 2006; Watson et al. 2009) and 5.6 ± 0.7% for MIRI-MRS (Argyriou et al. 2023)-, the fluxes overlap for wavelengths shorter than ~ 22 μm; at longer wavelengths instead, the discrepancy is larger – although still moderate. A detailed radiative transfer modelling, and potentially more observed epochs, would be needed to fully appreciate the cause of this discrepancy.
Appendix B Results of the slab model fit
Parameters of the best fit slab model for the continuum-subtracted spectrum of HK Tau A.
Appendix C Rotational diagram constants and moment 0 maps
H2 rotational transition properties.
Appendix D Complete moment 0 H2 maps
All Tables
Parameters of the best fit slab model for the continuum-subtracted spectrum of HK Tau A.
All Figures
|
Fig. 1 Integrated MIRI-MRS spectrum of HK Tau A (top) and B (bottom) in grey. The black line represents the continuum baseline. Insets in the top panel zoom into wavelength regions that shows molecular emission from 12CO, H2O, 12CO2, and H2. The shaded bands in the bottom panel indicate the main ice absorption regions. H2 rotational lines are marked with blue ticks, and gas emission features are labelled where present. |
| In the text | |
|
Fig. 2 Comparison of the continuum-subtracted spectrum of HK Tau A (top panel, dark grey) and B (bottom panel) in the 13.5–16.2 μm range. The primary shows emission lines from several molecular components (H2O, 12CO2, HCN, and OH), to which we show the total fit (light grey) and the single molecular components (coloured lines). On the other hand, the noise level in HK Tau B is too high for any confident claim of molecular emission, and only the bright [Ne III] line is visible. |
| In the text | |
|
Fig. 3 Emission at the wavelength of [Ar II], [Ne II], and [Ne III] from HK Tau A (top panel, yellow line) and B (bottom panel, pink line), from left to right. For [Ar II] and [Ne III], the top panel includes the fitted water spectrum for HK Tau A, as the lines fall in a water-rich wavelength region. We also show the resulting water-subtracted spectra for HK Tau A (dashed orange line). The rest-frame wavelength is highlighted in green. |
| In the text | |
|
Fig. 4 Moment 0 maps of the S(1), S(2), and S(3) H2 extended lines. The yellow and black stars mark the coordinates of the centre of HK Tau A and B. The white circles in the bottom left corner of each panel show the full width at half maximum of the PSF at the corresponding band. North is up, and east is to the left. The solid pink and dashed purple contours represent the extent of the ALMA continuum emission at 0.87 mm (published in Villenave et al. 2020) and the peak emission map of CO J=2–1 (published in Rota et al. 2022; estimated with the quadratic method of bettermoments (Teague & Foreman-Mackey 2018; Teague 2019)). |
| In the text | |
|
Fig. 5 Pixel-by-pixel temperature (left) and total column density (centre) maps of the extended H2 emission in the surroundings of HK Tau B, compared to the S(1) moment 0 map (right). The maps are centred at the location of HK Tau A, marked by the yellow star, and the black star represents the location of HK Tau B. The white contours represent the extent of the ALMA continuum emission as in Figure 4. The bottom row shows the rotational diagram at each of the four locations marked in the S(1) moment 0 map by the coloured squares. |
| In the text | |
|
Fig. 6 Synthetic spectra of a fiducial T Tauri disc model (Arabhavi et al. 2026) showing the impact of the disc inclination on the molecular features at 13.5–16 μm. |
| In the text | |
|
Fig. 7 Comparison of the [Ne III]/[Ne II] (top panel) and [Ne II]/[Ar II] (bottom panel) line ratios for HK Tau A and B (orange shaded region) and the other published detections. Binary systems are marked with a black contour. The dashed coloured lines show the line ratio thresholds for determining the dominant irradiation source. Sz Cha is taken from Espaillat et al. (2023), T Cha is taken from Bajaj et al. (2024), RW Aur B and VW Cha BC are taken from Kurtovic et al. (2026), and all others are taken from Arulanantham et al. (2025). |
| In the text | |
|
Fig. 8 Moment 8 map of the [Ne II] emission around HK Tau A (yellow star) and B (white star). |
| In the text | |
|
Fig. A.1 Comparison of the total spectrum of the HK Tau system obtained with Spitzer IRS (grey) and JWST/MIRI-MRS (blue), taken 19 years apart. The combined spectrum is dominated by the primary component. The shaded regions represent the reported spectrophotometric accuracy for both instruments. |
| In the text | |
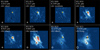 |
Fig. D.1 Same as Figure 4 including all H2 extended lines within the MIRI-MRS wavelength range. |
| In the text | |
Current usage metrics show cumulative count of Article Views (full-text article views including HTML views, PDF and ePub downloads, according to the available data) and Abstracts Views on Vision4Press platform.
Data correspond to usage on the plateform after 2015. The current usage metrics is available 48-96 hours after online publication and is updated daily on week days.
Initial download of the metrics may take a while.