


Fig. 1
Download original image
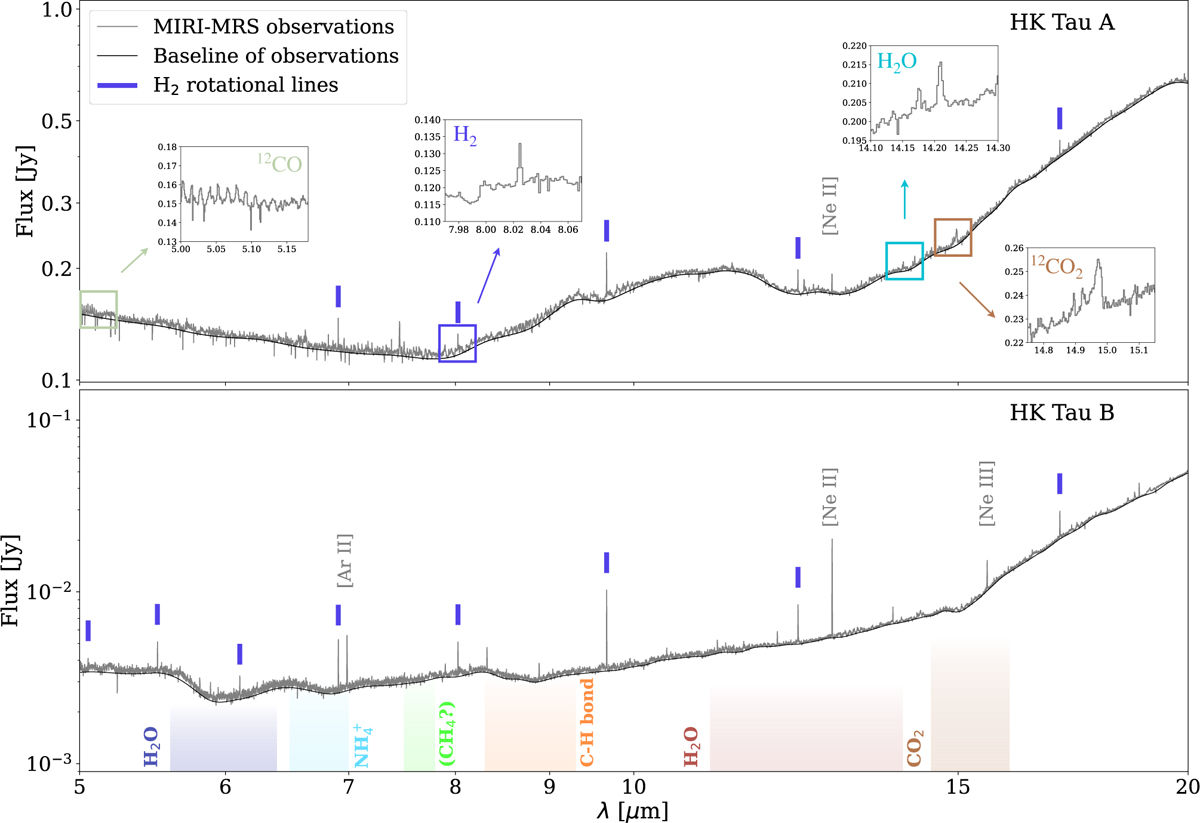
Integrated MIRI-MRS spectrum of HK Tau A (top) and B (bottom) in grey. The black line represents the continuum baseline. Insets in the top panel zoom into wavelength regions that shows molecular emission from 12CO, H2O, 12CO2, and H2. The shaded bands in the bottom panel indicate the main ice absorption regions. H2 rotational lines are marked with blue ticks, and gas emission features are labelled where present.
Current usage metrics show cumulative count of Article Views (full-text article views including HTML views, PDF and ePub downloads, according to the available data) and Abstracts Views on Vision4Press platform.
Data correspond to usage on the plateform after 2015. The current usage metrics is available 48-96 hours after online publication and is updated daily on week days.
Initial download of the metrics may take a while.