


Fig. 4
Download original image
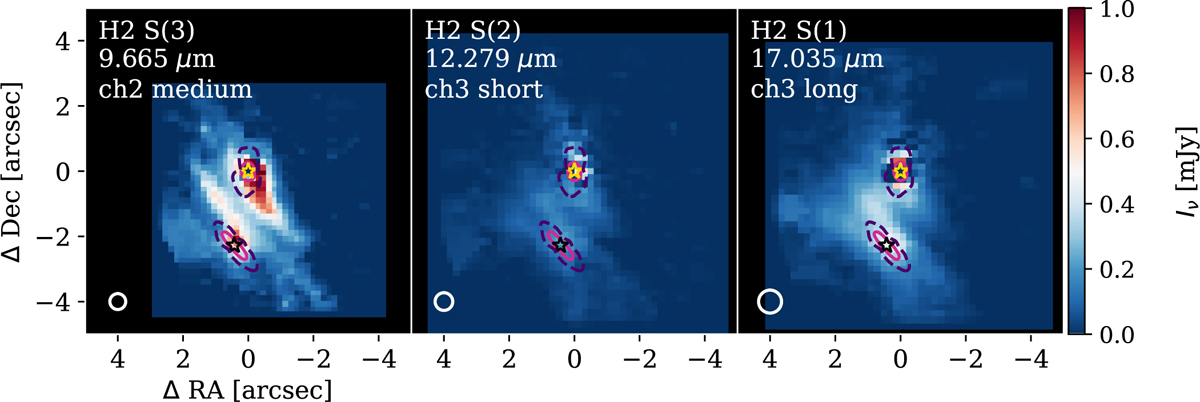
Moment 0 maps of the S(1), S(2), and S(3) H2 extended lines. The yellow and black stars mark the coordinates of the centre of HK Tau A and B. The white circles in the bottom left corner of each panel show the full width at half maximum of the PSF at the corresponding band. North is up, and east is to the left. The solid pink and dashed purple contours represent the extent of the ALMA continuum emission at 0.87 mm (published in Villenave et al. 2020) and the peak emission map of CO J=2–1 (published in Rota et al. 2022; estimated with the quadratic method of bettermoments (Teague & Foreman-Mackey 2018; Teague 2019)).
Current usage metrics show cumulative count of Article Views (full-text article views including HTML views, PDF and ePub downloads, according to the available data) and Abstracts Views on Vision4Press platform.
Data correspond to usage on the plateform after 2015. The current usage metrics is available 48-96 hours after online publication and is updated daily on week days.
Initial download of the metrics may take a while.