


Fig. 5
Download original image
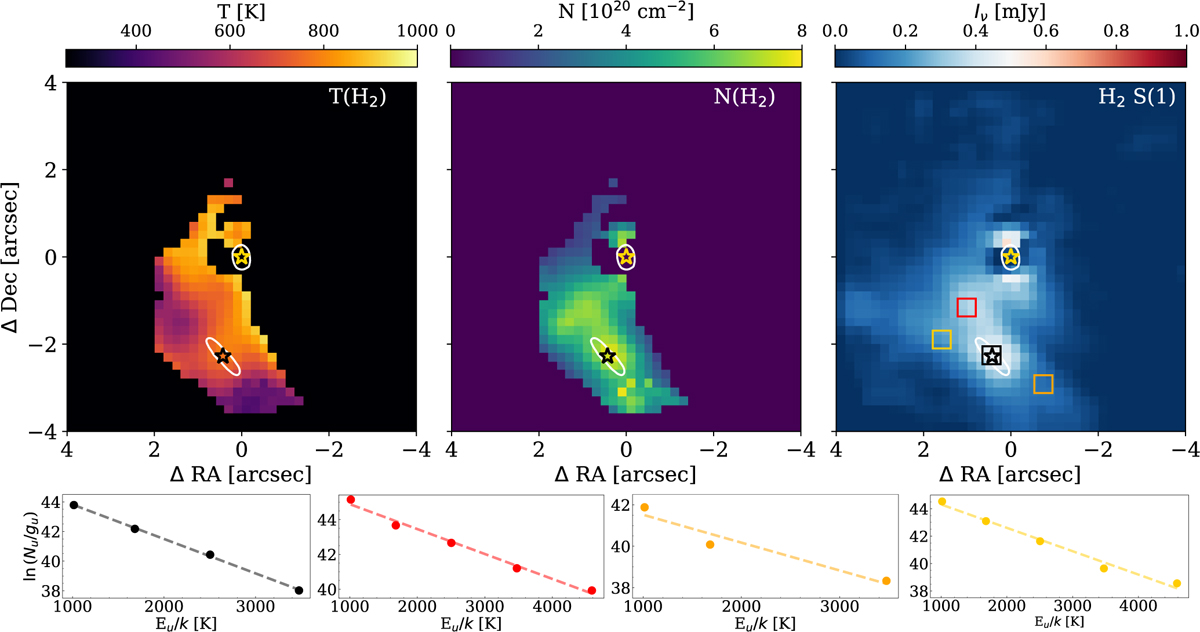
Pixel-by-pixel temperature (left) and total column density (centre) maps of the extended H2 emission in the surroundings of HK Tau B, compared to the S(1) moment 0 map (right). The maps are centred at the location of HK Tau A, marked by the yellow star, and the black star represents the location of HK Tau B. The white contours represent the extent of the ALMA continuum emission as in Figure 4. The bottom row shows the rotational diagram at each of the four locations marked in the S(1) moment 0 map by the coloured squares.
Current usage metrics show cumulative count of Article Views (full-text article views including HTML views, PDF and ePub downloads, according to the available data) and Abstracts Views on Vision4Press platform.
Data correspond to usage on the plateform after 2015. The current usage metrics is available 48-96 hours after online publication and is updated daily on week days.
Initial download of the metrics may take a while.