


Fig. 7
Download original image
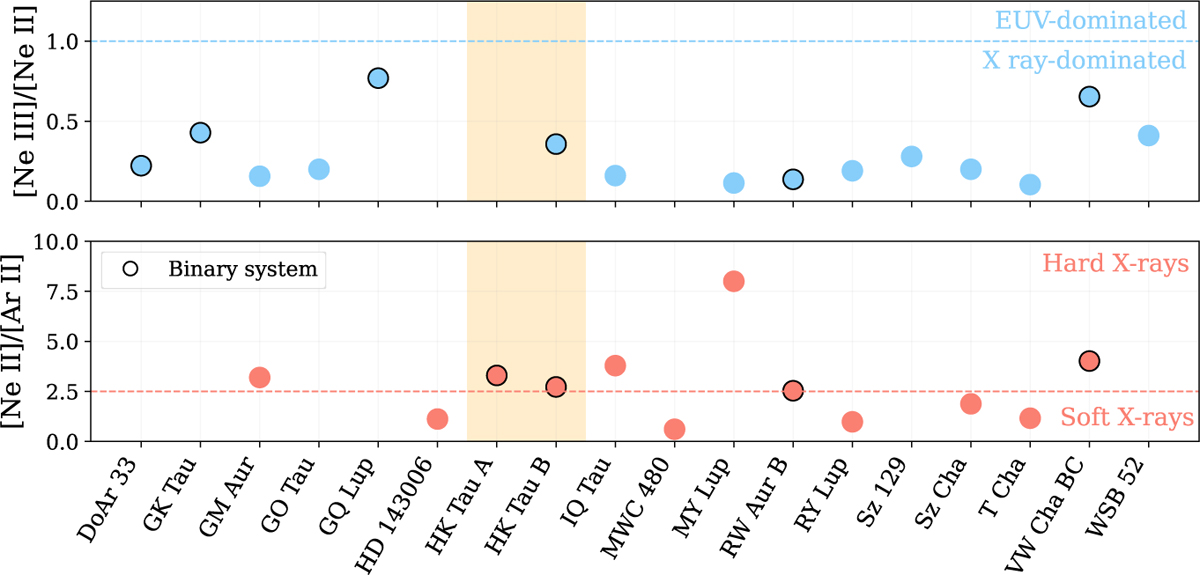
Comparison of the [Ne III]/[Ne II] (top panel) and [Ne II]/[Ar II] (bottom panel) line ratios for HK Tau A and B (orange shaded region) and the other published detections. Binary systems are marked with a black contour. The dashed coloured lines show the line ratio thresholds for determining the dominant irradiation source. Sz Cha is taken from Espaillat et al. (2023), T Cha is taken from Bajaj et al. (2024), RW Aur B and VW Cha BC are taken from Kurtovic et al. (2026), and all others are taken from Arulanantham et al. (2025).
Current usage metrics show cumulative count of Article Views (full-text article views including HTML views, PDF and ePub downloads, according to the available data) and Abstracts Views on Vision4Press platform.
Data correspond to usage on the plateform after 2015. The current usage metrics is available 48-96 hours after online publication and is updated daily on week days.
Initial download of the metrics may take a while.