


Fig. 2
Download original image
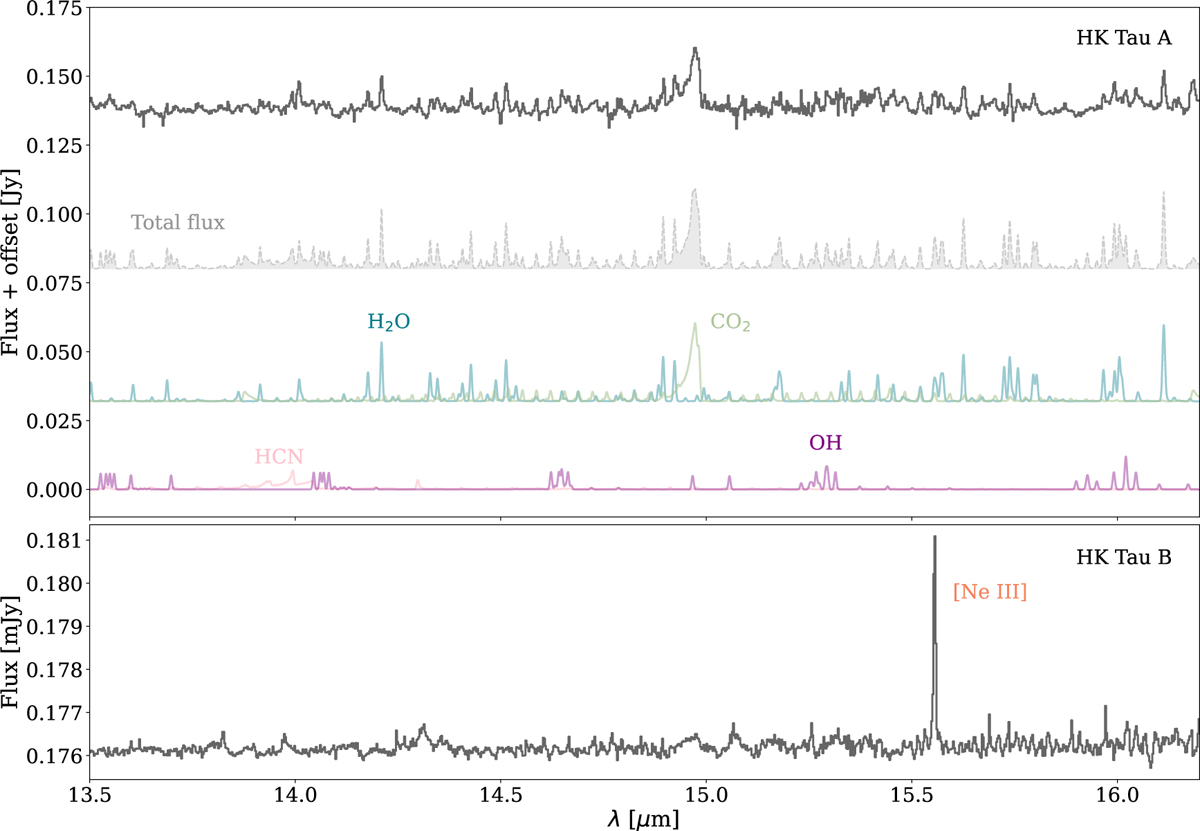
Comparison of the continuum-subtracted spectrum of HK Tau A (top panel, dark grey) and B (bottom panel) in the 13.5–16.2 μm range. The primary shows emission lines from several molecular components (H2O, 12CO2, HCN, and OH), to which we show the total fit (light grey) and the single molecular components (coloured lines). On the other hand, the noise level in HK Tau B is too high for any confident claim of molecular emission, and only the bright [Ne III] line is visible.
Current usage metrics show cumulative count of Article Views (full-text article views including HTML views, PDF and ePub downloads, according to the available data) and Abstracts Views on Vision4Press platform.
Data correspond to usage on the plateform after 2015. The current usage metrics is available 48-96 hours after online publication and is updated daily on week days.
Initial download of the metrics may take a while.