| Issue |
A&A
Volume 708, April 2026
|
|
|---|---|---|
| Article Number | A374 | |
| Number of page(s) | 29 | |
| Section | Extragalactic astronomy | |
| DOI | https://doi.org/10.1051/0004-6361/202558567 | |
| Published online | 28 April 2026 | |
eROSITA-RU tidal disruption events with Keck-I/LRIS: Sample selection, optical properties, and host galaxy demographics
1
Department of Astronomy, University of California, Berkeley, CA, 94720-3411, USA
2
College of Physics, Sichuan University, Chengdu, 610065, China
3
Miller Institute for Basic Research in Science, 206B Stanley Hall, Berkeley, CA, 94720, USA
4
Berkeley Center for Multi-messenger Research on Astrophysical Transients and Outreach (Multi-RAPTOR), University of California, Berkeley, CA, 94720, USA
5
Space Research Institute (IKI), Russian Academy of Sciences, Profsoyuznaya 84/32, Moscow, 117997, Russia
6
Max-Planck-Institut für Astrophysik, Karl-Schwarzschild-Str. 1, D-85741, Garching, Germany
7
Cahill Center for Astrophysics, California Institute of Technology, MC 249-17, 1200 E California Boulevard, Pasadena, CA, 91125, USA
8
Kazan Federal University, Kremlevskaya Str., 18, Kazan, 420008, Russia
★ Corresponding author: This email address is being protected from spambots. You need JavaScript enabled to view it.
Received:
15
December
2025
Accepted:
16
March
2026
Abstract
Context. We selected 70 tidal disruption event (TDE) candidates among X-ray transients discovered during the eROSITA all-sky surveys in the eastern Galactic hemisphere (0° < l < 180°) between December 2020 and February 2022 (eRASS1–5).
Aims. We performed a systematic analysis of this sample to characterize the properties of the optical counterparts and host galaxies of the TDE candidates.
Methods. We cross-matched each X-ray source to a host galaxy in archival optical surveys using Bayesian likelihood-ratio techniques and obtained Keck/LRIS spectroscopy for all 70 host galaxies. Host properties were inferred through a spectral energy distribution fitting with Prospector and emission line analysis with pPXF. We developed a robust classification scheme using X-ray and broad-line luminosities, narrow-line ionization diagnostics, and optical variability to identify high-confidence TDEs. For these, we analyzed optical spectral features, light curve properties, and host galaxy demographics.
Results. Our final sample contained 52 TDEs with redshifts of 0.018 ≤ z ≤ 0.714, comprising 41 gold (high-confidence) and 11 silver (lower-confidence) events. The majority (85%) of the gold TDEs are intrinsically brighter in the X-ray band, with LX, peak > Lg, peak. Among the 23 gold TDEs with detected optical flares, delayed X-ray peaks are commonly observed. We identified transient spectral features in eight events, including six with prominent broad He IIλ4686 and/or Hα emission and two coronal-line TDEs. Host galaxy demographics revealed modest overrepresentation in green valley (×1.8) and quiescent Balmer-strong (×5.3) galaxies, which is significantly weaker than previous TDE samples, demonstrating greater diversity in star formation histories than previously recognized. Most TDE hosts exhibit suppressed star formation relative to the main sequence, consistent with X-ray selection biases against dusty star-forming galaxies.
Key words: galaxies: nuclei / X-rays: galaxies
© The Authors 2026
 Open Access article, published by EDP Sciences, under the terms of the Creative Commons Attribution License (https://creativecommons.org/licenses/by/4.0), which permits unrestricted use, distribution, and reproduction in any medium, provided the original work is properly cited.
This article is published in open access under the Subscribe to Open model. This email address is being protected from spambots. You need JavaScript enabled to view it. to support open access publication.
1. Introduction
Tidal disruption events (TDEs) of stars by massive black holes (MBHs) produce a dazzling cornucopia of astrophysical phenomena. The accretion of stellar material gives rise to soft X-ray and extreme-ultraviolet thermal flares (Komossa 2015). Reprocessing of accretion emission and stream-disk shocks powers flares in the optical band (Andalman et al. 2022; Ryu et al. 2023; Price et al. 2024; Steinberg & Stone 2024). Relativistic jets are launched in ≲1% of events, resulting in spectacular radio and hard X-ray transients (Alexander et al. 2020; De Colle & Lu 2020). TDEs represent unique laboratories for studying MBH demographics (Stone et al. 2020; Yao et al. 2023; Hannah et al. 2025) as well as the accretion and jet physics of MBHs (Guolo et al. 2024a; Yao et al. 2024).
The first observational evidence of TDEs came from the detection of soft X-ray flares from the centers of quiescent galaxies during the ROSAT (0.1–2.4 keV) all-sky survey (RASS) in 1990–1991 (Bade et al. 1996; Komossa & Greiner 1999). Their X-ray luminosity was observed to increase over ∼1 month and decay over years, with the decline rate generally following the theoretically expected mass fall-back rate of ∝t−5/3 (Rees 1988; Phinney 1989). Subsequently, using RASS as a reference, the search for soft X-ray nuclear transients in the Chandra and XMM-Newton archives yielded ∼20 TDEs and TDE candidates (see Saxton et al. 2020 for a review).
Since about 2010, optical sky surveys have dominated the TDE discovery rate (see, e.g., Fig. 1.5 of Yao 2023). The continuum emission of these events is characterized by blackbody radiation with effective temperatures of ∼20 000 K. Depending on the presence or absence of broad emission lines around He II, He I, and the Balmer series, they are broadly classified into TDE-H, TDE-He, TDE-H+He, and TDE-featureless (van Velzen et al. 2021; Hammerstein et al. 2023). Within individual events, the evolution of relative line strengths is common, and transitions between spectral subtypes have been observed (Charalampopoulos et al. 2022). This spectroscopic diversity might be attributed to the stratified structure of the different line emitting regions, where the effective photospheres of different lines arise from distinct layers. Lines can be broadened with electron scattering (Roth et al. 2016), bulk kinetic motion in optically thick outflow (Roth & Kasen 2018; Nicholl et al. 2020), or Keplerian rotation of a disk (Short et al. 2020).
Population studies of host galaxy properties of early optical TDE samples have shown that the host galaxies generally show low levels of current star formation (weak Hα emission) and substantial star formation approximately in the past gigayear (strong Hδ absorption; Arcavi et al. 2014; French et al. 2016). These so-called quiescent Balmer-strong (QBS) or E+A galaxies appear to dominate early TDE samples. More recent studies using the Zwicky Transient Facility (ZTF) sample have confirmed this E+A/QBS overrepresentation, though the enhancement is less extreme than initially suggested (Hammerstein et al. 2021). In the galaxy color-mass diagram, optical TDEs occur preferentially in green valley galaxies, with rates exceeding those in both red sequence and blue cloud populations (van Velzen et al. 2021; Hammerstein et al. 2023; Yao et al. 2023).
A small subset of TDEs (probably those in gas-rich environments) exhibit prominent coronal emission lines and are referred to as CrL-TDE (Onori et al. 2022; Newsome et al. 2024; Callow et al. 2024; Clark et al. 2025). They form a subset of the population of extreme coronal line emitters (Komossa et al. 2008; Wang et al. 2011, 2012). These CrL-TDEs typically show accompanying X-ray or UV flares that ionize gas located well beyond the immediate disruption region, producing both the high-ionization coronal lines and reprocessed infrared (IR) emission (Jiang et al. 2021; Short et al. 2023; Newsome et al. 2024; Clark et al. 2025). As such, they are considered as light echos of TDEs. The star formation rates (SFRs) of the host galaxies of CrL-TDEs are statistically higher than that of other optically selected TDEs (Hinkle et al. 2024).
The X-ray discovery of TDEs experienced a renaissance from December 12, 2019, to February 26, 2022, when the eROSITA (0.2–8 keV; Predehl et al. 2021) telescope on board the Spektrum-Roentgen-Gamma (SRG) mission (Sunyaev et al. 2021) was conducting all-sky surveys. Each eROSITA all-sky survey (eRASS) took six months, with eRASS1–eRASS4 fully completed and nearly 40% of eRASS5 conducted before the telescope was put in safe mode. The 6-month survey cadence and the large grasp (product of field of view and effective area) of eROSITA allow for an effective TDE search (Khabibullin et al. 2014). The selection of the eROSITA TDEs was independently performed by two consortia: eROSITA-RU for the eastern Galactic hemisphere (0° < l < 180°) and eROSITA-DE for the western hemisphere (180° < l < 360°). The first reports of TDE candidates found by eROSITA began to appear soon after the start of the all-sky survey (Khabibullin et al. 2020b,a). Single-object studies have revealed various phenomena, from repeating nuclear transients consistent with partial disruptions (Liu et al. 2023) to TDEs with novel optical or X-ray properties (Yao et al. 2022; Malyali et al. 2023, 2024).
While individual discoveries have revealed the diversity of eROSITA TDEs, understanding the population as a whole requires uniform selection and statistical analysis. Performing such a selection is challenging because unlike most optically selected TDEs with characteristic broad emission lines, X-ray–selected (and optically faint) events must be distinguished from active galactic nuclei (AGN) that can produce similar soft X-ray flares (e.g., Brandt et al. 1995; Grupe et al. 1995), as witnessed by eROSITA (Medvedev et al. 2022; Khorunzhev et al. 2024; Grotova et al. 2025b). Despite these challenges, the two eROSITA consortia have released TDE samples that probe population-level properties. From the eROSITA-RU side, Sazonov et al. (2021) presented 13 TDEs that were undetected in eRASS1 but appeared in eRASS2 at flux levels exceeding more than ten times the upper limits of eRASS1, with follow-up optical spectroscopy confirming their non-AGN nature. Khorunzhev et al. (2022) presented an additional sample of five TDEs detected by eROSITA in eRASS1–eRASS4 and confirmed by optical spectroscopy. From the eROSITA-DE side, Grotova et al. (2025a) reported 31 TDEs selected for X-ray variability amplitudes greater than four between eRASS1 and eRASS2, among which 11 sources have only photometric redshifts. Together, these studies established some key results: (1) The volumetric rate of X-ray TDEs is comparable to that of optically selected events, (2) X-ray TDE hosts are, similar to optical TDEs, preferentially found in green valley galaxies, and (3) the majority of X-ray-selected TDEs are intrinsically faint in the optical.
Having a much larger eROSITA TDE sample with detailed characterization of the transient properties and host galaxies is essential to addressing several outstanding questions. First, volumetric rates remain poorly constrained. Integrating the best-fit X-ray luminosity functions from Sazonov et al. (2021) and Grotova et al. (2025a) above the peak luminosities of LX > 1042.5 erg s−1 yields TDE rates that differ by a factor of four:  from Sazonov et al. (2021) versus ≈52 ± 15 Gpc−3 yr−1 from Grotova et al. (2025a). As noted by Mondal & French (2025), the eROSITA-DE sample is probably contaminated by AGN due to its lower detection threshold. Second, existing eROSITA studies have not yet examined how TDE rates vary with host galaxy stellar mass or black hole mass. Such constraints are essential for using TDE samples to probe black hole mass functions and loss cone physics. Finally, potential correlations between UV/optical broad-line properties and X-ray loudness offer powerful diagnostics to distinguish between competing models of the TDE radiative emission mechanisms (Roth et al. 2020), but they remain largely unexplored.
In this paper, we present optical spectroscopic observations from the Low Resolution Imaging Spectrometer (LRIS; Oke et al. 1995) on the Keck I telescope of 70 TDE candidates identified by the eROSITA-RU consortium. For most candidates, the Keck/LRIS spectra show only host galaxy light, with transient features detected in a small subset. We note that the 13 TDEs published by Sazonov et al. (2021) were all observed by LRIS and are therefore included here for both comparison and completeness. These observations provide a comprehensive spectroscopic dataset for studying the host galaxies of TDEs.
The remainder of this paper is organized as follows. In Sect. 2 we outline the sample selection and host galaxy association procedures. In Sect. 3 we describe the archival photometry of the host galaxies and our new Keck/LRIS spectroscopic observations. In Sect. 4 we combine spectroscopy and photometry to derive host galaxy properties, address AGN contamination, and define a gold sample of the most robust TDEs. Finally, we discuss our findings in Sect. 5 and summarize in Sect. 6.
All coordinates are given in J2000. Optical observations have been corrected for Galactic extinction using the Schlegel et al. (1998) dust maps and the Cardelli et al. (1989) extinction curves with RV = 3.1. We adopt a standard Lambda cold dark matter cosmology with matter density ΩM = 0.3, dark energy density ΩΛ = 0.7, and the Hubble constant H0 = 70 km s−1 Mpc−1. Unless otherwise noted, the uncertainties quoted represent 68% confidence intervals.
2. Initial sample selection
2.1. X-ray selection
We selected TDE candidates from strongly variable X-ray sources detected by eROSITA-RU sky surveys in the 0.3–2.3 keV energy band (Medvedev et al. 2022). The source catalog is built and maintained by the eROSITA-RU X-ray source catalog science working group at the Space Research Institute (Moscow, Russia). As data from successive sky scans were collected throughout the mission, the master catalog was updated and multiple selections were created to support various multi-wavelength follow-up programs, including the extensive TDE identification campaign reported here. The selection criteria for TDE candidates evolved throughout the mission. The distribution of TDE candidates among participating optical telescopes also varied throughout the mission. Therefore, the sample with Keck spectroscopy presented here is not statistically well defined and is not a result of uniform selection across eROSITA sky scans. This dataset should therefore be regarded as a large subsample of the full eROSITA TDE sample, which will be defined using strict and uniform criteria and presented in a future publication.
Before the end of 2022, we classified an X-ray source as highly variable if the source was not detected in previous surveys and its flux in the 0.3–2.3 keV energy band during some eROSITA scan exceeded its upper limit in the previous scan by a factor larger than RX, min. Our initial TDE candidate samples used RX, min = 10 (Sazonov et al. 2021), later expanded to RX, min = 7 to include fainter events (Khorunzhev et al. 2022). At the later stages of the mission, we redefined the sample using the formalism described in Medvedev et al. (2022), which uses the theoretical probability distribution for the flux ratio to select sources variable with factors larger than RX, min at the specified confidence level (usually corresponding to 3σ). The sample with Keck spectroscopy presented here was largely selected using the former method with RX, min = 10 and 7. Note that we did not use X-ray spectral softness in selecting TDE candidates, as some TDEs are known to exhibit relatively hard spectra (e.g., Wevers 2020; Yao et al. 2022; Guolo et al. 2024a; Ho et al. 2025).
Our selection process applies several filters to distinguish TDE candidates from other types of Galactic and extragalactic transients, following the procedures described in Sazonov et al. (2021) and Khorunzhev et al. (2022). Specifically, we excluded Galactic sources based on positional coincidence (with the eROSITA 98% localization radius r98) with stars having statistically significant Gaia parallax and/or proper motion (Gaia Collaboration 2023). We also excluded known and candidate AGN based on mid-infrared colors W1 − W2 > 0.8 mag (Stern et al. 2012) in the WISE all-sky survey (Cutri et al. 2021), archival X-ray detections, or optical transients with AGN-like stochastic variability. These criteria evolved slightly (in particular, we used a stricter infrared-color condition, W1 − W2 < 0.5 mag, in Sazonov et al. 2021) during the course of our TDE search; full details will appear in the forthcoming comprehensive catalog paper.
2.2. Host galaxy association
We identified the host galaxies of our TDE candidates as optical sources detected in the Pan-STARRS1 (PS1; Flewelling et al. 2020). For regions outside the PS1 footprint, we used sources detected in the DESI Legacy Imaging Survey (LS; Dey et al. 2019) DR10. For PS1, we considered only objects classified as “GALAXY” or “UNSURE” by the machine learning catalog of Beck et al. (2021), and that have an i-band PSF magnitude. We assumed that all TDE candidates are located at galaxy centers and are not associated with off-nuclear MBHs.
We cross-matched eROSITA sources with optical objects using a search radius of 8σpos (note that r98 = 2.8σpos). We computed the reliability R of each association using the maximum likelihood method (Sutherland & Saunders 1992). Defining the normalized distance as the ratio between the angular separation between the X-ray and optical positions and the eROSITA positional uncertainty (i.e., x ≡ Δpos/σpos), the likelihood ratio is
 (1)
(1)
where λ is the mean number of objects per unit area and q(m) and n(m) are the a priori probabilities of true and background identifications at the observed (i-band) magnitude (m) of the matched optical source, respectively. The reliability of the jth match is then
 (2)
(2)
where Ql is the probability that the true optical counterpart is above the limit magnitude of (PS1 and DS10) optical catalogs and is within our search radius of x ≤ 8. For simplicity, we assumed Ql = 1 and a flat prior on q(m). We also assumed n(m)∝m0.6, as expected in a simple Euclidean universe with uniform spatial distribution. In this case, Eq. (2) can be simplified to
 (3)
(3)
For all optical objects within x < 8, we obtained forced photometry light curves (during the time span from 2018 March 1 to 2024 January 1) using the ZTF (Bellm et al. 2019; Graham et al. 2019; Masci et al. 2019, 2023) and the Asteroid Terrestrial-impact Last Alert System (ATLAS; Tonry et al. 2018; Smith et al. 2020; Shingles et al. 2021). If a significant optical flare was detected, we set R = 1. Optical spectroscopy (see Sect. 3.2) was obtained for X-ray sources with a unique optical counterpart having R > 0.9. We excluded Galactic sources and obvious broad-line AGN (BLAGN) whose optical spectra exhibit very strong broad emission lines (hydrogen Balmer series, Mg II, etc.) that significantly exceed the continuum level1. This yielded a final sample of 70 TDE candidates with high-confidence optical associations. This sample, listed in Tables A.1, forms the basis of our analysis. The reliability of most optical counterparts presented in the Tables is R = 1.00, except for ID 4 (R = 0.96), ID 33 (R = 0.98), ID 35 (R = 0.94), ID 52 (R = 0.99), and ID 60 (R = 0.96). We show the 25″ × 25″ cutouts of the host galaxy associations in Appendix B. Of the 70 optical counterparts, 69 lie within the r98 region, while one (1.4%) lies outside, consistent with the expectation that 2% of counterparts fall outside r98 by construction.
3. Data
3.1. Archival photometry
We compiled UV-to-IR photometry for all host galaxies, adopting measurements with signal-to-noise ratio (S/N) > 3 as detections and 3σ upper limits otherwise. UV fluxes were measured from the Galaxy Evolution Explorer (GALEX; Martin et al. 2005) using gPhoton (Million et al. 2016), with Kron apertures and optimized background annuli. For the optical band, we prioritized PS1 grizy Kron magnitudes (Chambers et al. 2016) where available, otherwise using the Sloan Digital Sky Survey (SDSS) DR16 (Stoughton et al. 2002). Near-infrared JHKs magnitudes were drawn from the Two Micron All-Sky Survey (2MASS) extended source catalog (Skrutskie et al. 2006) where available. For the mid-infrared, we used data provided by the Wide-field Infrared Survey Explorer (WISE; Wright et al. 2010). We prioritized WISE photometry from the LS DR10 Tractor catalog (Nikutta et al. 2020), supplemented by LS DR10 aperture fluxes or entries from the AllWISE (Cutri et al. 2013) and CatWISE (Eisenhardt et al. 2020) catalogs.
3.2. Optical spectroscopy
We obtained optical spectroscopy for the host galaxies of all TDE candidates using LRIS. For the blue side, we used the 400/3400 grism with a 1″ slit for all but four observations. SRGe J071310.4+725627 (ID 20) was observed with the 600/4000 grism and a 1.5″ slit. SRGe J174505.5+104700 (ID 55), SRGe J201138.9-210935 (ID 63), and the +1333-day spectrum of SRGe J175023.7+712857 (ID 58) were taken with the 600/4000 grism and a 1″ slit. This configuration provided spectral coverage of 3200–10250 Å. For the majority of objects, only one epoch of LRIS spectroscopy was obtained. Multiple spectra were collected for four objects (IDs 5, 26, 58, and 66) where prominent TDE emission lines were detected during the first LRIS epoch (see Sect. 4.3.5 for details). A log of LRIS observations is presented in Table A.2, which also lists the host redshifts measured from the LRIS spectra.
We also cross-matched our sample with the Dark Energy Spectroscopic Instrument (DESI) survey data release one (DR1; DESI Collaboration 2025). We found DESI spectra for 13 host galaxies in our sample. For 12 of these, the DESI spectra were broadly consistent with the Keck/LRIS data, exhibiting similar continuum shapes and line properties. Only one DESI spectrum was retained for our analysis, as it has a substantially higher S/N than the corresponding Keck spectrum. The retained DESI spectrum (3600–9800 Å), corresponding to the host galaxy of SRGe J234034.7+293400 (ID 69), was obtained with a single 982 s exposure on 2021-10-16.12 (485 d after the observed peak X-ray flux) using a 1.5″ fibre.
4. Analysis
4.1. Host galaxy SED fitting
To infer host galaxy properties, we fit the galaxy data using Prospector (Johnson et al. 2021) built on FSPS (Conroy & Gunn 2010). We adopted a non-parametric continuity star formation history (SFH) that captures bursts, quenching, and rejuvenation episodes with flexibility.
Our fits used extinction-corrected host galaxy photometry and optical spectroscopy. When jointly fitting photometry and spectroscopy, we employed Prospector’s PolySpecModel with spectroscopic calibration, including a free normalization parameter (spec_norm) to scale the spectrum to match the photometry. Only SRGe J163831.9+534018 (ID 50) was fit using photometry alone, as the joint photometry+spectroscopy fit did not converge. For objects with multiple LRIS spectra (i.e., IDs 5, 26, 58, and 66), we used the latest observation.
The LRIS spectra are typically dominated by host galaxy light, as they were obtained at late epochs when the optical counterparts of most X-ray-selected TDEs had faded. However, in some cases, broad emission lines associated with the transient may still be present. We performed the Prospector fitting twice: once with the He IIλ4686 and Hα regions masked, and once without masking. We adopted the unmasked fits for our final host galaxy parameter estimates, as the transient emission lines are typically weak at these late epochs and their impact on the stellar continuum and broadband photometry is minimal. In Sect. 4.3.5 we used the masked fits to identify and characterize any residual broad-line emission from the optical counterparts by subtracting the host model from the observed spectra.
Posterior distributions were sampled with dynesty (Speagle 2020), and convergence was monitored via the built-in KL divergence test. We used the nested sampler with 500 live points (both nested_nlive_init and nested_nlive_batch set to 500), random-walk sampling mode, a convergence criterion of 0.01 for nested_dlogz_init, and a maximum of 7.5 × 10⁶ likelihood calls, keeping the default dynesty bounds. All fits were run in parallel using MPI via MPIPool. We included a multiplicative spectroscopic jitter term (spec_jitter) as a free parameter that scales the spectroscopic uncertainties by a wavelength-independent factor, and we did not include any additional jitter term for the photometric data.
The model parameters and measured galaxy properties are described as follows. We adopted a uniform TopHat prior on redshift, constrained to a narrow range of 0.05 around the spectroscopically fit redshift which was derived from pPXF in Sect. 4.2. The galaxy stellar mass (M*) was derived from the surviving fraction of stars formed. Stellar metallicity was parameterized as log(Z*/Z⊙). We adopted an empirical mass–metallicity prior from Gallazzi et al. (2005). The SFH was represented by logarithmically spaced age bins (with 0–30 Myr and 30–100 Myr fixed). We used 6 bins for spectra with S/N < 15, and typically 10 bins for higher S/N spectra, chosen as a compromise between flexibility and constraining power given the data quality. We adopted a Student’s T prior on the logSFR ratios between adjacent time bins, and recent activity was summarized by the average SFR over the past 10 and 100 Myr (i.e., SFR10 and SFR100). We compupted the mass-weighted stellar age, defined as the average lookback time of stars weighted by their formed stellar mass across all SFH bins.
Dust was modeled with the two-component prescription of Charlot & Fall (2000), including diffuse ISM optical depth, a birth-cloud fraction, and a variable slope modifier (Kriek & Conroy 2013). From these, we derived AV and E(B − V) for both diffuse and young-star components. As the FSPS nebular emission-line grids may not fully capture the diversity of observed line ratios, we modeled nebular emission with FSPS+CLOUDY and enabled line-amplitude marginalization, allowing line strengths to vary independently while keeping the stellar-population parameters primarily constrained by the continuum and photometry (Johnson et al. 2021). These nebular parameters were treated as free parameters, and for galaxies with no detectable emission lines, we disabled the nebular emission component altogether. For dust emission, we adopted the model of Draine & Li (2007), with Umin, γdust, and QPAH treated as free parameters when constrained by IR data, and held fixed otherwise. Possible AGN contamination was modeled with the CLUMPY torus templates (Nenkova et al. 2008), with fAGN and τAGN held fixed when unconstrained.
The SED fitting results of our gold and silver TDE sample (to be defined later in Sect. 4.3) are shown in Figs. B.3 and B.3.
4.2. Emission-line fitting
We fit the stellar continuum and nebular emission lines in our optical spectra using the penalized pixel-fitting code pPXF (Cappellari 2023) with the EMILES stellar library (Vazdekis et al. 2016). For sources with multiple LRIS spectra (IDs 5, 26, 58, and 66), we adopted the most recent, host-dominated spectrum for analysis. Each spectrum was modeled with three components: stellar continuum, narrow Balmer emission lines, and narrow forbidden lines. For objects exhibiting broad Balmer wings, we included an additional broad component.
For emission lines with S/N ≥ 3, we adopted the best-fit fluxes and uncertainties from pPXF. For lines with S/N < 3, we performed 1000 Monte Carlo realizations by perturbing the spectra with noise, and used the resulting flux distributions to estimate robust fluxes and uncertainties.
We also measured the equivalent width (EW) of emission lines. The EW is defined as
 (4)
(4)
where Fλ,obs is the observed spectrum and Fλ, cont is the continuum level estimated as the median flux in the line-free windows on either side of the emission line. The EW uncertainty was calculated via standard error propagation.
4.3. Sample classification
Although the X-ray flares from some AGN can mimic TDEs and contaminate X-ray–selected TDE samples, our ZTF/ATLAS forced photometry and uniform optical spectra for all host galaxies enable a systematic photometric and spectroscopic assessment of AGN interlopers. Below, we examine the available data to remove AGN contaminations, define a gold sample of events that we are most confident are TDEs, and a silver sample of events for which an AGN origin cannot be completely ruled out.
4.3.1. Identification and modeling of TDE candidates with optical flares
To identify TDE candidates exhibiting optical flares, we visually inspected2 the ATLAS and ZTF forced photometry light curves (see Figs. B.1–B.2). We only searched for optical flares showing a rise and decline, as opposed to stochastic variability characteristic of AGN.
We detected optical flares in 28 objects (IDs 2, 5, 15, 16, 17, 21, 23, 24, 26, 27, 30, 31, 38, 39, 40, 41, 43, 47, 48, 49, 55, 58, 63, 64, 65, 66, 67, andand 70). To estimate the optical light curve peak times and fluxes in a uniform fashion, we fit the 10-day binned forced photometry light curves with Gaussian Processes (GPs; see Aigrain & Foreman-Mackey 2023 for a review of GPs in time series data). We implemented the GP using the Python package George (Ambikasaran et al. 2015). To simultaneously fit light curves in different filters with known effective wavelengths, we adopted a 2D Matérn-3/2 kernel:
![Mathematical equation: $$ \begin{aligned}&k(t_i, t_j, \lambda _i, \lambda _j; \alpha , l_t, l_\lambda ) \\ \nonumber =&\alpha ^2 \left[1 +\frac{\sqrt{3}|t_i - t_j|}{l_t} \right]\mathrm{exp}\left[ -\frac{\sqrt{3}|t_i - t_j|}{l_t} \right]\\ \nonumber&\cdot \left[1 +\frac{\sqrt{3}|\lambda _i - \lambda _j|}{l_\lambda } \right]\mathrm{exp}\left[ -\frac{\sqrt{3}|\lambda _i - \lambda _j|}{l_\lambda } \right], \end{aligned} $$](/articles/aa/full_html/2026/04/aa58567-25/aa58567-25-eq6.gif) (5)
(5)
where α is the characteristic amplitude and lt and lλ are characteristic length scales in time and wavelength, respectively. This kernel function has been shown to be effective in fitting TDE light curves (Bhardwaj et al. 2025). Following Boone (2019), we fixed lλ at 6000 Å. We independently optimized the kernel parameters for each object using the minimize function in scipy. The fits were performed twice: first on the entire light curve duration to obtain a rough estimate of the peak flux time, and second using only data within 200 d of the peak flux.
The GP results (predicted flux evolution and 1σ uncertainties) are shown in Figs. B.1–B.2. Although we included data from all filters in the fitting, the GP predictions are most precise in filters with denser temporal coverage around peak (see a demonstration of this effect in Fig. 4 of Villar et al. 2020). We computed peak optical luminosities (Lopt, peak) and the peak time (topt, peak) from the filter with the best temporal sampling near peak. We converted Lopt, peak to the rest-frame g-band peak luminosity Lg,peak assuming a blackbody spectrum with temperature Tbb = 2 × 10⁴ K, typical for TDEs (Hammerstein et al. 2023). For events without detected optical flares, we derived 3σ upper limits, where σ is the greater of either the median forced photometry flux uncertainty or the standard deviation of the forced photometry flux3.
Among these, the flares of SRGe J155834.0+382528 (ID 43), SRGe J174505.5+104700 (ID 55), and SRGe J213214.8-003006 (ID 65) exhibit colors (g − r ≳ 0.5 mag and r − i ≳ 0.3 mag) that are much redder than typical TDEs4. The remaining 25 objects display optical flares with colors that are consistent with optically selected TDEs, with g − r < 0.3 mag at peak.
4.3.2. Identification of CrL-TDEs
After examining all LRIS spectra of our candidates, we identified two objects that exhibit high-ionization coronal lines: SRGe J004123.2-153705 (ID 2) and SRGe J201138.9-210935 (ID 63). The optical counterpart of SRGe J201138.9-210935 (ID 63), TDE 2021qth/ZTF21abhrchb, has been previously classified as a CrL-TDE by Yao et al. (2023). The optical counterpart of SRGe J004123.2-153705 (ID 2), AT 2021swi/ZTF21abkqvdo, exhibited an optical flare with a well-defined rise and decline coincident with the X-ray detection (see Fig. B.1), along with the characteristic spectroscopic features of a CrL-TDE (Fig. 1). We therefore classified it as a CrL-TDE as well.
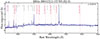 |
Fig. 1. Keck-I/LRIS optical spectrum of SRGe J004123.2−153705 (ID 2), a CrL-TDE. |
4.3.3. Removal of BLAGN
The AGN population can be broadly divided into BLAGN and narrow-line AGN (NLAGN) based on the full-width at half-maximum (FWHM) of Hα, with BLAGN exhibiting FWHM > 103 km s−1 (Stern & Laor 2012). In the AGN unification model (Antonucci 1993), BLAGN are viewed at low inclinations where high-energy X-ray emission from the central engine is directly observable, while NLAGN are viewed at higher inclinations where X-rays are obscured by the dusty torus.
We conservatively excluded all BLAGN from our sample, as intrinsic variations in the accretion rate can produce substantial X-ray flux changes that mimic TDE flares. We identified BLAGN by requiring a broad Hα component with FWHM > 1000 km s−1 in the pPXF fitting results (Sect. 4.2). pPXF detects 19 sources with broad Hα emission5. The top panel of Fig. 2 shows the distribution of these sources in the peak X-ray luminosity versus broad Hα line luminosity plane. We used the empirical LX–LHα, broad relation from Pulatova et al. (2025) as the primary diagnostic for identifying BLAGN. A total of 13 objects (IDs 1, 6, 8, 9, 18, 30, 42, 57, 59, 60, 62, 65, and 69) fall within the BLAGN locus and were classified accordingly. Two of these (IDs 30 and 65) exhibit optical flares identified in Sect. 4.3.1. The optical flare of ID 65 has AGN-like colors, while the colors of ID 30 are poorly constrained. We conservatively classified both as likely BLAGN flares rather than TDEs.
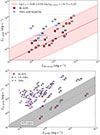 |
Fig. 2. Top: Peak 0.3–2.3 keV X-ray luminosity versus broad Hα luminosity for 19 of the initial 70 TDE candidates with a broad Hα component identified in Sect. 4.2. The solid line shows the best-fit relation from the corrected calibration of Pulatova et al. (2025), and the shaded region indicates the intrinsic scatter of the correlation. Note that the Hα luminosity of SRGe J234034.7+293400 (ID 69) is derived from the DESI spectrum (see Sect. 3.2), while the others are all from Keck LRIS spectra. Bottom: Peak X-ray luminosity (LX, peak) versus [O III] λ5007 luminosity for 56 non-BLAGN TDE candidates. The shaded region shows the AGN locus (Ueda et al. 2015) calibrated in the eROSITA 0.3–2.3 keV band (Khorunzhev et al. 2022), with the solid line indicating the median relation log(L[O III]/LX) = − 1.99 ± 0.63. Left-pointing triangles denote sources with upper limits on the [O III] line luminosity. |
Three sources (IDs 15, 58, and 66) fall near the upper edge of the BLAGN locus and require additional scrutiny. SRGe J023440.1-021812 (ID 15) exhibits, in addition to broad Balmer lines, broad Hβ and broad Mg IIλλ2796, 2803 emission which is rarely detected in known TDEs (Hung et al. 2019), favoring a BLAGN interpretation. In contrast, SRGe J175023.7+712857 (ID 58) and SRGe J213527.2-181635 (ID 66) both display broad helium lines (see Sect. 4.3.5) characteristic of TDEs and were therefore classified as TDEs with broad Hα rather than BLAGN.
The remaining three sources with detected broad Hα (IDs 5, 26, and 41) all exhibit TDE-like optical flares (Sect. 4.3.1). For IDs 5 and 26, LRIS spectra obtained during the optical flares show transient broad He II features (see Sect. 4.3.5), indicating the broad lines are transient rather than AGN-driven. For ID 41, LRIS spectra were obtained after the optical flare faded below ZTF sensitivity. Given the absence of other typical BLAGN signatures (broad Hβ, stochastic variability, or broad Mg II), we interpreted the detected broad Hα as associated with the TDE optical flare.
In summary, we identified 14 objects as BLAGN (IDs 1, 6, 8, 9, 15, 18, 30, 42, 57, 59, 60, 62, 65, and 69) and removed them from our TDE sample.
4.3.4. Assessment of NLAGN
Some of the X-ray transients are hosted by galaxies with strong narrow forbidden lines. We consider them as TDE candidates if the luminosity of the X-ray flare significantly exceeds the luminosity expected from AGN activity, which can be empirically computed using the [O III] λ5007 line luminosity (L[O III]). Furthermore, for sources that satisfy the above criterion, we consider them as high-confidence TDE candidates if the power source of the narrow forbidden lines is not AGN activity (i.e., not NLAGN). This can be examined using the Baldwin, Phillips, and Terlevich (BPT; Baldwin et al. 1981) and WHAN (Cid Fernandes et al. 2011) diagnostic diagrams.
The BPT diagram classifies galaxies using flux ratios of emission lines that are close in wavelength. This diagnostic framework distinguishes four galaxy types: star-forming, composite, Seyfert, and Low-Ionization Nuclear Emission-line Region (LINER; Heckman 1980) galaxies. Seyfert galaxies are AGN dominated by accretion-powered nuclear emission. Composite galaxies occupy an intermediate region and show mixed contributions from both star formation and AGN ionization (Kewley et al. 2006). The ionization source in LINER galaxies remains debated: while many LINERs harbor low-luminosity AGN, alternative mechanisms including shocks, outflows, or photoionization by post-asymptotic giant branch (post-AGB) stellar populations may also contribute (Ho et al. 1993; Filippenko 1996; Singh et al. 2013).
Many systems classified as composite or LINER on the BPT diagram are not genuine AGN. The WHAN diagram provides a cleaner separation between true AGN and such contaminants using the EW of Hα and the [N II]/Hα line flux ratio (Cid Fernandes et al. 2011). This framework classifies galaxies into five categories: star forming, strong AGN (sAGN), weak AGN (wAGN), retired, and passive. Galaxies classified as LINER in the BPT diagram but falling outside the sAGN or wAGN regions in the WHAN diagram are more consistent with ionization by hot evolved stars (e.g., post-AGB stars) rather than accretion activity. Similarly, BPT–composite galaxies falling outside the WHAN-sAGN region are more consistent with ionization by diffuse gas or evolved stellar populations rather than an active nucleus.
The L[OIII]–LX diagram is shown in the bottom panel of Fig. 2. The BPT diagrams using [O III]/Hβ versus [N II]/Hα and [S II]/Hα ratios are shown in Fig. 3. The WHAN diagram is shown in Fig. 4. All 56 non-BLAGN sources appear in the L[OIII]–LX diagram. However, as BPT and WHAN classifications require reliable measurements of narrow line fluxes, we only plotted sources for which all required lines were detected with S/N ≥ 5. The two BPT panels are generally consistent with each other, with no sources appearing as star-forming on one panel while being classified as Seyfert or LINER on the other. Discrepancies mainly occur among sources classified as Composite, Seyfert, or LINER. For sources that fall into different regions among these three categories between the two BPT panels, we conservatively adopted the classification indicating AGN presence (Seyfert or LINER) in BPT diagnostic. This classification is used later in Sect. 4.3.6 to ensure robust AGN exclusion from our high-confidence TDE sample.
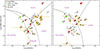 |
Fig. 3. Baldwin, Phillips, and Terlevich diagrams of the 56 non-BLAGN TDE candidates. Among them, only sources with S/N ≥ 5 in all required narrow emission lines are shown. The solid curves mark the theoretical maximum starburst demarcations of Kewley et al. (2006), and the dashed curve in the left panel shows the empirical boundary between star-forming and composite galaxies from Kauffmann et al. (2003a). |
On the L[OIII]–LX diagram, the shaded region shows the AGN locus (Ueda et al. 2015) calibrated in the eROSITA 0.3–2.3 keV band (Khorunzhev et al. 2022). Four sources that are not classified as CrL-TDEs fall within the AGN locus (IDs 12, 38, 53, and 55). Three (IDs 12, 53, and 55) are independently confirmed as AGN by both BPT and WHAN diagnostics (Figs. 3 and 4). The remaining source, SRGe J153134.9+330539 (ID 38; AT 2020ocn/ZTF20aabqihu), shows evidence of a TDE origin: it was previously identified as a TDE-He by Hammerstein et al. (2023) and exhibits strong early-time X-ray variability (Cao et al. 2024).
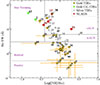 |
Fig. 4. WHAN diagram of the 56 non-BLAGN TDE candidates. Among them, only sources with S/N ≥ 5 in all required narrow emission lines are shown. The horizontal lines at EW(Hα) = 6 Å and 3 Å indicate the sAGN/wAGN and wAGN/retired divisions, respectively, following Cid Fernandes et al. (2011). |
We paid special attention to SRGe J155834.0+382528 (ID 43), which exhibits a red optical flare (Sect. 4.3.1; Fig. B.2). Although it does not fall within the AGN locus in Fig. 2, it is classified as composite in the BPT diagram and as sAGN in the WHAN diagram. We therefore conservatively classified it as an AGN flare rather than a TDE.
In summary, we identified four objects as NLAGN interlopers, three of which show weak X-ray flares (IDs 12, 53, and 55) and one that shows an AGN-like optical flare (ID 43). We removed all four from our TDE sample.
4.3.5. Identification and modeling of broad TDE lines in LRIS spectra
In this section we examine whether broad emission lines associated with the optical TDEs are detected in the LRIS spectra. We focus on the 50 objects that are not classified as AGN interlopers (Sect. 4.3.3–4.3.4) or CrL-TDEs (Sect. 4.3.2). As noted above, four TDEs (IDs 5, 26, 58, and 66) have multiple LRIS observations in which prominent broad lines that are well above the continuum and easily identifiable by eye are detected in earlier epochs.
Whether broad lines are detectable in the remaining 46 candidates depends on the timing and depth of the LRIS follow-up observations. In most cases, the LRIS follow-up occurred sufficiently late that the optical flare had faded below the ZTF sensitivity limit. According to the forced-photometry light curves in Appendix B, only three objects (IDs 17, 24, and 49) were observed while the optical flare was still detectable by ZTF. ID 17 was previously classified as a featureless TDE based on early-time observations (Yao et al. 2022), while IDs 24 and 49 have faint continuum fluxes (fν ≲ 3 μJy, m ≳ 22.7 mag), so the transient emission might be dominated by host-galaxy light. Nevertheless, broad lines could remain visible in our spectra even when ZTF forced photometry shows no optical flare, provided their luminosities fall below the ZTF detection threshold.
To systematically search for broad lines around the He II and Hα regions in the 46 candidates, we used the two Prospector fits described in Sect. 4.1. We first inspected the Prospector fits in which the He II and Hα regions were masked. We required the significance of EW of the He II (4000–5300 Å) or Hα (6400–6800 Å) regions to be greater than five. This procedure yielded four candidates exhibiting broad-line excess (IDs 39, 41, 64, and 70). Because template mismatch can produce spurious residuals, we also examined the unmasked Prospector fits. The broad-line excess persists in IDs 39, 41, and 70 but disappears for ID 64.
In total, we identified seven objects with flux excess around common TDE broad line regions in LRIS spectroscopy (IDs 5, 26, 39, 41, 58, 66, and 70). Following Charalampopoulos et al. (2022), we measured their line fluxes after subtracting two components from the observed LRIS spectra: (1) a scaled Prospector stellar continuum model (with He II and Hα masked) representing the host contribution, and (2) a low-order polynomial accounting for the optical flare continuum. In Fig. 5, the black lines in the top panels show the observed spectra (Fλ, obs), and the red lines show the combined continuum model (Fλ, cont).
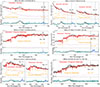 |
Fig. 5. Spectral modeling of six objects with broad lines associated with the TDE rather than AGN activity. The observed LRIS data are shown in black. The orange line shows the Prospector-derived host model, and the red line shows the final continuum (polynomial fit plus scaled host model). The continuum-subtracted residuals are shown in teal. The individual Gaussian fits are shown as dashed curves, with vertical dotted colored lines marking their rest-frame wavelengths: purple is for the Bowen blend, red is for He IIλ4686, orange is for Hβ, and blue is for the broad component of Hαλ6563. The solid black and blue curves show the total models in the He II and Hα regions, respectively. Gray bands indicate masked telluric regions. |
We modeled the emission lines with Gaussian profiles to determine their fluxes and kinematics. In the Hα region (6400–6700 Å), the main components include a narrow and a broad Hα component, and the [N II] λλ6548, 6583 doublet whose flux ratio was fixed at the theoretical value of 1:3. We included additional free-centered Gaussian components as needed to capture complex line structure (Nicholl et al. 2019; Charalampopoulos et al. 2022; Kumar et al. 2024)6. In the He II region (4000–5300 Å), we simultaneously fit He IIλ4686, Hβ, and Bowen blend features using both broad and narrow Gaussian components. For SRGe J235453.0+421711 (ID 70), which exhibits asymmetric blueshifted He II emission, we employed skewed Gaussian profiles following Kumar et al. (2024).
Model selection was guided by the Bayesian information criterion (BIC). A more complex model was adopted only when the improvement exceeds ΔBIC > 10, a threshold commonly interpreted as very strong evidence in favor of the more complex model (Kass & Raftery 1995; Lorah & Womack 2019). This criterion ensures that additional components are statistically justified while minimizing the risk of overfitting. The measured line properties (luminosity, FWHM, and EW) are presented in Table A.5. We note that broad line detections in SRGe J153331.5+390536 (ID 39) have rather low significance (5.2σ for He II and 2.0σ for Hα), and we therefore excluded this object from further discussion. The residual spectra and Gaussian fitting results for the other six objects are shown in the bottom panels of Fig. 5.
For spectra where Hα or He IIλ4686 lines are not detected, we computed 3σ upper limits on line luminosities from the residual spectrum. We integrated the residual flux over ±500 km s−1 velocity windows centered on each line. To properly account for measurement uncertainties, we performed 10 000 Monte Carlo realizations by perturbing the spectra with noise. The 99.73rd percentile of the resulting flux distribution defines the 3σ upper limit. These luminosity upper limits are also listed in Table A.5. We discuss the results of this analysis in Sect. 5.2.
4.3.6. Final sample definition
Among the 70 eROSITA TDE candidates, we removed 18 AGN interlopers in Sect. 4.3.3 and Sect. 4.3.4. To further identify high-confidence TDEs among the remaining 52 objects, we defined a gold sample using the following criteria:
-
Events with TDE-like optical flares (Sect. 4.3.1) that are not classified as AGN interlopers were included in the gold sample. A total of 23 events satisfied this criterion (IDs 2, 5, 16, 17, 21, 23, 24, 26, 27, 31, 38, 39, 40, 41, 47, 48, 49, 58, 63, 64, 66, 67, and 70).
-
For the remaining 29 events, those with host galaxies classified as retired or passive on the WHAN diagram were included. A total of ten events satisfied this criterion (IDs 4, 7, 13, 32, 33, 34, 46, 54, 61, and 68).
-
For the remaining 19 events, those with host galaxies classified as composite on the BPT diagram and non-sAGN on the WHAN diagram were included. A total of three events satisfied this criterion (IDs 19, 20, and 45).
-
Among the remaining 16 events, eight lack detected emission lines and therefore do not appear in the BPT and WHAN diagrams (IDs 10, 22, 28, 36, 44, 50, 52, and 56). Five of these (IDs 10, 22, 28, 44, and 50) are quiescent galaxies with minimal emission, while three (IDs 36, 52, and 56) have low signal-to-noise spectra near the Hα and/or Hβ regions. We included the five quiescent galaxy hosts in the gold sample, as they show no AGN signatures.
Our final classification yielded a gold sample of 41 objects (Table A.3) and a silver sample of 11 objects (Table A.4).
4.4. SDSS comparison sample
We constructed a volume-limited SDSS comparison sample for TDE host galaxies based on completeness. First, we identified the minimum stellar mass in our TDE sample (M*, min = 109.3 M⊙), then computed the completeness redshift zcomplete by analyzing the number density ϕ(z) of SDSS galaxies in a mass bin (±0.15 dex) centered on M*, min. The number density was calculated in redshift bins of Δz = 0.01, accounting for comoving volume effects. zcomplete is defined as the redshift where the density drops below 70% of its reference value, computed over z = 0.02–0.06, yielding zcomplete = 0.065.
We selected SDSS galaxies with z < zcomplete = 0.065. The sample was cross-matched with the stellar mass catalog from Mendel et al. (2014) and the NYU Value-Added Galaxy Catalog (Blanton et al. 2005), and rest-frame u − r colors were computed from K-corrected photometry. This results in a volume-limited sample of 144,801 SDSS galaxies. For spectral feature analysis, we further required SDSS galaxies to have measurements in the MPA-JHU catalog (Kauffmann et al. 2003b; Brinchmann et al. 2004; Tremonti et al. 2004).
5. Results and discussion
5.1. Optical light curves of X-ray-selected TDEs
Here we discuss the optical light curve properties of X-ray-selected TDEs. In our gold TDE sample, 23 of 41 events exhibit optical flares detected in forced photometry.
Figure 6 shows the distribution of our gold sample in the Lg,peak versus LX, peak plane. The peak rest-frame g-band luminosity is computed in Sect. 4.3.1. The peak X-ray luminosity LX, peak is estimated from the observed peak flux (fX, peak in Tables A.1 and A.1) captured by the 6-month cadence eROSITA survey and is therefore likely fainter than the true intrinsic X-ray peak. Nevertheless, 35 of 41 events have Lg,peak < LX,peak, demonstrating that the majority of X-ray-selected TDEs are intrinsically brighter in X-rays than in the optical.
 |
Fig. 6. Peak rest-frame g-band luminosity versus peak X-ray luminosity for the 41 TDEs in our gold sample. |
Delayed X-ray brightening is commonly observed in optically selected TDEs (Guolo et al. 2024a). This raises the question of whether this feature is intrinsic to the TDE population or a result of selection effects. To investigate this, we measured the time difference between the time of the peak X-ray flux detected by eROSITA (tX, peak in Tables A.1) and the optical peak from the best-fit GP model (Sect. 4.3.1). This estimate has large uncertainties for individual events due to eROSITA’s 6-month cadence and seasonal gaps in optical light curves. However, with 23 events exhibiting optical flares, the distribution of rest-frame time difference [Δtrest = (tX, peak − topt, peak)/(1 + z)] provides meaningful constraints on the underlying population properties.
Figure 7 shows the distribution of Δtrest, which is positively skewed (skewness = 1.90). The median time difference is 128 d, with 68% of events falling between 6 d and 278 d (16th and 84th percentiles, respectively). The 90% range spans −18 d to 365 d. Despite the large uncertainties in the peak time estimates, a number of events exhibit Δtrest values that are consistent with zero, indicating nearly simultaneous X-ray and optical peaks. We note that delayed X-ray brightening, while common, exhibits substantial event-to-event variation.
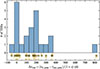 |
Fig. 7. Time difference between the peak X-ray and peak optical emission for 23 TDEs in the gold sample with detected optical flares. The distribution is shown as a histogram, with individual measurements marked along the x-axis. Our sample demonstrates that a delayed X-ray peak is common among X-ray-selected TDEs. |
We highlight two events. SRGe J131014.7+444319 (ID 26) has the smallest value of Δtrest = −51 d, with the eROSITA detection occurring near the beginning of the optical flare (Fig. B.2). This event may be analogous to TDE 2022dsb, which showed transient fading X-ray emission detected by eROSITA-DE during the rise of the optical light curve (Malyali et al. 2024). At the opposite extreme, SRGe J162159.4+271133 (ID 47) exhibits the longest delay, Δtrest = 817 d (see Fig. B.2). However, without prompt X-ray follow-up observations, we cannot constrain the physical origin of the X-ray emission in either case.
5.2. Optical broad-line properties of X-ray-selected TDEs
In Sect. 4.3.5 we identified significant broad emission lines around He IIλ4686 and Hα in LRIS spectra of six objects. Figure 8 displays the evolution of their line luminosities. Below, we discuss their possible physical origins.
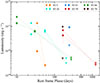 |
Fig. 8. Broad emission line luminosity evolution for six TDEs in our gold sample with significant broad lines detected in our Keck spectra (see Sect. 4.3.5). Circles and diamonds represent the fit luminosity of the He IIλ4686 (broad or shifted components) and Hα (broad plus shifted components) transient lines, respectively. Downward triangles indicate 3σ upper limits. |
5.2.1. Broad Hα without He (ID 41)
SRGe J153503.3+455054 (ID 41) exhibits intermediate-width (FWHM ∼ 2700 km s−1) luminous (∼1041 erg s−1) Hα emission ∼300 d after the X-ray peak (∼500 d after the optical peak). The line width and luminosity are reminiscent of features reported by Somalwar et al. (2025), which may originate from dense clumps of outflowing gas in the circumnuclear medium.
5.2.2. Broad He without Hα (ID 70)
SRGe J235453.0+421711 (ID 70) exhibits an asymmetric broad feature consistent with luminous (∼1041 erg s−1) He IIλ4686 emission that is blueshifted with pronounced negative skewness7. The line exhibits FWHM ∼ 2 × 10⁴ km s−1 and is blueshifted by 0.04c relative to the rest frame, which is comparable to FWHM (0.08c). Similar profiles have been observed in optically selected TDEs such as TDE 2019qiz (Nicholl et al. 2020) and TDE 2023vto (Kumar et al. 2024), consistent with emission from an expanding, optically thick outflow where line broadening is dominated by bulk gas motion.
5.2.3. Broad Hα and He (IDs 5, 26, 58, and 66)
Four objects (IDs 5, 26, 58, and 66) show both He IIλ4686 and Hα broad lines, all with multiple LRIS spectra. A common feature is extremely broad He IIλ4686 (FWHM ≳ 2 × 10⁴ km s−1). The best-fit Gaussian centers are consistent with the rest-frame wavelength, indicating that the line broadening is dominated by electron scattering rather than bulk kinematic motion. This suggests that in X-ray-selected TDEs, the He II line photosphere is likely located closer to the central ionizing source, resulting in higher electron scattering optical depth and consequently greater line width.
Two objects (IDs 58 and 66) exhibit complex Hα profiles requiring multiple Gaussian components. In SRGe J175023.7+712857 (ID 58), the Hα profile resembles known double-peaked TDEs such as TDE 2018hyz (Hung et al. 2020; Short et al. 2020), TDE 2020zso (Wevers et al. 2022), and TDE 2020nov (Earl et al. 2025). The bluest and reddest peaks are ≈4000 km s−1 shifted from rest-frame Hα, consistent with an accretion disk origin. In SRGe J213527.2-181635 (ID 66), both the +11 day and +33 day spectra show a blue component peaked ≈4000 km s−1 blueward of rest-frame Hα, with no corresponding red component. Notably, both events show simple He IIλ4686 profiles well-described by single Gaussians with FWHM ∼ 2 × 10⁴ km s−1, suggesting different dominant line production mechanisms for He IIλ4686 and Hα.
In SRGe J131014.7+444319 (ID 26), the broad He IIλ4686 and Hα have comparable widths. The +29 d spectrum shows a luminosity ratio LHe II/LHα ∼ 2.9, which declined to ∼1.1 at +67 d. This evolution is consistent with the optically thick reprocessing picture of Roth et al. (2016), where Hα line strength is suppressed when the outer envelope radius is small, as expected in this X-ray-selected TDE.
In SRGe J011603.1+072258 (ID 5), the Hα component (FWHM ∼ 4000 km s−1) is much narrower than the He IIλ4686 line. We speculate that the Hα originates from a region farther from the black hole, similar to SRGe J153503.3+455054 discussed in Sect. 5.2.1.
5.3. Host properties
In this section we discuss the host galaxy properties of our gold TDE sample. The silver sample is shown in figures for reference but is not the focus of our discussion.
5.3.1. Host colors versus stellar mass
Galaxy colors provide a simple diagnostic of star formation activity and quenching, thus allowing us to test whether TDE hosts preferentially reside in star-forming, quiescent, or transitional (green valley) galaxies. Figure 9 presents the Galactic extinction corrected rest-frame u − r color as a function of stellar mass for our final TDE host sample. Both quantities are derived from the Prospector SED fits. Gold (yellow) and silver (gray) subsamples are distinguished, with CrL-TDEs (in the gold sample) highlighted separately in green. The background contours show the distribution of our volume limited SDSS comparison galaxies (see Sect. 4.4).
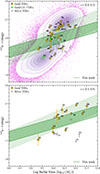 |
Fig. 9. Color–mass diagram for the final 52 TDE host sample (41 gold and 11 silver). The light-green band indicates the green valley region defined by Schawinski et al. (2014). The darker green band shows our empirically derived green valley definition based on our SDSS comparison sample. Background contours are derived from our SDSS comparison galaxies (Sect. 4.4), shown at the 6.7–93.3% density levels. |
We defined the green valley empirically by identifying the density minimum in the color distribution between the “blue cloud” and “red sequence” galaxy populations in our comparison sample. A linear fit yielded
 (6)
(6)
with a half-width of δ = 0.140 mag estimated from the residual distribution. This approach directly traces the low-density transitional region.
To assess whether TDE hosts preferentially occupy the green valley, we performed a one-sided binomial test on our gold sample under the null hypothesis that TDE hosts are randomly drawn from the volume-limited SDSS comparison sample. The enrichment p-value was defined as
 (7)
(7)
where k is the number of TDE hosts in the green valley, n is the total sample size, and fSDSS is the green valley fraction in the volume-limited SDSS comparison sample. We also report the fold enrichment Fold = fTDE/fSDSS. We adopt a stringent significance threshold of penrich < 0.001 to claim genuine green valley preference, given our modest sample size.
Quantitatively, 26.8% (11/41) of our gold sample fall within the tuned green valley, with a 1.84-fold enrichment over our SDSS comparison sample. However, this enrichment does not meet the statistical significance for either the entire sample (p = 0.0295 > 0.001) or the low redshift bin (p = 0.1191 > 0.001), and we therefore found no strong evidence of a preference for green valley galaxies in X-ray-selected TDEs. The majority of the remaining TDEs are found in red sequence galaxies (46.3%, 19/41), with a smaller fraction in blue sequence galaxies (26.8%, 11/41). The red sequence shows a modest 1.24-fold enhancement that is not statistically significant (p = 0.154), and we find no enrichment of TDEs in blue sequence galaxies relative to the SDSS comparison sample (0.56-fold). These results are consistent in both the whole sample and the subsample in the z = 0.0–0.2 bin.
Our gold sample spans a broader u − r color and stellar mass range than previous host galaxy studies of X-ray-selected TDEs (French et al. 2020; Sazonov et al. 2021; Grotova et al. 2025a), aligning more closely with the ZTF optical TDE sample (Yao et al. 2023). Mid-infrared-selected TDEs presented by Masterson et al. (2024) preferentially occur in high-mass, low-redshift hosts. Masterson et al. (2024) attribute this trend to the high MIR-flare luminosity threshold of WISE-based selection, which favors more MBHs and hence more massive galaxies. In contrast, our eROSITA-selected hosts extend to higher redshift and occupy a more moderate mass regime. Within our sample, the higher-z subset shifts to higher stellar mass, which may reflect flux-limited selection and host-galaxy mass-completeness effects. Together, these comparisons indicate the possible strong selection and redshift dependence of inferred TDE host demographics.
5.3.2. Lick indices: HδA versus Hα EW
Previous work has shown that optically selected TDEs are frequently hosted by rare QBS or E+A galaxies with strong Balmer absorption and weak Hα emission. Specifically, using a sample of eight optically selected TDEs, French et al. (2016) found that quiescent galaxies with at least moderately strong Balmer absorption are overrepresented among the TDE hosts by a factor of  . Graur et al. (2018) considered 35 TDE candidates selected by both X-ray and optical surveys, finding that the overrepresentation factor is
  . More recently, using a sample of 19 ZTF TDEs, Hammerstein et al. (2021) found an overrepresentation factor of 16. The eROSITA selected sample (13 objects) presented by Sazonov et al. (2021) suggests a much weaker association with this class of hosts.
Figure 10 shows the Lick HδA absorption index versus the Hα EW for our TDE host sample. Line indices and uncertainties were measured with pPXF (Sect. 4.2). Following French et al. (2016) and Hammerstein et al. (2021), we define the E+A region by HδA − σ(HδA) > 4.0 and EW(Hαem) < 3.0 (solid box), and the QBS region by HδA > 1.31 and EW(Hαem) < 3.0 (dashed box).
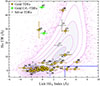 |
Fig. 10. Lick HδA absorption index versus Hα emission EW for our final 52 TDE host sample. The background shows the SDSS comparison sample with contours at σ-equivalent probability levels (6.7–93.3%). The solid and dashed boxes mark the E+A and QBS regions, respectively. To avoid label overlap, our gold and silver hosts near the origin are not individually labeled since many are clustered there. |
First, we tested the hypothesis that the distribution of our 40 gold TDE host galaxies in the Lick HδA vs. EW(Hα) diagram is consistent with the comparison sample using a 2D Kolmogorov–Smirnov (KS) test (Fasano & Franceschini 1987). We did not include SRGe J163831.9+534018 (ID 50) in this analysis, as Hα is not available due to limited spectral coverage. The resulting p = 2.39 × 10⁻⁹ strongly rejects the null hypothesis. This is not unexpected, as the EW(Hα) values of our gold TDE hosts are generally lower than the comparison sample, indicating suppressed SFRs.
Next, we tested whether our gold TDE hosts are overrepresented in the QBS and E+A regions using the binomial test described in Sect. 5.3.1. For the E+A region, 2 of 40 galaxies (5.0%) fall within the boundary, with Fold = 10.17 and penrich = 1.66 × 10⁻². This suggests enrichment but does not reach our statistical significance threshold. For the QBS region, 5 of 40 galaxies (12.5%) fall within the boundary, with Fold = 5.27 and penrich = 2.48 × 10⁻³. This indicates QBS hosts enrichment but again does not reach our statistical significance threshold. Unlike previous studies of optically and X-ray-selected TDE hosts, which found a strong preference for quiescent galaxies (French et al. 2016, 2020; Graur et al. 2018; Hammerstein et al. 2021), our X-ray-selected sample shows more modest enrichment.
5.3.3. Recent SFR versus stellar mass
Unlike single-band tracers (e.g., Hα and UV), our SFR100 are derived from Prospector’s nonparametric SFHs, providing a self-consistent 100 Myr average. Compared to the color–mass diagram (Sect. 5.3.1), the SFR100–M* relation offers a complementary view of star formation in X-ray-selected TDE hosts.
Figure 11 shows the SFR averaged over the past 100 Myr (SFR100) versus stellar mass from our Prospector fits. The background distribution shows the volume-limited SDSS comparison sample, and the solid black line indicates the star-forming main sequence from Popesso et al. (2023). We display our host galaxies in two redshift bins (0.0 ≤ z < 0.2 and 0.2 ≤ z < 0.8) to account for the known redshift evolution of the star-forming main sequence.
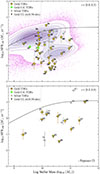 |
Fig. 11. Star formation rate averaged over the past 100 Myr (SFR100) versus stellar mass for our final 52 TDE hosts split into two redshift bins (0.0 ≤ z < 0.2 and 0.2 ≤ z < 0.8). The pink background shows the volume-limited SDSS comparison sample described with SFR measurement. The solid black line marks the redshift-dependent star-forming main sequence from Popesso et al. (2023). |
Quantitatively, across both redshift bins, the vast majority of hosts falls below the star-forming main sequence (defined as lying below the main sequence of Popesso et al. 2023). In the low-redshift bin (0.0 ≤ z < 0.2), 96.3% (26/27) of gold hosts are below the main sequence. In the high-redshift bin (0.2 ≤ z < 0.8), 100.0% (10/10) of gold hosts are below the main sequence. Most gold hosts have SFR100 values typically between 10−3 and 1 M⊙ yr−1, consistent with suppressed or quenching star formation. SRGe J170139.0-085911 (ID 52) appears as an outlier above the sequence, though its Prospector fit may likely overestimate the SFR8.
The X-ray-selected TDE hosts predominantly avoid the star-forming main sequence. This result is consistent with the color–mass and line-index diagnostics, which also place most hosts in transitional or weakly star-forming regimes rather than strongly star-forming disks. The preference for hosts below the main sequence is expected, as dustier star-forming galaxies can strongly absorb soft X-ray emission, making TDEs harder to detect (Panagiotou et al. 2023).
6. Conclusion
We have presented uniform Keck-I/LRIS observations, host galaxy modeling, and optical light curve and spectroscopic analysis for 70 TDE candidates selected from eROSITA all-sky surveys in the eastern Galactic hemisphere. We developed a robust method for removing AGN interlopers and applied it to the selected candidates, yielding a final sample of 52 TDEs with redshifts of 0.018 ≤ z ≤ 0.714. This final TDE sample contained 41 high-confidence (gold) events and 11 lower-confidence (silver) events. The main results for our gold sample are described as follows:
-
The majority of the X-ray-selected TDEs are intrinsically X-ray-bright, with 35/41 (85%) exhibiting LX,peak > Lg,peak (see Fig. 6).
-
The X-ray emission typically peaks around 6–278 days (68% range) after the optical peak in events with detected optical flares (Fig. 7), confirming that delayed X-ray brightening is common in the TDE population.
-
We identified TDE-associated spectral features in eight events: two CrL-TDEs (Sect. 4.3.2) and six with prominent broad emission lines (Sect. 4.3.5). The uniformly broad He IIλ4686 emission (FWHM ∼2 × 10⁴ km s−1) indicates a high electron scattering optical depth, while the diverse Hα line profiles suggest multiple emission mechanisms (Sect. 5.2).
-
The X-ray-selected TDE hosts show modest overrepresentation in green valley (1.8×; Sect. 5.3.1) and QBS (5.3×; Sect. 5.3.2) galaxies, which are significantly weaker than optical and pre-eROSITA X-ray samples (see, e.g., French et al. 2020). This demonstrates that eROSITA TDE hosts span a broader range of SFHs than previous samples of TDE hosts.
-
Our TDE hosts generally exhibit lower SFRs relative to the star-forming main sequence (Sect. 5.3.3). This might be explained by the fact that star-forming galaxies contain more dust, which strongly absorb soft X-rays and make TDE selection in the soft X-ray band challenging.
This work represents a substantial and well-characterized subsample of eROSITA-RU-selected TDEs. That said, we remind the reader that our X-ray selection (Sect. 2.1) is not uniform and that a forthcoming study will present the complete eROSITA-RU TDE sample with a uniform analysis. The observed diversity in both the TDE properties and host galaxy characteristics presented here should guide future theoretical models of TDE emission mechanisms and their dependence on environment.
Acknowledgments
This work uses data obtained with eROSITA telescope on board the SRG observatory. The SRG observatory was built by Roskosmos with the participation of the Deutsches Zentrum für Luft- und Raumfahrt (DLR). The SRG/eROSITA X-ray telescope was built by a consortium of German Institutes led by MPE, and supported by DLR. The SRG spacecraft was designed, built, launched and is operated by the Lavochkin Association and its subcontractors. The science data were downlinked via the Deep Space Network Antennae in Bear Lakes, Ussurijsk, and Baykonur, funded by Roskosmos. The eROSITA data used in this work were processed using the eSASS software system developed by the German eROSITA consortium and proprietary data reduction and analysis software developed by the Russian eROSITA Consortium. MG and SS acknowledge support by the Ministry of Science and Higher Education grant 075-15-2024-647. Some of the data presented herein were obtained at Keck Observatory, which is a private 501(c)3 non-profit organization operated as a scientific partnership among the California Institute of Technology, the University of California, and the National Aeronautics and Space Administration. The Observatory was made possible by the generous financial support of the W. M. Keck Foundation. The authors wish to recognize and acknowledge the very significant cultural role and reverence that the summit of Maunakea has always had within the Native Hawaiian community. We are most fortunate to have the opportunity to conduct observations from this mountain.
References
- Aigrain, S., & Foreman-Mackey, D. 2023, ARA&A, 61, 329 [NASA ADS] [CrossRef] [Google Scholar]
- Alexander, K. D., van Velzen, S., Horesh, A., & Zauderer, B. A. 2020, Space Sci. Rev., 216, 81 [CrossRef] [Google Scholar]
- Ambikasaran, S., Foreman-Mackey, D., Greengard, L., Hogg, D. W., & O’Neil, M. 2015, IEEE Trans. Pattern Anal. Mach. Intell., 38, 252 [Google Scholar]
- Andalman, Z. L., Liska, M. T. P., Tchekhovskoy, A., Coughlin, E. R., & Stone, N. 2022, MNRAS, 510, 1627 [Google Scholar]
- Antonucci, R. 1993, ARA&A, 31, 473 [Google Scholar]
- Arcavi, I., Gal-Yam, A., Sullivan, M., et al. 2014, ApJ, 793, 38 [Google Scholar]
- Bade, N., Komossa, S., & Dahlem, M. 1996, A&A, 309, L35 [NASA ADS] [Google Scholar]
- Baldwin, J. A., Phillips, M. M., & Terlevich, R. 1981, PASP, 93, 5 [Google Scholar]
- Beck, R., Szapudi, I., Flewelling, H., et al. 2021, MNRAS, 500, 1633 [Google Scholar]
- Bellm, E. C., Kulkarni, S. R., Graham, M. J., et al. 2019, PASP, 131, 018002 [Google Scholar]
- Bhardwaj, K., Christov, A., & Karpov, S. 2025, A&A, 703, A95 [NASA ADS] [CrossRef] [EDP Sciences] [Google Scholar]
- Blanton, M. R., Schlegel, D. J., Strauss, M. A., et al. 2005, AJ, 129, 2562 [NASA ADS] [CrossRef] [Google Scholar]
- Boone, K. 2019, AJ, 158, 257 [NASA ADS] [CrossRef] [Google Scholar]
- Brandt, W. N., Pounds, K. A., & Fink, H. 1995, MNRAS, 273, L47 [Google Scholar]
- Brinchmann, J., Charlot, S., White, S. D. M., et al. 2004, MNRAS, 351, 1151 [Google Scholar]
- Callow, J., Graur, O., Clark, P., et al. 2024, MNRAS, 535, 1095 [Google Scholar]
- Cao, Z., Jonker, P. G., Pasham, D. R., et al. 2024, ApJ, 970, 89 [NASA ADS] [CrossRef] [Google Scholar]
- Cappellari, M. 2023, MNRAS, 526, 3273 [NASA ADS] [CrossRef] [Google Scholar]
- Cardelli, J. A., Clayton, G. C., & Mathis, J. S. 1989, ApJ, 345, 245 [Google Scholar]
- Chambers, K. C., Magnier, E. A., Metcalfe, N., et al. 2016, ArXiv e-prints [arXiv:1612.05560] [Google Scholar]
- Charalampopoulos, P., Leloudas, G., Malesani, D. B., et al. 2022, A&A, 659, A34 [NASA ADS] [CrossRef] [EDP Sciences] [Google Scholar]
- Charlot, S., & Fall, S. M. 2000, ApJ, 539, 718 [Google Scholar]
- Cid Fernandes, R., Stasińska, G., Mateus, A., & Vale Asari, N. 2011, MNRAS, 413, 1687 [Google Scholar]
- Clark, P., Callow, J., Graur, O., et al. 2025, MNRAS, 540, 871 [Google Scholar]
- Conroy, C., & Gunn, J. E. 2010, Astrophysics Source Code Library [record ascl:1010.043] [Google Scholar]
- Cutri, R. M., Wright, E. L., Conrow, T., et al. 2013, Explanatory Supplement to the AllWISE Data Release Products [Google Scholar]
- Cutri, R. M., Wright, E. L., Conrow, T., et al. 2021, VizieR On-line Data Catalog: II/328 [Google Scholar]
- De Colle, F., & Lu, W. 2020, New Astron. Rev., 89, 101538 [Google Scholar]
- DESI Collaboration (Abdul-Karim, M., et al.) 2025, ArXiv e-prints [arXiv:2503.14745] [Google Scholar]
- Dey, A., Schlegel, D. J., Lang, D., et al. 2019, AJ, 157, 168 [Google Scholar]
- Draine, B. T., & Li, A. 2007, ApJ, 657, 810 [CrossRef] [Google Scholar]
- Earl, N., French, K. D., Ramirez-Ruiz, E., et al. 2025, ApJ, 983, 28 [Google Scholar]
- Eisenhardt, P. R. M., Marocco, F., Fowler, J. W., et al. 2020, ApJS, 247, 69 [Google Scholar]
- Evans, P. A., Nixon, C. J., Campana, S., et al. 2023, Nat. Astron., 7, 1368 [NASA ADS] [CrossRef] [Google Scholar]
- Fasano, G., & Franceschini, A. 1987, MNRAS, 225, 155 [NASA ADS] [CrossRef] [Google Scholar]
- Filippenko, A. V. 1996, ASP Conf. Ser., 103, 17 [Google Scholar]
- Flewelling, H. A., Magnier, E. A., Chambers, K. C., et al. 2020, ApJS, 251, 7 [NASA ADS] [CrossRef] [Google Scholar]
- French, K. D., Arcavi, I., & Zabludoff, A. 2016, ApJ, 818, L21 [NASA ADS] [CrossRef] [Google Scholar]
- French, K. D., Wevers, T., Law-Smith, J., Graur, O., & Zabludoff, A. I. 2020, Space Sci. Rev., 216 [Google Scholar]
- Gaia Collaboration (Vallenari, A., et al.) 2023, A&A, 674, A1 [NASA ADS] [CrossRef] [EDP Sciences] [Google Scholar]
- Gallazzi, A., Charlot, S., Brinchmann, J., White, S. D. M., & Tremonti, C. A. 2005, MNRAS, 362, 41 [Google Scholar]
- Gezari, S. 2021, ARA&A, 59, 21 [NASA ADS] [CrossRef] [Google Scholar]
- Graham, M. J., Kulkarni, S. R., Bellm, E. C., et al. 2019, PASP, 131, 078001 [Google Scholar]
- Graur, O., French, K. D., Zahid, H. J., et al. 2018, ApJ, 853, 39 [NASA ADS] [CrossRef] [Google Scholar]
- Grotova, I., Rau, A., Baldini, P., et al. 2025a, A&A, 697, A159 [NASA ADS] [CrossRef] [EDP Sciences] [Google Scholar]
- Grotova, I., Rau, A., Salvato, M., et al. 2025b, A&A, 693, A62 [NASA ADS] [CrossRef] [EDP Sciences] [Google Scholar]
- Grupe, D., Beuerman, K., Mannheim, K., et al. 1995, A&A, 300, L21 [NASA ADS] [Google Scholar]
- Guolo, M., Gezari, S., Yao, Y., et al. 2024a, ApJ, 966, 160 [NASA ADS] [CrossRef] [Google Scholar]
- Guolo, M., Pasham, D. R., Zajaček, M., et al. 2024b, Nat. Astron., 8, 347 [Google Scholar]
- Hammerstein, E., Gezari, S., van Velzen, S., et al. 2021, ApJ, 908, L20 [NASA ADS] [CrossRef] [Google Scholar]
- Hammerstein, E., van Velzen, S., Gezari, S., et al. 2023, ApJ, 942, 9 [NASA ADS] [CrossRef] [Google Scholar]
- Hannah, C. H., Stone, N. C., Seth, A. C., & van Velzen, S. 2025, ApJ, 988, 29 [Google Scholar]
- Heckman, T. M. 1980, A&A, 87, 152 [Google Scholar]
- Hinkle, J. T., Shappee, B. J., & Holoien, T. W.-S. 2024, MNRAS, 528, 4775 [Google Scholar]
- Ho, L. C., Filippenko, A. V., & Sargent, W. L. W. 1993, ApJ, 417, 63 [NASA ADS] [CrossRef] [Google Scholar]
- Ho, A. Y. Q., Yao, Y., Matsumoto, T., et al. 2025, ApJ, 989, 54 [Google Scholar]
- Hung, T., Cenko, S. B., Roth, N., et al. 2019, ApJ, 879, 119 [NASA ADS] [CrossRef] [Google Scholar]
- Hung, T., Foley, R. J., Ramirez-Ruiz, E., et al. 2020, ApJ, 903, 31 [NASA ADS] [CrossRef] [Google Scholar]
- Jiang, N., Wang, T., Hu, X., et al. 2021, ApJ, 911, 31 [NASA ADS] [CrossRef] [Google Scholar]
- Johnson, B. D., Leja, J., Conroy, C., & Speagle, J. S. 2021, ApJS, 254, 22 [NASA ADS] [CrossRef] [Google Scholar]
- Kass, R. E., & Raftery, A. E. 1995, J. Am. Statist. Assoc., 90, 773 [CrossRef] [Google Scholar]
- Kauffmann, G., Heckman, T. M., Tremonti, C., et al. 2003a, MNRAS, 346, 1055 [Google Scholar]
- Kauffmann, G., Heckman, T. M., White, S. D. M., et al. 2003b, MNRAS, 341, 33 [Google Scholar]
- Kewley, L. J., Groves, B., Kauffmann, G., & Heckman, T. 2006, MNRAS, 372, 961 [Google Scholar]
- Khabibullin, I., Sazonov, S., & Sunyaev, R. 2014, MNRAS, 437, 327 [Google Scholar]
- Khabibullin, I., Medvedev, P., Churazov, E., et al. 2020a, ATel., 13499, 1 [Google Scholar]
- Khabibullin, I., Sunyaev, R., Churazov, E., et al. 2020b, ATel., 13494, 1 [Google Scholar]
- Khorunzhev, G. A., Sazonov, S. Y., Medvedev, P. S., et al. 2022, Astron. Lett., 48, 767 [Google Scholar]
- Khorunzhev, G. A., Sazonov, S. Y., Medvedev, P. S., et al. 2024, Astron. Lett., 50, 744 [Google Scholar]
- Komossa, S. 2015, J. High Energy Astrophys., 7, 148 [Google Scholar]
- Komossa, S., & Greiner, J. 1999, A&A, 349, L45 [NASA ADS] [Google Scholar]
- Komossa, S., Zhou, H., Wang, T., et al. 2008, ApJ, 678, L13 [NASA ADS] [CrossRef] [Google Scholar]
- Kriek, M., & Conroy, C. 2013, ApJ, 775, L16 [NASA ADS] [CrossRef] [Google Scholar]
- Kumar, H., Berger, E., Hiramatsu, D., et al. 2024, AT2023vto: An Exceptionally Luminous Helium Tidal Disruption Event from a Massive Star [Google Scholar]
- Liu, Z., Malyali, A., Krumpe, M., et al. 2023, A&A, 669, A75 [NASA ADS] [CrossRef] [EDP Sciences] [Google Scholar]
- Lorah, J., & Womack, A. 2019, Behavior Res Methods, 51, 440 [Google Scholar]
- Malyali, A., Liu, Z., Merloni, A., et al. 2023, MNRAS, 520, 4209 [NASA ADS] [CrossRef] [Google Scholar]
- Malyali, A., Rau, A., Bonnerot, C., et al. 2024, MNRAS, 531, 1256 [NASA ADS] [CrossRef] [Google Scholar]
- Martin, D. C., Fanson, J., Schiminovich, D., et al. 2005, ApJ, 619, L1 [Google Scholar]
- Masci, F. J., Laher, R. R., Rusholme, B., et al. 2019, PASP, 131, 018003 [Google Scholar]
- Masci, F. J., Laher, R. R., Rusholme, B., et al. 2023, ArXiv e-prints [arXiv:2305.16279] [Google Scholar]
- Masterson, M., De, K., Panagiotou, C., et al. 2024, ApJ, 961, 211 [NASA ADS] [CrossRef] [Google Scholar]
- Medvedev, P. S., Gilfanov, M. R., Sazonov, S. Y., Sunyaev, R. A., & Khorunzhev, G. A. 2022, Astron. Lett., 48, 735 [Google Scholar]
- Mendel, J. T., Simard, L., Palmer, M., Ellison, S. L., & Patton, D. R. 2014, ApJS, 210, 3 [Google Scholar]
- Million, C., Fleming, S. W., Shiao, B., et al. 2016, ApJ, 833, 292 [NASA ADS] [CrossRef] [Google Scholar]
- Mondal, S., & French, K. D. 2025, ApJ, 994, 166 [Google Scholar]
- Nenkova, M., Sirocky, M. M., Nikutta, R., Ivezić, Ž., & Elitzur, M. 2008, ApJ, 685, 160 [Google Scholar]
- Newsome, M., Arcavi, I., Howell, D. A., et al. 2024, ApJ, 977, 258 [Google Scholar]
- Nicholl, M., Blanchard, P. K., Berger, E., et al. 2019, MNRAS, 488, 1878 [NASA ADS] [CrossRef] [Google Scholar]
- Nicholl, M., Wevers, T., Oates, S. R., et al. 2020, MNRAS, 499, 482 [NASA ADS] [CrossRef] [Google Scholar]
- Nikutta, R., Fitzpatrick, M., Scott, A., & Weaver, B. A. 2020, Astron. Comput., 33, 100411 [Google Scholar]
- Oke, J. B., Cohen, J. G., Carr, M., et al. 1995, PASP, 107, 375 [Google Scholar]
- Onori, F., Cannizzaro, G., Jonker, P. G., et al. 2022, MNRAS, 517, 76 [NASA ADS] [CrossRef] [Google Scholar]
- Panagiotou, C., De, K., Masterson, M., et al. 2023, ApJ, 948, L5 [CrossRef] [Google Scholar]
- Phinney, E. S. 1989, IAU Symp., 136, 543 [Google Scholar]
- Popesso, P., Concas, A., Cresci, G., et al. 2023, MNRAS, 519, 1526 [Google Scholar]
- Predehl, P., Andritschke, R., Arefiev, V., et al. 2021, A&A, 647, A1 [EDP Sciences] [Google Scholar]
- Price, D. J., Liptai, D., Mandel, I., et al. 2024, ApJ, 971, L46 [NASA ADS] [CrossRef] [Google Scholar]
- Pulatova, N. G., Rubtsov, E., Chilingarian, I. V., et al. 2025, Optical Emission-Line Properties of eROSITA-selected SDSS-V Galaxies [Google Scholar]
- Rees, M. J. 1988, Nature, 333, 523 [Google Scholar]
- Roth, N., & Kasen, D. 2018, ApJ, 855, 54 [Google Scholar]
- Roth, N., Kasen, D., Guillochon, J., & Ramirez-Ruiz, E. 2016, ApJ, 827, 3 [Google Scholar]
- Roth, N., Rossi, E. M., Krolik, J., et al. 2020, Space Sci. Rev., 216, 114 [Google Scholar]
- Ryu, T., Krolik, J., Piran, T., Noble, S. C., & Avara, M. 2023, ApJ, 957, 12 [Google Scholar]
- Saxton, R., Komossa, S., Auchettl, K., & Jonker, P. G. 2020, Space Sci. Rev., 216, 85 [NASA ADS] [CrossRef] [Google Scholar]
- Sazonov, S., Gilfanov, M., Medvedev, P., et al. 2021, MNRAS, 508, 3820 [NASA ADS] [CrossRef] [Google Scholar]
- Schawinski, K., Urry, C. M., Simmons, B. D., et al. 2014, MNRAS, 440, 889 [Google Scholar]
- Schlegel, D. J., Finkbeiner, D. P., & Davis, M. 1998, ApJ, 500, 525 [Google Scholar]
- Shingles, L., Smith, K. W., Young, D. R., et al. 2021, Trans. Name Server AstroNote, 7, 1 [Google Scholar]
- Short, P., Nicholl, M., Lawrence, A., et al. 2020, MNRAS, 498, 4119 [NASA ADS] [CrossRef] [Google Scholar]
- Short, P., Lawrence, A., Nicholl, M., et al. 2023, MNRAS, 525, 1568 [NASA ADS] [CrossRef] [Google Scholar]
- Singh, R., van de Ven, G., Jahnke, K., et al. 2013, A&A, 558, A43 [NASA ADS] [CrossRef] [EDP Sciences] [Google Scholar]
- Skrutskie, M. F., Cutri, R. M., Stiening, R., et al. 2006, AJ, 131, 1163 [NASA ADS] [CrossRef] [Google Scholar]
- Smith, K. W., Smartt, S. J., Young, D. R., et al. 2020, PASP, 132, 085002 [Google Scholar]
- Somalwar, J. J., Ravi, V., & Lu, W. 2025, ApJ, 983, 159 [Google Scholar]
- Speagle, J. S. 2020, MNRAS, 493, 3132 [Google Scholar]
- Steinberg, E., & Stone, N. C. 2024, Nature, 625, 463 [NASA ADS] [CrossRef] [Google Scholar]
- Stern, J., & Laor, A. 2012, MNRAS, 426, 2703 [NASA ADS] [CrossRef] [Google Scholar]
- Stern, D., Assef, R. J., Benford, D. J., et al. 2012, ApJ, 753, 30 [Google Scholar]
- Stone, N. C., Vasiliev, E., Kesden, M., et al. 2020, Space Sci. Rev., 216, 35 [NASA ADS] [CrossRef] [Google Scholar]
- Stoughton, C., Lupton, R. H., Bernardi, M., et al. 2002, AJ, 123, 485 [Google Scholar]
- Sunyaev, R., Arefiev, V., Babyshkin, V., et al. 2021, A&A, 656, A132 [NASA ADS] [CrossRef] [EDP Sciences] [Google Scholar]
- Sutherland, W., & Saunders, W. 1992, MNRAS, 259, 413 [Google Scholar]
- Tonry, J. L., Denneau, L., Heinze, A. N., et al. 2018, PASP, 130, 064505 [Google Scholar]
- Tremonti, C. A., Heckman, T. M., Kauffmann, G., et al. 2004, ApJ, 613, 898 [Google Scholar]
- Ueda, Y., Hashimoto, Y., Ichikawa, K., et al. 2015, ApJ, 815, 1 [NASA ADS] [CrossRef] [Google Scholar]
- van Velzen, S., Gezari, S., Hammerstein, E., et al. 2021, ApJ, 908, 4 [NASA ADS] [CrossRef] [Google Scholar]
- Vazdekis, A., Koleva, M., Ricciardelli, E., Röck, B., & Falcón-Barroso, J. 2016, MNRAS, 463, 3409 [Google Scholar]
- Villar, V. A., Hosseinzadeh, G., Berger, E., et al. 2020, ApJ, 905, 94 [NASA ADS] [CrossRef] [Google Scholar]
- Wang, T.-G., Zhou, H.-Y., Wang, L.-F., Lu, H.-L., & Xu, D. 2011, ApJ, 740, 85 [Google Scholar]
- Wang, T.-G., Zhou, H.-Y., Komossa, S., et al. 2012, ApJ, 749, 115 [Google Scholar]
- Wevers, T. 2020, MNRAS, 497, L1 [NASA ADS] [CrossRef] [Google Scholar]
- Wevers, T., Nicholl, M., Guolo, M., et al. 2022, A&A, 666, A6 [NASA ADS] [CrossRef] [EDP Sciences] [Google Scholar]
- Wevers, T., Guolo, M., Pasham, D. R., et al. 2024, ApJ, 963, 75 [NASA ADS] [CrossRef] [Google Scholar]
- Wright, E. L., Eisenhardt, P. R. M., Mainzer, A. K., et al. 2010, AJ, 140, 1868 [Google Scholar]
- Yao, Y. 2023, Ph.D. Thesis, California Institute of Technology, Division of Physics, Mathematics and Astronomy [Google Scholar]
- Yao, Y., Miller, A. A., Kulkarni, S. R., et al. 2019, ApJ, 886, 152 [NASA ADS] [CrossRef] [Google Scholar]
- Yao, Y., Lu, W., Guolo, M., et al. 2022, ApJ, 937, 8 [NASA ADS] [CrossRef] [Google Scholar]
- Yao, Y., Ravi, V., Gezari, S., et al. 2023, ApJ, 955, L6 [NASA ADS] [CrossRef] [Google Scholar]
- Yao, Y., Lu, W., Harrison, F., et al. 2024, ApJ, 965, 39 [Google Scholar]
We later removed BLAGN with weaker broad lines in Sect. 4.3.3.
Visual inspection was utilized because forced photometry flux uncertainties are often underestimated and transients can be present in reference images, making threshold-based automated detection susceptible to high false positive rates. All light curves were independently reviewed by two co-authors (Y.Y. and J.S.) to ensure consistency.
Note that in our previous work (Sazonov et al. 2021), we considered only the median forced photometry flux uncertainty. However, forced photometry uncertainties can be underestimated; the standard deviation provides a more conservative estimate.
For sources with multiple spectra, we used the spectrum obtained closest to the X-ray peak to compute Hα line luminosities.
While multiple (3–4) Gaussians do not constitute a physical model, this approach provides a simple mathematical framework for characterizing features with complex morphologies.
We cannot completely rule out line blending from Bowen fluorescence features, but since Bowen emission is more commonly observed in the TDE-H+He subtype rather than the TDE-He subtype (Gezari 2021) and given the deep Hα line luminosity upper limit, we consider this scenario less likely.
Among the host galaxies of our gold and silver TDEs, this is the only source with flagged unreliable PS and WISE photometry in our adopted SED fit. A spectrum-only fit for this source does not physically converge. Therefore, we speculate that the extreme SFR is likely driven by the unreliable photometric data, although intrinsically high star formation cannot be fully excluded.
Appendix A: Supplementary tables
Table A.1 shows the properties of the 70 eROSITA TDE candidates with reliable host galaxy associations, including X-ray and optical positions, localization uncertainties, and peak X-ray measurements. Table A.2 summarizes the log of our Keck-I/LRIS spectroscopic observations. Tables A.3 and A.4 summarize the classification results for the gold and silver TDE samples, respectively. Table A.5 shows the properties of broad TDE emission lines detected in our Keck-I/LRIS spectra.
eROSITA TDE candidates with a unique, reliable host galaxy association.
Keck-I/LRIS spectroscopic observation log.
Gold TDE sample.
Silver TDE sample.
Properties of emission lines in TDE spectra modeled with Gaussian profiles.
Appendix B: Supplementary figures
Figures B.1 and B.0 show the LS9 and PS1 color images of the host galaxies of the 70 TDE candidates. Figures B.1–B.2 show the Galactic extinction corrected forced photometry light curves of the host galaxy nuclei of the 70 TDE candidates. Note that two optical spectra obtained in June 2025 (IDs 55 and 58) are beyond the time range of the x-axis. For ID 47, since the optical flare was detected during ZTF reference image building, we perform baseline correction following Yao et al. (2019). Figures B.3 and B.3 show the Prospector SED fitting results of the host galaxies of our gold and silver samples.
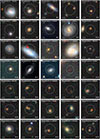 |
Fig. B.1. Legacy Survey DR9 co-added and PS1 color cutouts (100 × 100 pixels) of the host-galaxy associations of the initial 70 TDE candidates. The eROSITA 98% confidence position is shown as a white circle, and the optical counterpart is marked with an open red cross. |
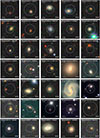 |
Fig. B.1. Continued. |
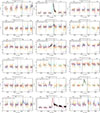 |
Fig. B.2. Differential photometry of ZTF and ATLAS performed at the centroids of the host galaxies of the initial 70 TDE candidates. Data points with < 3σ significance are shown as hollow circles, > 3σ as solid circles, and > 5σ are further highlighted with black edges. Spectroscopic observation epochs are marked with vertical dashed green lines. Epochs of X-ray peak are marked with vertical solid gray lines. For TDE candidates with detected optical flares, we show Gaussian process model fits following the procedures described in Sect. 4.3.1. |
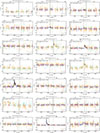 |
Fig. B.2. Continued. |
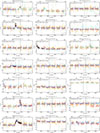 |
Fig. B.2. Continued. |
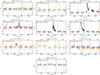 |
Fig. B.2. Continued. |
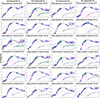 |
Fig. B.3. Prospector SED fitting results for our gold and silver sample, and we show the gold sample first. Observed photometry (green circles), upper limits (light blue triangles), and model spectra (purple lines with gray 1σ uncertainty bands) are shown. The inset zooms into the rest-frame 3000-7500Å region (lower axis: observed frame; upper axis: rest frame). SRGe J163831.9+534018 (ID 50) uses photometry-only fitting due to spectroscopic convergence failure. |
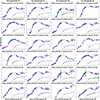 |
Fig. B.3. Continued. |
All Tables
All Figures
|
Fig. 1. Keck-I/LRIS optical spectrum of SRGe J004123.2−153705 (ID 2), a CrL-TDE. |
| In the text | |
|
Fig. 2. Top: Peak 0.3–2.3 keV X-ray luminosity versus broad Hα luminosity for 19 of the initial 70 TDE candidates with a broad Hα component identified in Sect. 4.2. The solid line shows the best-fit relation from the corrected calibration of Pulatova et al. (2025), and the shaded region indicates the intrinsic scatter of the correlation. Note that the Hα luminosity of SRGe J234034.7+293400 (ID 69) is derived from the DESI spectrum (see Sect. 3.2), while the others are all from Keck LRIS spectra. Bottom: Peak X-ray luminosity (LX, peak) versus [O III] λ5007 luminosity for 56 non-BLAGN TDE candidates. The shaded region shows the AGN locus (Ueda et al. 2015) calibrated in the eROSITA 0.3–2.3 keV band (Khorunzhev et al. 2022), with the solid line indicating the median relation log(L[O III]/LX) = − 1.99 ± 0.63. Left-pointing triangles denote sources with upper limits on the [O III] line luminosity. |
| In the text | |
|
Fig. 3. Baldwin, Phillips, and Terlevich diagrams of the 56 non-BLAGN TDE candidates. Among them, only sources with S/N ≥ 5 in all required narrow emission lines are shown. The solid curves mark the theoretical maximum starburst demarcations of Kewley et al. (2006), and the dashed curve in the left panel shows the empirical boundary between star-forming and composite galaxies from Kauffmann et al. (2003a). |
| In the text | |
|
Fig. 4. WHAN diagram of the 56 non-BLAGN TDE candidates. Among them, only sources with S/N ≥ 5 in all required narrow emission lines are shown. The horizontal lines at EW(Hα) = 6 Å and 3 Å indicate the sAGN/wAGN and wAGN/retired divisions, respectively, following Cid Fernandes et al. (2011). |
| In the text | |
|
Fig. 5. Spectral modeling of six objects with broad lines associated with the TDE rather than AGN activity. The observed LRIS data are shown in black. The orange line shows the Prospector-derived host model, and the red line shows the final continuum (polynomial fit plus scaled host model). The continuum-subtracted residuals are shown in teal. The individual Gaussian fits are shown as dashed curves, with vertical dotted colored lines marking their rest-frame wavelengths: purple is for the Bowen blend, red is for He IIλ4686, orange is for Hβ, and blue is for the broad component of Hαλ6563. The solid black and blue curves show the total models in the He II and Hα regions, respectively. Gray bands indicate masked telluric regions. |
| In the text | |
|
Fig. 6. Peak rest-frame g-band luminosity versus peak X-ray luminosity for the 41 TDEs in our gold sample. |
| In the text | |
|
Fig. 7. Time difference between the peak X-ray and peak optical emission for 23 TDEs in the gold sample with detected optical flares. The distribution is shown as a histogram, with individual measurements marked along the x-axis. Our sample demonstrates that a delayed X-ray peak is common among X-ray-selected TDEs. |
| In the text | |
|
Fig. 8. Broad emission line luminosity evolution for six TDEs in our gold sample with significant broad lines detected in our Keck spectra (see Sect. 4.3.5). Circles and diamonds represent the fit luminosity of the He IIλ4686 (broad or shifted components) and Hα (broad plus shifted components) transient lines, respectively. Downward triangles indicate 3σ upper limits. |
| In the text | |
|
Fig. 9. Color–mass diagram for the final 52 TDE host sample (41 gold and 11 silver). The light-green band indicates the green valley region defined by Schawinski et al. (2014). The darker green band shows our empirically derived green valley definition based on our SDSS comparison sample. Background contours are derived from our SDSS comparison galaxies (Sect. 4.4), shown at the 6.7–93.3% density levels. |
| In the text | |
|
Fig. 10. Lick HδA absorption index versus Hα emission EW for our final 52 TDE host sample. The background shows the SDSS comparison sample with contours at σ-equivalent probability levels (6.7–93.3%). The solid and dashed boxes mark the E+A and QBS regions, respectively. To avoid label overlap, our gold and silver hosts near the origin are not individually labeled since many are clustered there. |
| In the text | |
|
Fig. 11. Star formation rate averaged over the past 100 Myr (SFR100) versus stellar mass for our final 52 TDE hosts split into two redshift bins (0.0 ≤ z < 0.2 and 0.2 ≤ z < 0.8). The pink background shows the volume-limited SDSS comparison sample described with SFR measurement. The solid black line marks the redshift-dependent star-forming main sequence from Popesso et al. (2023). |
| In the text | |
|
Fig. B.1. Legacy Survey DR9 co-added and PS1 color cutouts (100 × 100 pixels) of the host-galaxy associations of the initial 70 TDE candidates. The eROSITA 98% confidence position is shown as a white circle, and the optical counterpart is marked with an open red cross. |
| In the text | |
|
Fig. B.1. Continued. |
| In the text | |
|
Fig. B.2. Differential photometry of ZTF and ATLAS performed at the centroids of the host galaxies of the initial 70 TDE candidates. Data points with < 3σ significance are shown as hollow circles, > 3σ as solid circles, and > 5σ are further highlighted with black edges. Spectroscopic observation epochs are marked with vertical dashed green lines. Epochs of X-ray peak are marked with vertical solid gray lines. For TDE candidates with detected optical flares, we show Gaussian process model fits following the procedures described in Sect. 4.3.1. |
| In the text | |
|
Fig. B.2. Continued. |
| In the text | |
|
Fig. B.2. Continued. |
| In the text | |
|
Fig. B.2. Continued. |
| In the text | |
|
Fig. B.3. Prospector SED fitting results for our gold and silver sample, and we show the gold sample first. Observed photometry (green circles), upper limits (light blue triangles), and model spectra (purple lines with gray 1σ uncertainty bands) are shown. The inset zooms into the rest-frame 3000-7500Å region (lower axis: observed frame; upper axis: rest frame). SRGe J163831.9+534018 (ID 50) uses photometry-only fitting due to spectroscopic convergence failure. |
| In the text | |
|
Fig. B.3. Continued. |
| In the text | |
Current usage metrics show cumulative count of Article Views (full-text article views including HTML views, PDF and ePub downloads, according to the available data) and Abstracts Views on Vision4Press platform.
Data correspond to usage on the plateform after 2015. The current usage metrics is available 48-96 hours after online publication and is updated daily on week days.
Initial download of the metrics may take a while.