Fig. 5.
Download original image
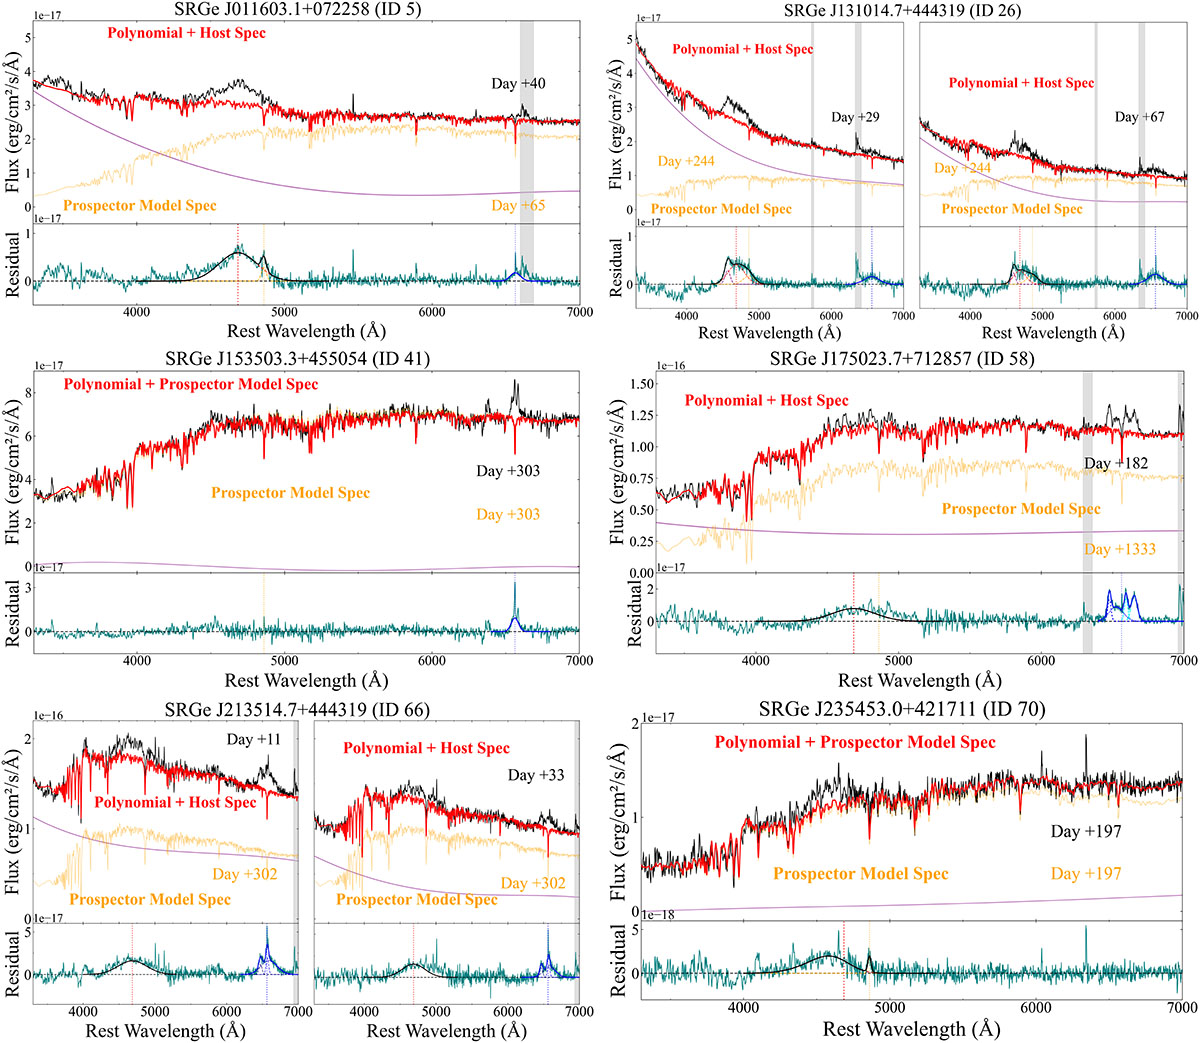
Spectral modeling of six objects with broad lines associated with the TDE rather than AGN activity. The observed LRIS data are shown in black. The orange line shows the Prospector-derived host model, and the red line shows the final continuum (polynomial fit plus scaled host model). The continuum-subtracted residuals are shown in teal. The individual Gaussian fits are shown as dashed curves, with vertical dotted colored lines marking their rest-frame wavelengths: purple is for the Bowen blend, red is for He IIλ4686, orange is for Hβ, and blue is for the broad component of Hαλ6563. The solid black and blue curves show the total models in the He II and Hα regions, respectively. Gray bands indicate masked telluric regions.
Current usage metrics show cumulative count of Article Views (full-text article views including HTML views, PDF and ePub downloads, according to the available data) and Abstracts Views on Vision4Press platform.
Data correspond to usage on the plateform after 2015. The current usage metrics is available 48-96 hours after online publication and is updated daily on week days.
Initial download of the metrics may take a while.