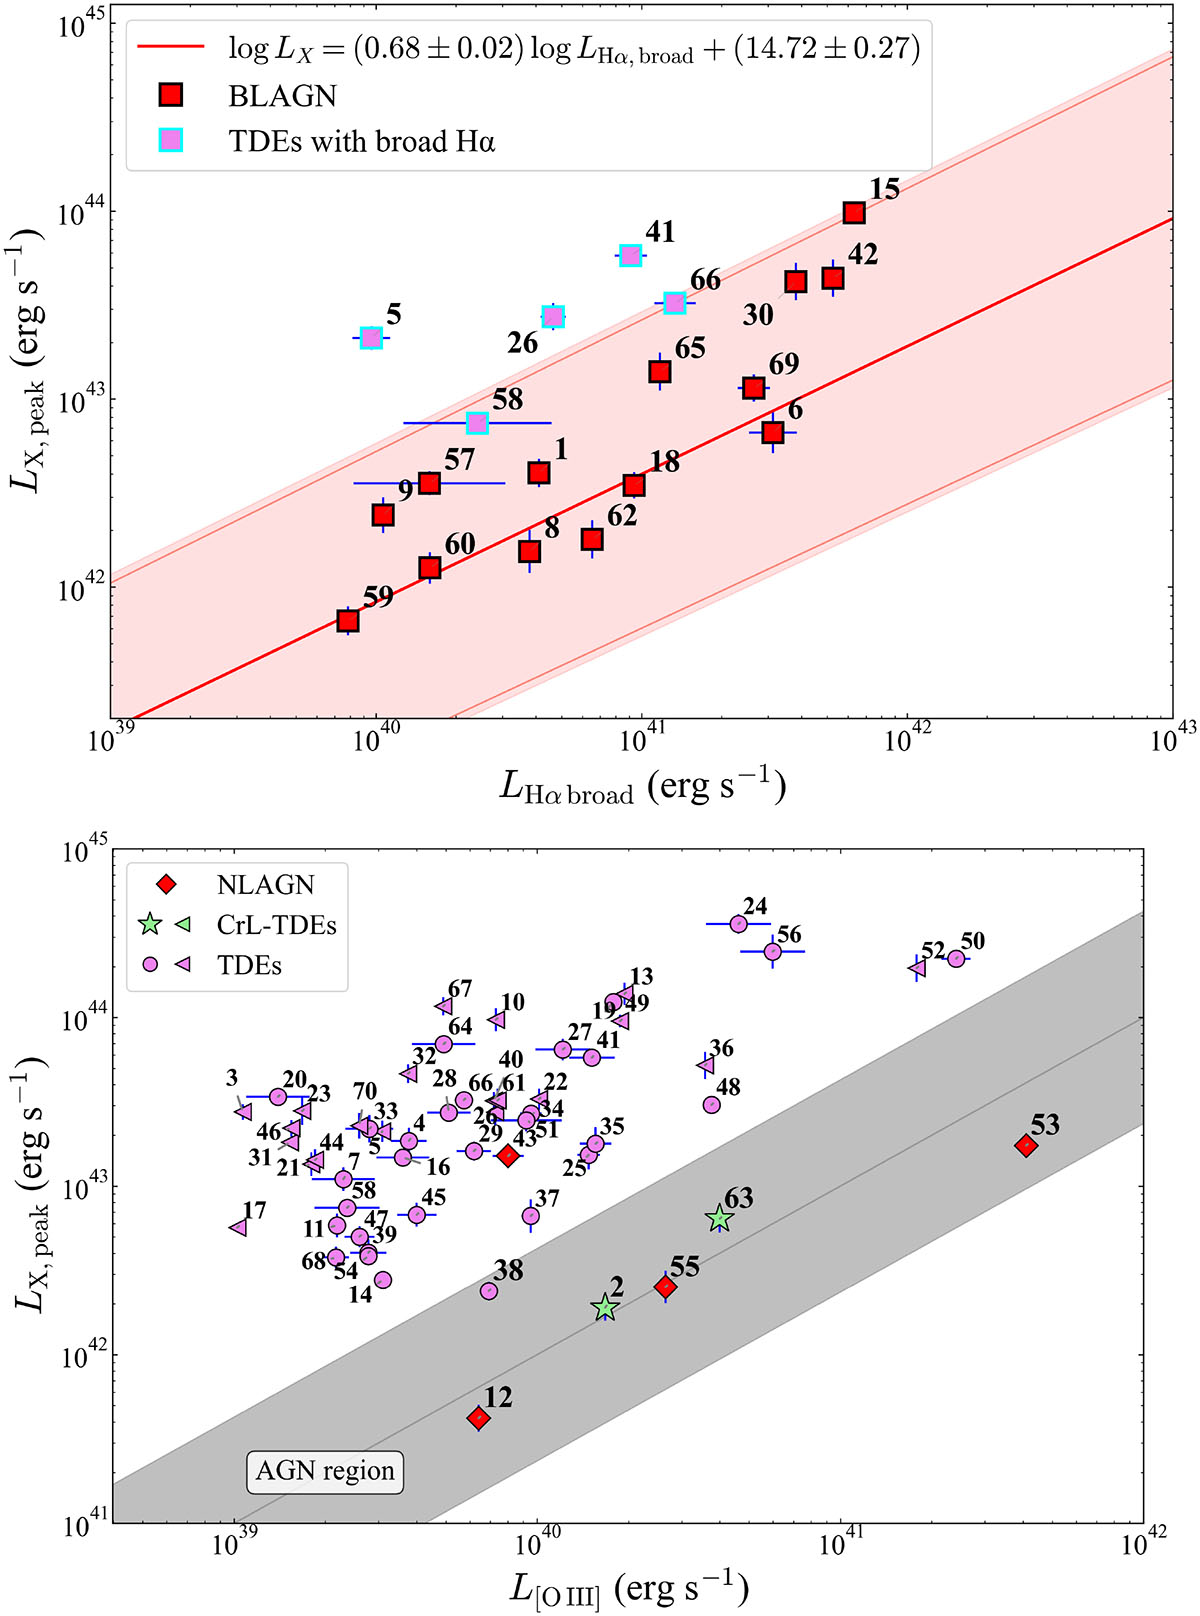
Fig. 2.
Download original image
Top: Peak 0.3–2.3 keV X-ray luminosity versus broad Hα luminosity for 19 of the initial 70 TDE candidates with a broad Hα component identified in Sect. 4.2. The solid line shows the best-fit relation from the corrected calibration of Pulatova et al. (2025), and the shaded region indicates the intrinsic scatter of the correlation. Note that the Hα luminosity of SRGe J234034.7+293400 (ID 69) is derived from the DESI spectrum (see Sect. 3.2), while the others are all from Keck LRIS spectra. Bottom: Peak X-ray luminosity (LX, peak) versus [O III] λ5007 luminosity for 56 non-BLAGN TDE candidates. The shaded region shows the AGN locus (Ueda et al. 2015) calibrated in the eROSITA 0.3–2.3 keV band (Khorunzhev et al. 2022), with the solid line indicating the median relation log(L[O III]/LX) = − 1.99 ± 0.63. Left-pointing triangles denote sources with upper limits on the [O III] line luminosity.
Current usage metrics show cumulative count of Article Views (full-text article views including HTML views, PDF and ePub downloads, according to the available data) and Abstracts Views on Vision4Press platform.
Data correspond to usage on the plateform after 2015. The current usage metrics is available 48-96 hours after online publication and is updated daily on week days.
Initial download of the metrics may take a while.