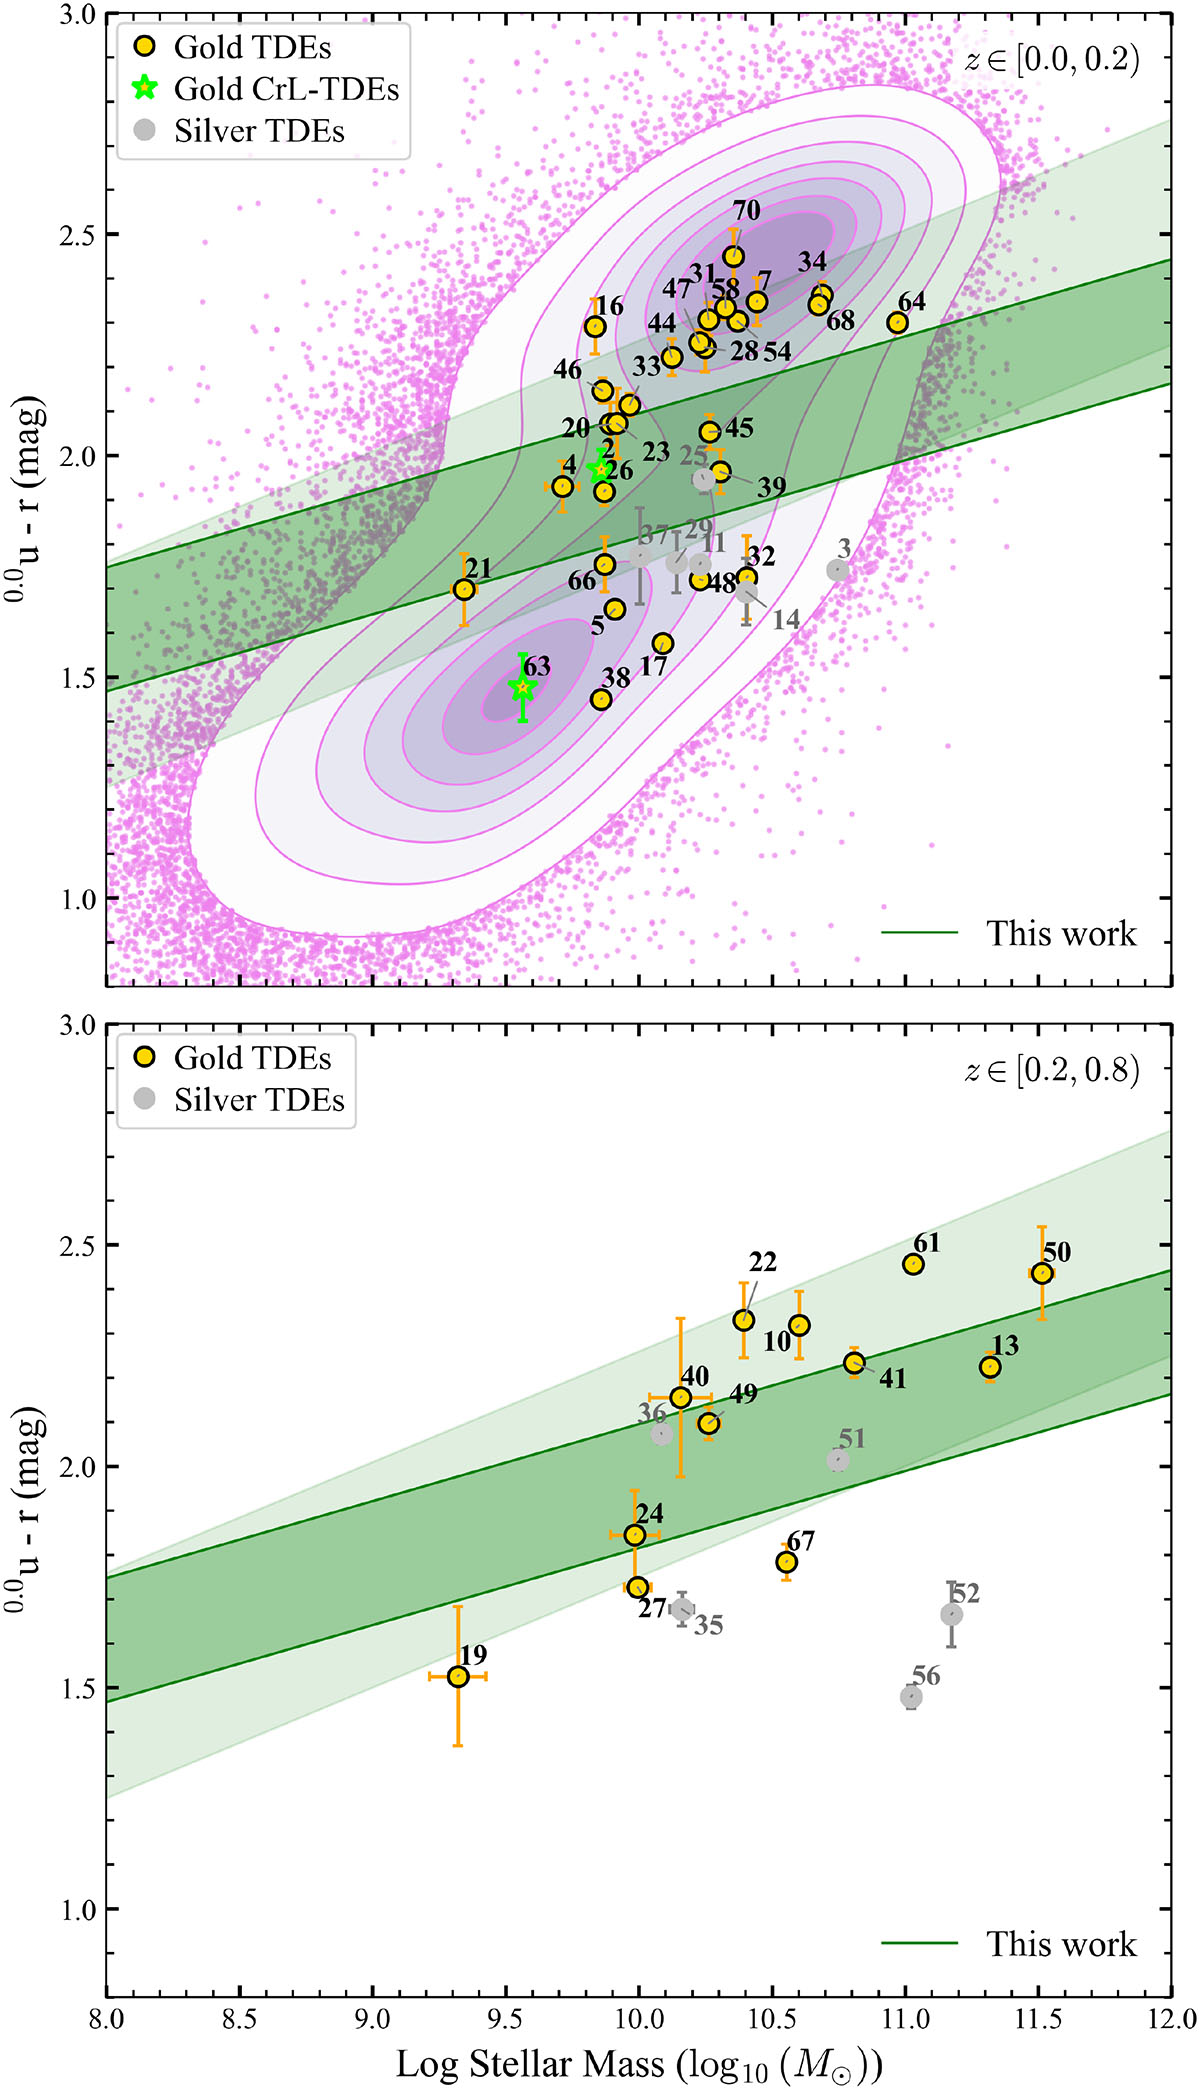
Fig. 9.
Download original image
Color–mass diagram for the final 52 TDE host sample (41 gold and 11 silver). The light-green band indicates the green valley region defined by Schawinski et al. (2014). The darker green band shows our empirically derived green valley definition based on our SDSS comparison sample. Background contours are derived from our SDSS comparison galaxies (Sect. 4.4), shown at the 6.7–93.3% density levels.
Current usage metrics show cumulative count of Article Views (full-text article views including HTML views, PDF and ePub downloads, according to the available data) and Abstracts Views on Vision4Press platform.
Data correspond to usage on the plateform after 2015. The current usage metrics is available 48-96 hours after online publication and is updated daily on week days.
Initial download of the metrics may take a while.