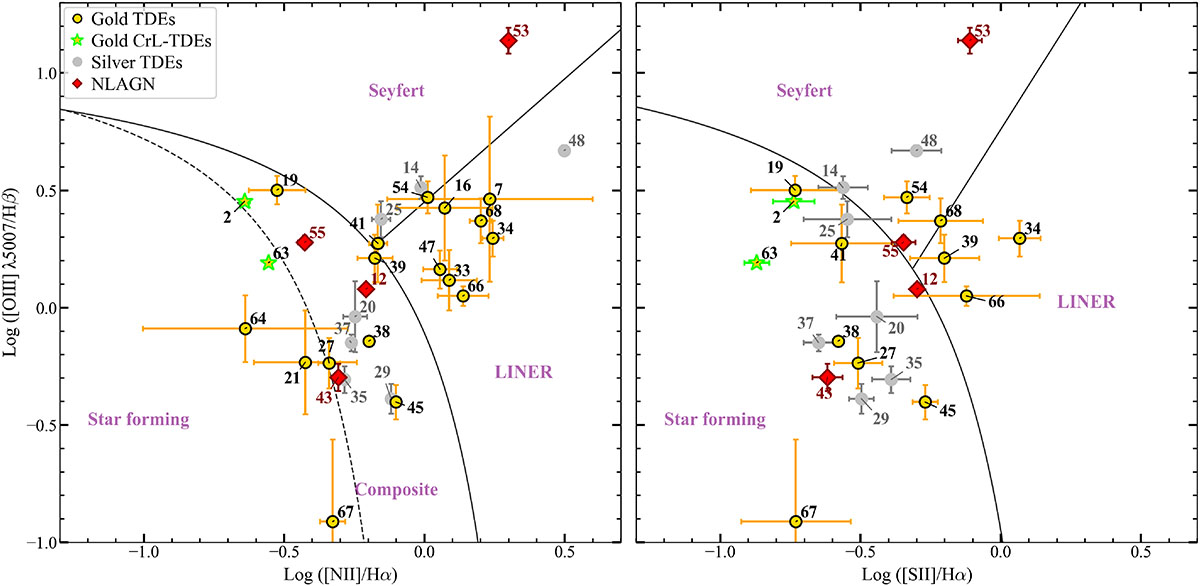
Fig. 3.
Download original image
Baldwin, Phillips, and Terlevich diagrams of the 56 non-BLAGN TDE candidates. Among them, only sources with S/N ≥ 5 in all required narrow emission lines are shown. The solid curves mark the theoretical maximum starburst demarcations of Kewley et al. (2006), and the dashed curve in the left panel shows the empirical boundary between star-forming and composite galaxies from Kauffmann et al. (2003a).
Current usage metrics show cumulative count of Article Views (full-text article views including HTML views, PDF and ePub downloads, according to the available data) and Abstracts Views on Vision4Press platform.
Data correspond to usage on the plateform after 2015. The current usage metrics is available 48-96 hours after online publication and is updated daily on week days.
Initial download of the metrics may take a while.