Fig. 10.
Download original image
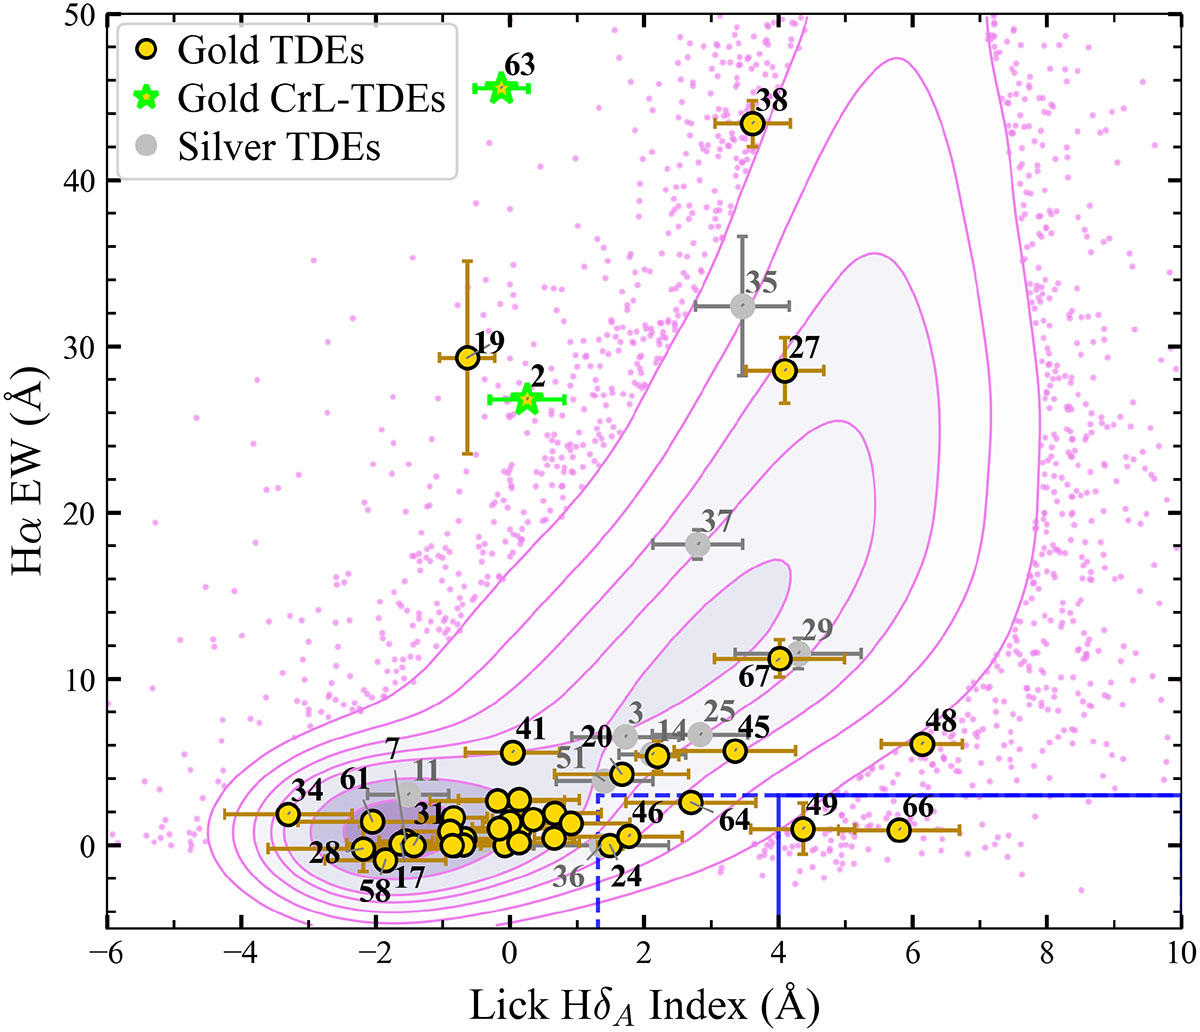
Lick HδA absorption index versus Hα emission EW for our final 52 TDE host sample. The background shows the SDSS comparison sample with contours at σ-equivalent probability levels (6.7–93.3%). The solid and dashed boxes mark the E+A and QBS regions, respectively. To avoid label overlap, our gold and silver hosts near the origin are not individually labeled since many are clustered there.
Current usage metrics show cumulative count of Article Views (full-text article views including HTML views, PDF and ePub downloads, according to the available data) and Abstracts Views on Vision4Press platform.
Data correspond to usage on the plateform after 2015. The current usage metrics is available 48-96 hours after online publication and is updated daily on week days.
Initial download of the metrics may take a while.