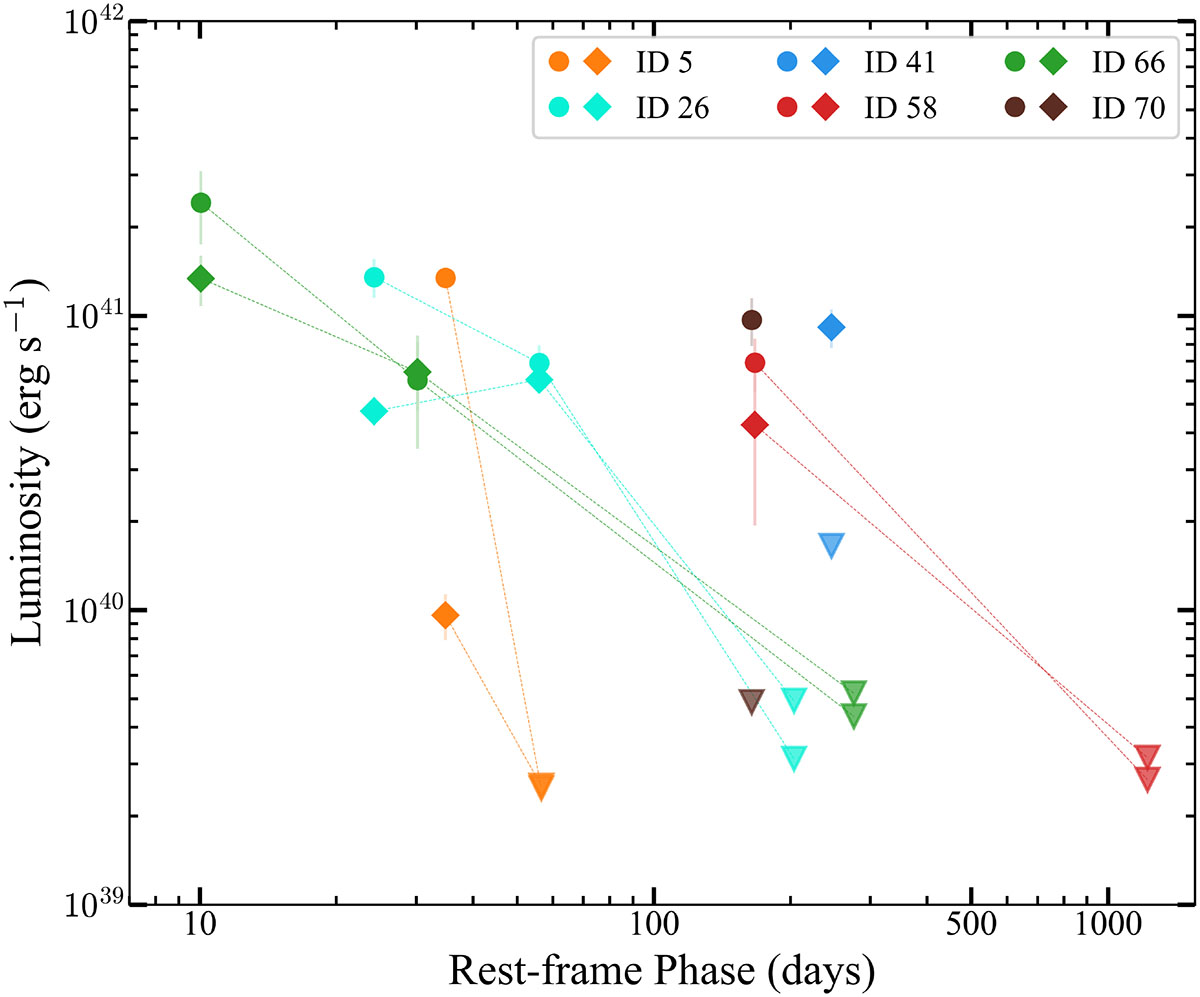
Fig. 8.
Download original image
Broad emission line luminosity evolution for six TDEs in our gold sample with significant broad lines detected in our Keck spectra (see Sect. 4.3.5). Circles and diamonds represent the fit luminosity of the He IIλ4686 (broad or shifted components) and Hα (broad plus shifted components) transient lines, respectively. Downward triangles indicate 3σ upper limits.
Current usage metrics show cumulative count of Article Views (full-text article views including HTML views, PDF and ePub downloads, according to the available data) and Abstracts Views on Vision4Press platform.
Data correspond to usage on the plateform after 2015. The current usage metrics is available 48-96 hours after online publication and is updated daily on week days.
Initial download of the metrics may take a while.