Fig. B.2.
Download original image
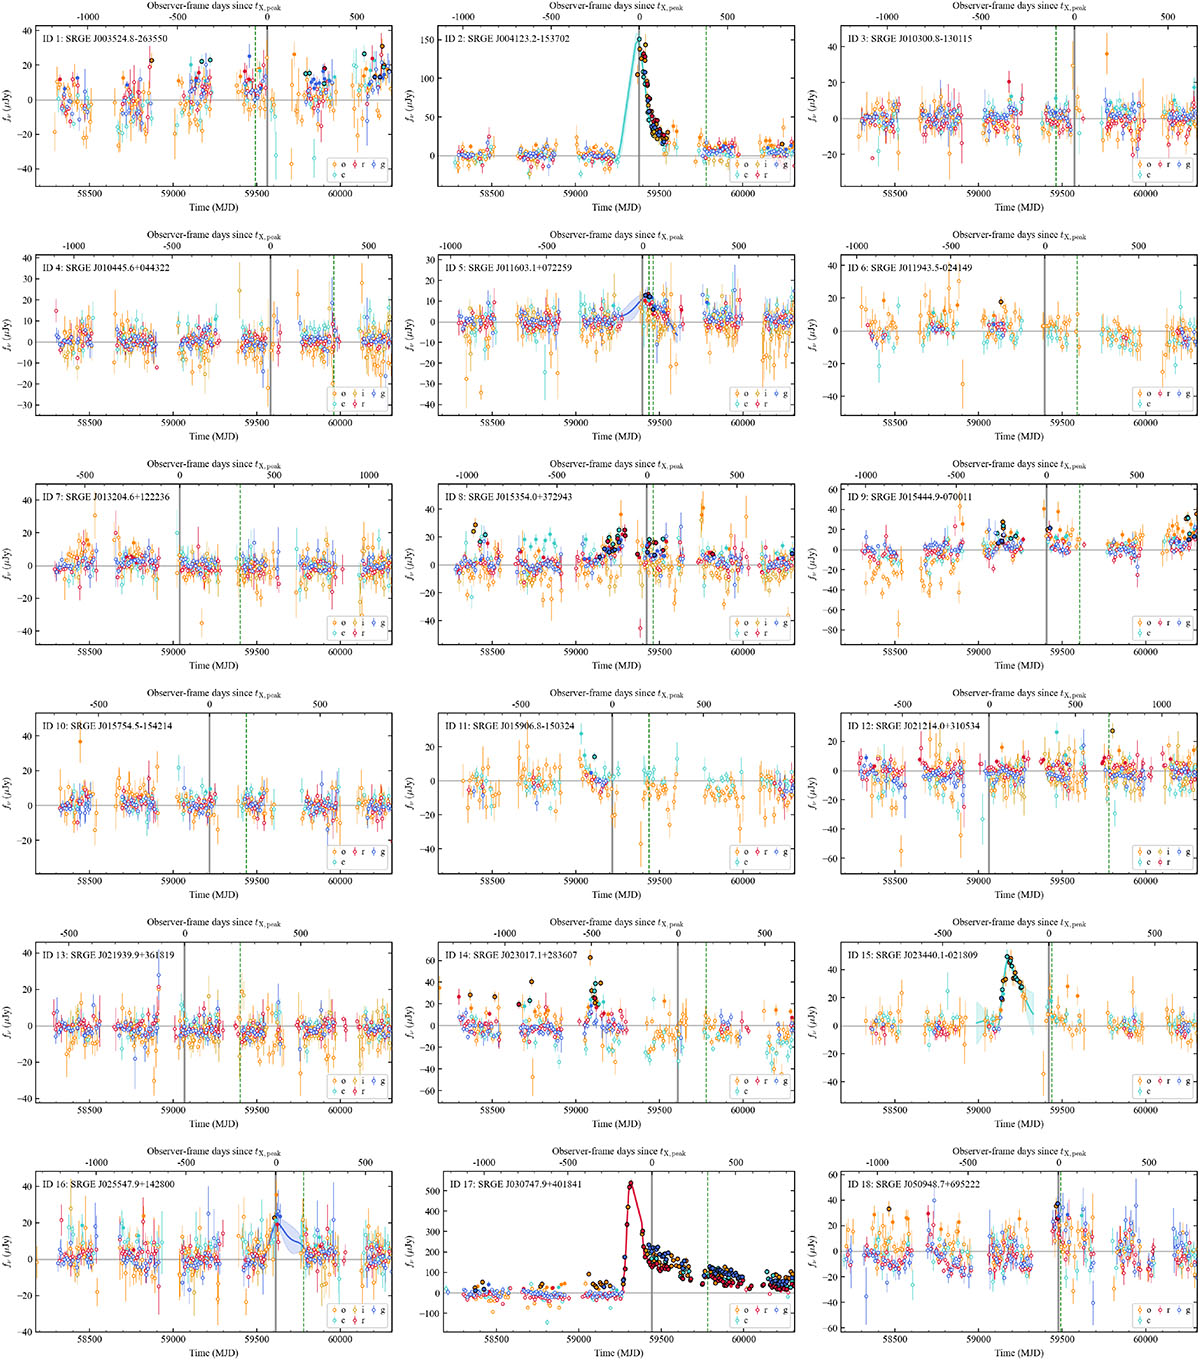
Differential photometry of ZTF and ATLAS performed at the centroids of the host galaxies of the initial 70 TDE candidates. Data points with < 3σ significance are shown as hollow circles, > 3σ as solid circles, and > 5σ are further highlighted with black edges. Spectroscopic observation epochs are marked with vertical dashed green lines. Epochs of X-ray peak are marked with vertical solid gray lines. For TDE candidates with detected optical flares, we show Gaussian process model fits following the procedures described in Sect. 4.3.1.
Current usage metrics show cumulative count of Article Views (full-text article views including HTML views, PDF and ePub downloads, according to the available data) and Abstracts Views on Vision4Press platform.
Data correspond to usage on the plateform after 2015. The current usage metrics is available 48-96 hours after online publication and is updated daily on week days.
Initial download of the metrics may take a while.