Open Access
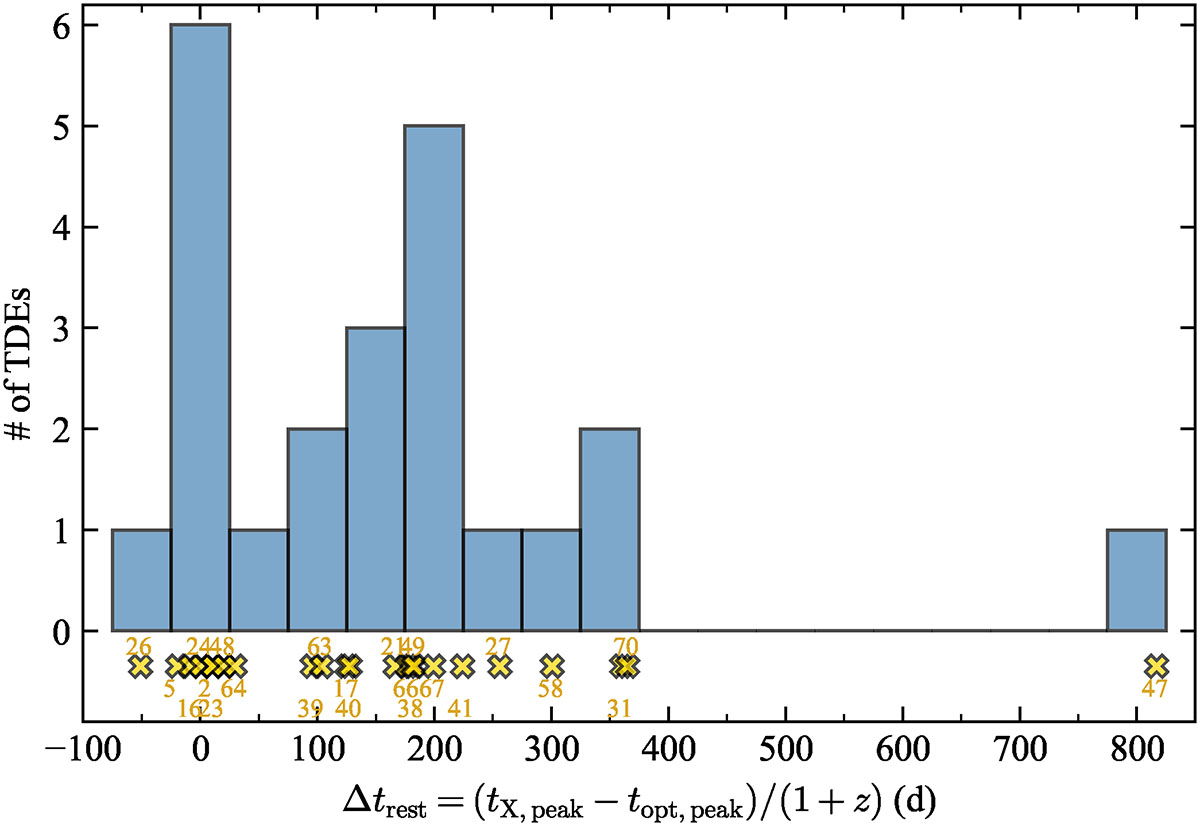
Fig. 7.
Download original image
Time difference between the peak X-ray and peak optical emission for 23 TDEs in the gold sample with detected optical flares. The distribution is shown as a histogram, with individual measurements marked along the x-axis. Our sample demonstrates that a delayed X-ray peak is common among X-ray-selected TDEs.
Current usage metrics show cumulative count of Article Views (full-text article views including HTML views, PDF and ePub downloads, according to the available data) and Abstracts Views on Vision4Press platform.
Data correspond to usage on the plateform after 2015. The current usage metrics is available 48-96 hours after online publication and is updated daily on week days.
Initial download of the metrics may take a while.