| Issue |
A&A
Volume 699, July 2025
|
|
|---|---|---|
| Article Number | A210 | |
| Number of page(s) | 17 | |
| Section | Stellar structure and evolution | |
| DOI | https://doi.org/10.1051/0004-6361/202555143 | |
| Published online | 09 July 2025 | |
Chemical composition of asymptotic giant branch stars in Galactic open clusters: Implications for the initial-final mass relation
1
Dpto. Fí sica Teórica y del Cosmos, Universidad de Granada, E-18071 Granada, Spain
2
Department of Physics and Astronomy G. Galilei, University of Padova, Vicolo dell’Osservatorio 3, I-35122 Padova, Italy
3
INAF–Osservatorio Astronomico d’Abruzzo, Via Maggini snc, I-64100 Teramo, Italy
4
INFN–Sezione di Perugia, Via A. Pascoli snc, I-06126 Perugia, Italy
5
Université de la Côte d’Azur, Observatoire de la Côte d’Azur, CNRS, Laboratoire Lagrange, France
6
INFN–Sezione di Roma, Pz. Aldo Moro 2, I-00185 Roma, Italy
7
Institut de Ciències del Cosmos (ICCUB), Universitat de Barcelona (UB), Martí i Franquès 1, E-08028 Barcelona, Spain
8
Departament de Física Quàntica i Astrofí sica (FQA), Universitat de Barcelona (UB), Martí Franquès 1, E-08028 Barcelona, Spain
9
Institut d’Estudis Espacials de Catalunya (IEEC), Esteve Terradas, 1, Edifici RDIT, Campus PMT-UPC, 08860 Castelldefels, (Barcelona), Spain
⋆ Corresponding authors: This email address is being protected from spambots. You need JavaScript enabled to view it.
, This email address is being protected from spambots. You need JavaScript enabled to view it.
, This email address is being protected from spambots. You need JavaScript enabled to view it.
Received:
12
April
2025
Accepted:
5
June
2025
Abstract
In the framework of the Gaia DR3 survey, we study the chemical composition of asymptotic giant branch (AGB) stars that have a high probability of being members to Galactic open clusters. To our knowledge, this is the first time such a study has been conducted. We analyse 16 AGB candidates, all of which are brighter than the tip of the red giant branch. There are nine of the C-star spectral type, two K stars, three M stars, one MS star, and one S star. Some of these stars belong to open clusters with an age corresponding to an initial mass of Mini≈1.6−2.1 M⊙, where the existence of a possible discontinuity (kink) in the initial-final mass relation (IFMR) has recently been suggested. By combining high-resolution spectroscopy at visual and near-infrared wavelengths, Gaia DR3 astrometry and photometry, and stellar models, we characterise each star in terms of its chemical abundances, luminosity, initial mass, and core mass. We find that the chemical pattern of the stars is similar to those found in AGB stars of the Galactic field with a similar metallicity. Globally, we matched the abundances found in each star at the observed luminosity (within the observational uncertainty) using nucleosynthesis predictions from the FUNS code for initial stellar masses in the range of ∼1.3−5.0 M⊙, with metallicities in agreement with the ones determined spectroscopically. The inferred stellar masses are compatible with the turn-off mass obtained by fitting the Hertzsprung-Russell diagram of the corresponding cluster. Then, we constructed a semi-empirical IFMR from the core masses calculated at the end of the AGB phase. We find the usual monotonic increasing trend without evidence of a non-linearity in the initial mass range where the kink in the IFMR could exist, similar to that recently inferred from the analysis of white dwarf binaries.
Key words: stars: abundances / stars: AGB and post-AGB / stars: carbon / stars: evolution / stars: late-type / white dwarfs
Deceased.
© The Authors 2025
 Open Access article, published by EDP Sciences, under the terms of the Creative Commons Attribution License (https://creativecommons.org/licenses/by/4.0), which permits unrestricted use, distribution, and reproduction in any medium, provided the original work is properly cited.
This article is published in open access under the Subscribe to Open model. This email address is being protected from spambots. You need JavaScript enabled to view it. to support open access publication.
1. Introduction
The final stage of the evolution of low- and intermediate-mass stars (0.8≲M/M⊙≲8), the asymptotic giant branch (AGB) phase, is still poorly understood. This is because of the complexity of modelling the physical processes that effect the composition of these stars; for example, the third dredge-up (TDU). In stars undergoing thermal instabilities of the He-burning shell (thermal pulses or TPs), the surface enrichment of carbon and s-elements is a consequence of periodic TDU episodes, which transport material that has suffered He-burning up to the stellar surface. Then, when the C/O ratio exceeds unity (by number) and an s-element enhancement appears on the surface, they become C stars (see e.g. Busso et al. 1999; Wallerstein & Knapp 1998; Lattanzio 2002; Abia et al. 2003). However, the efficiency of the TDU and the chemical yields from thermally pulsing AGB (TP-AGB) stars are still burdened by large uncertainties, and studies by different authors disagree with each other, mainly due to the lack of a robust theory of convection and mass loss. Another issue is the occurrence of hot bottom burning (HBB) in the deep convective envelope of massive AGBs (M≳4 M⊙). This process occurs during the inter-pulse periods when the convective envelope penetrates the zone where H burning is active. Consequently, carbon, which is carried in the envelope by the TDU, is mostly transformed into nitrogen through the CN cycle, which is active at the bottom of the convective region. Therefore, massive AGB stars are expected to become N-rich rather than C-rich. This mixing and burning process makes massive AGB stars important sites for the nucleosynthesis of various light and intermediate-mass isotopes. Note that when the envelope mass is reduced down to a certain limit, owing to mass loss, the HBB eventually ceases. The TDU and HBB phenomena, and any non-standard mixing process that could occur during the AGB phase, depend on the initial mass, metallicity, and mass loss and are very sensitive to the treatment of convection and mixing and the numerical details and prescribed mass loss used (see e.g. Frost & Lattanzio 1996; Ventura & D’Antona 2005; Cristallo et al. 2009; Busso et al. 2010; Marigo et al. 2013; Karakas & Lattanzio 2014; Straniero et al. 2023).
In this context, observations play a key role, as they can place constraints on the above-mentioned processes. However, comparing the findings from field AGB stars with the ones from nucleosynthesis and stellar evolutionary models is hampered by the rather large uncertainty in luminosity and mass. Fortunately, clusters of stars offer an excellent opportunity to investigate stellar physics in depth. They provide samples of stars that are relatively homogeneous in age and metallicity, at approximately the same distance. Thus, it is possible to determine their evolutionary status and mass more accurately than in field stars. To investigate highly evolved stars on the AGB, globular clusters appear to be the best choice due to the number of potential targets they include and the age range in which they are found. However, globular clusters of the Milky Way are not good candidates when studying the effect of the TDU. They are indeed too old, so their present generation of AGB stars should have a very low envelope mass, too low for the occurrence of a substantial dredge up. However, in the solar-like metallicity regime, these issues are partially overcome in open clusters because, due to their low and intermediate age, they may contain a considerable number of TP-AGB stars in a wide range of masses (see e.g. Girardi et al. 1995). However, to our knowledge, no study has been conducted on the chemical analysis of AGB stars in Galactic open clusters to date. The only available studies refer to a few clusters of young and intermediate age in the Magellanic Clouds (Frogel et al. 1990; Maceroni et al. 2002; Lebzelter et al. 2008; Lederer et al. 2009).
Another piece of valuable observational information comes from the semi-empirical initial-final mass relation (IFMR), which links the initial mass of low- and intermediate-mass stars with the final mass of white dwarfs left behind after their death (see e.g. Weidemann 2000; Kalirai et al. 2008; Catalán et al. 2008; Salaris et al. 2009; Andrews et al. 2015; Cummings et al. 2018; Canton 2018; Cunningham et al. 2024; Hollands et al. 2024). The IFMR is very sensitive to the prescriptions used to model the mass loss, TDU, and HBB of progenitor stars (e.g. Kalirai et al. 2014; Marigo et al. 2020). Thus, observational studies of the IFMR can also constrain these phenomena. Unfortunately, these studies on the Milky Way have been limited by severe uncertainties in the distances of the stars and by the fact that the known AGB population in open clusters is still small.
This situation has improved significantly due to the advent of the Gaia satellite and its data releases, particularly the Gaia DR3 (Gaia Collaboration 2021). In fact, with the addition of new white dwarf data belonging to Galactic open clusters with ages of 1.5−2.5 Gya, Marigo et al. (2020, 2022) found a kink in the IFMR at Mini≈1.6−2.1 M⊙ that may interrupt the commonly assumed linear monotonic behaviour. This mass interval typically corresponds to the mass range at which stars become C-stars during the TP-AGB phase. Surprisingly, the white dwarfs at the peak of the kink, which are all members of the open cluster NGC 7789, may reach masses of 0.70−0.74 M⊙ (Cummings et al. 2018), which are usually associated with stars with Mini≳4 M⊙. Note that the more massive AGB stars with a nearly solar metallicity never attain the C/O > 1 condition, because of the shallower dredge up, the strong dilution of the material dredge up within the convective envelope, and the activation of the HBB (see e.g. Straniero et al. 2023, and references therein).
This kink in the IFMR was interpreted by Marigo et al. (2020, 2022) as a signature of the lowest mass stars in the Milky Way that evolved into C-stars. According to Marigo et al. (2022), Addari et al. (2024), these C-stars are expected to have undergone shallow TDU events that resulted in a low photospheric C/O ratio (very close to unity). This is because the mass loss prescription for carbon stars used by these authors is dependent on carbon excess (the abundance difference between C and O, Mattsson et al. 2010; Eriksson et al. 2014; Bladh et al. 2019a, b), and under this condition, carbonaceous dust grains cannot condense in the outer envelope in sufficient quantities to cause a strong wind. Thus, the lifetime of the AGB is prolonged, and the core mass could grow more than commonly expected.
Thanks to accurate Gaia DR3 astrometry, Marigo et al. (2020, 2022) identified a few TP-AGB stars in NGC 7789 and other open clusters with turn-off masses within or close to the mass interval mentioned above. Apart from a low C/O ratio and mass loss rate, we wondered if these C-stars (AGB stars in general) with masses within (or close) the possible kink in the IFMR could also have other observational signatures that may characterise them, in particular a different chemical composition with respect to that usually observed in Galactic field AGB stars of similar metallicity. In this study, we performed a full chemical analysis of several Galactic AGB stars (both C- and O-rich) belonging to Galactic open clusters with ages within those where the kink in the IFMR could exist, using high-resolution and signal-to-noise spectra in the visual and near-infrared (NIR) wavelengths. In the next section, we describe the sampled stars, the main properties of the open clusters to which the stars belong, and the results of the spectroscopic analysis. Section 3 discusses the main results of the chemical analysis and the derivation of the luminosities of the stars. Finally, we build an IFMR with the Mini−Mfinal pairs of our stars based on observational analysis and theoretical AGB models. Section 4 summarises our main findings.
2. Observations and analysis
2.1. The stellar sample
The stars observed in this study were selected from a sub-sample of the bright NIR stellar populations identified by Marigo et al. (2022) in some Galactic open clusters, taken from the catalogue by Cantat-Gaudin & Anders (2020). This catalogue provides the main parameters and the star membership list for 1481 open clusters based on the second Gaia data release (DR2; Gaia Collaboration 2018). From a sample of bright NIR stars, Marigo et al. (2022) extracted some AGB star candidates according to the following criteria: (1) they must be brighter than the red giant branch (RGB) tip, i.e.  mag; (2) they must be older than ∼100 Mya, corresponding to an upper limit of the initial post-main sequence mass ∼6 M⊙; (3) they are assigned a spectral type to K, M, MS, S, and C, when known. The lower age limit was chosen based on the stellar evolutionary models computed using the PARSEC code (Pastorelli et al. 2020). At solar metallicity, this code predicts a maximum initial mass for the development of a degenerate carbon-oxygen core of ∼6 M⊙, corresponding to a main-sequence lifetime of ∼100 Mya. Stars with initial masses lower than this limit theoretically suffer double shell burning during the AGB phase. Note that the values of mass and age strongly depend on the physical ingredients used to model the stars. For instance, the mass limit at solar metallicity may be significantly higher (∼7.5 M⊙) depending on whether or not overshooting and rotation are included in stellar models (see e.g. Domínguez et al. 1999; Karakas & Lattanzio 2014; Straniero et al. 2019; Limongi et al. 2024). Similar considerations hold for age estimates.
According to the above criteria, Marigo et al. (2022) selected 29 stars from a sample of 50 Galactic open clusters (see Table 2 in Marigo et al. 2022). Within these 29 objects, we observed 16 stars: nine stars of spectral type C, two of K-type, one of M-type, one of S-type, one of MS-type, and two of unknown type according to the SIMBAD database. However, from our high-resolution spectra, we identify these two latter as normal O-rich M-type stars. According to the analysis of Marigo et al. (2022) all these stars are assumed to be in either the early AGB (e-AGB) or the TP-AGB phase. Table 1 shows the log-book of the observations indicating the name of the star, G and Ks magnitudes, spectral type, the open cluster to which they belong, and the membership probability to the corresponding cluster according to the analysis by Marigo et al. (2022) based on Gaia DR3 astrometry, or by Cantat-Gaudin & Anders (2020) based on Gaia DR2 astrometry (DH Mon, C* 908, IRAS 20540+5049, and 2MASS J20560894+5059071), and the Gaia DR3 parallax with its uncertainty. Nine of the stars have good Gaia DR3 astrometric solutions: an uncertainty in the parallax of ≲15%, a fidelity flag of ∼1 (Rybizki et al. 2022), RUWE values <1.4 (i.e. non-binary), and available 2MASS photometry with JHKs magnitude uncertainties ≲0.1 mag. However, seven stars among the sample have a fidelity flag <0.5: Case 121, [D75b] Star30, V493 Mon, Case 473, Case 588, DH Mon, and 2MASS J20560894+5059071, indicating that the DR3 astrometry solution for these stars may be spurious rather than physical. Thus, the uncertainty in the distance (luminosity) derived for these stars may be larger than that for the rest of the sample.
Stars observed, open cluster membership, and instrumental setup.
The observations were made in November 2022 at the 3.5 m telescope in the CAHA observatory using the CARMENES echelle spectrograph, and in August 2023 at the Observatory of the Roque de los Muchachos with the 3.6 m TNG facility using the GIANO-B (echelle) and HARPS-N spectrographs working together in the GIARPS mode. The CARMENES spectrograph provides a high spectral resolution (R = 80 000−100 000) in the 0.52−0.96 μm and 0.96−1.71 μm spectral ranges, respectively; while the TNG observations in GIARPS mode cover the 0.97−2.45 μm (R = 50 000) and 0.38−0.69 μm (R = 115 000) spectral ranges. Both instruments exhibit spectral gaps between the echelle orders in the NIR. Spectra were reduced using the standard pipeline data reduction packages available for each instrument, which include the removal of telluric lines using the programme telluric within the IRAF1 software package. The final signal-to-noise ratio of the spectra ranged from S/N ∼ 50 in the λ4700−5000 Å region (CARMENES observations) to more than 300 at ∼2.3 μm (GIANO-B observations). This is because most stars are very faint at visual wavelengths but very bright in the NIR (see Table 1). The spectra were normalised to a pseudo-continuum by connecting the highest flux points of the spectrum with a polynomial using the task continuum within IRAF. For C-stars, this procedure was relatively easy because the spectral continuum could be traced by eye without difficulty. However, this was not the case for M, MS, and S stars, in particular for stars with near-solar C/O ratio, since in this case the visual spectrum (λ<7000 Å ) is dominated by huge TiO band absorptions, making the placement of the continuum very uncertain. Thus, we attempted to avoid deriving the abundance of any species at these wavelengths in M, MS, and S stars, and used the fits to the TiO bands as an additional check to the C/O ratio estimated from other spectral ranges.
The spectral ranges observed with both instruments allowed us to derive the average metallicity ([M/H]), the C/O, 12C/13C, 14N/15N, and 16O/17O ratios, and the abundances of lithium, fluorine, and some s-process elements (mainly Zr and Ce) from specific spectral lines. For C-stars, these atomic and molecular lines and their detailed spectroscopic data can be found in Abia et al. (2002, 2015, 2017a), Hedrosa et al. (2013), and references therein. To these lines, we added a couple of useful Zr I lines identified in the λ∼8040−8100 Å region and some of the Ce II identified by Cunha et al. (2017) in the 1.52−1.70 μm spectral range (in fact, in the APOGEE – Apache Point Observatory Galactic Evolution Experiment – range). For O-rich stars, we used the atomic line list in Shetye et al. (2018) and Cunha et al. (2017) for the derivation of the average metallicity and s-element abundances. For the C/O ratio, similar lines were used to those in C-stars around λ∼2.3 μm, while for the 12C/13C and 16O/17O ratios the lines used in Guerço et al. (2022) at ∼1.61 μm and ∼2.33 μm spectral ranges, respectively. No lines were available in O-rich stars in the spectral ranges observed to derive the 14N/15N ratio and, unfortunately, our instrumental setup with GIANO-B prevented access to the available CO lines to derive the 16O/18O ratio (see Abia et al. 2017a). In any case, we believe that the spectral ranges observed can fully characterise AGB stars from the chemical point of view, allowing us to infer their evolutionary status and/or explore the possibility that HBB (and/or any extra-mixing mechanism) occurs in the interior.
Note that, as Table 1 shows, not every star was observed with both instruments; as a result, the above chemical features were not always derived from each star. For instance, only in the stars observed by TNG-GIARPS was it possible to derive the oxygen isotopic ratio and the fluorine abundance, whereas the nitrogen isotopic ratio was possible only in some of the stars observed by CARMENES.
2.2. Distance, age, and extinction of host clusters
Table 2 presents the extinction in the V band, distance, and age of the open cluster to which our stars belong, as determined by three recent studies. We selected these three studies because they all use a similar method: an artificial neural network (ANN) code trained on synthetic (and real) clusters to estimate the age, metallicity, extinction, and distance of Galactic open clusters observed by Gaia adopting different approximations (see Cantat-Gaudin & Anders 2020; Hunt & Reffert 2023; Cavallo et al. 2024, and below for details). These ANN codes are based on the isochrone fitting method and all use PARSEC isochrones (Bressan et al. 2012). Cantat-Gaudin & Anders (2020), as mentioned above, is based on Gaia DR2 astrometry, while Hunt & Reffert (2023) and Cavallo et al. (2024) are based on DR3.
Open cluster parameters based on the recent bibliography.
In Figures 1, 2, and 3 we compare the distances and extinctions derived by the studies of Hunt & Reffert (2023) and Cavallo et al. (2024) for the clusters in Table 2 with the values obtained by Bailer-Jones et al. (2021) (see Table 3 below) for the individual stars in the corresponding cluster (Table 1). We discarded the work of Cantat-Gaudin & Anders (2020) for homogeneity because it is based on Gaia DR2 astrometry. Figure 1 shows the distance difference between Hunt & Reffert (2023) and Cavallo et al. (2024) versus the distance determined by the former authors. The average difference is not very large (127±510 pc); however, the high dispersion indicates that there are significant discrepancies for some clusters, particularly those located at distances larger than ∼3 kpc. For these clusters, the largest difference was also found in the AV values. In some way, this is expected, because for distances greater than ∼3.0 kpc (the Gaia sphere), the uncertainty of the Gaia DR3 parallax increases significantly on average (see Fig. 22 in Bailer-Jones et al. 2021). On the other hand, Figures 2 and 3 compare the geometric distances for individual stars derived by Bailer-Jones et al. (2021) with respect to the median distance derived by Hunt & Reffert (2023) and Cavallo et al. (2024) for the corresponding cluster, respectively. In this case, we compared the extinction for individual stars estimated according to the Galactic extinction model by Lallement et al. (2022) (see Section 3 and Table 3 for more details). The average distance difference is −507±634 pc and −635±635 pc, in the sense of Bailer-Jones et al. (2021) minus Hunt & Reffert (2023) and Cavallo et al. (2024), respectively. As clearly emerges, the geometric Gaia DR3 distances from Bailer-Jones et al. (2021) are systematically smaller than the average cluster distance; the difference may even be greater than 1 kpc for the more distant stars. Note that according to Hunt & Reffert (2024), the dispersion in the distance distribution (calculated simply as the inverse of the parallax with uncertainty <20%) of the member stars of the clusters studied here may typically exceed ∼500 pc. This large dispersion clearly exceeded the size of a typical open cluster. For Berkeley 9, NGC 743, NGC 7654, and NGC 7789 clusters, the dispersion is smaller than ∼100 pc. Thus, it can be concluded that the distance derived by the ANN codes of several clusters in Table 1 is not very reliable and/or that some of the stars in our sample may not belong to the corresponding cluster. Therefore, the use of the average DR3 distance to a given open cluster when estimating the luminosity of individual stars within the cluster may lead to a considerable error.
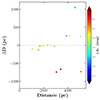 |
Fig. 1. Distance difference between Hunt & Reffert (2023) and Cavallo et al. (2024) to the corresponding open cluster versus distances from the former authors. The colour code (right) shows the difference between the extinction values according to the mentioned authors. Note the significant differences in both distances and AV values in open clusters at distance ≳3 kpc. |
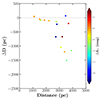 |
Fig. 2. Same as Figure 1 but comparing the distance difference between the geometric DR3 distances to individual stars according to Bailer-Jones et al. (2021), and those measured by Hunt & Reffert (2023) to the corresponding open cluster versus distance from the former authors. The colour code (right) shows the difference between the extinction values of individual stars according to Lallement et al. (2022) using the geometric distances, and those estimated by Hunt & Reffert (2023). The discrepancy in both distance and AV values for stars/clusters at distance ≳3 kpc is significant. |
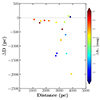 |
Fig. 3. Same as Fig. 2, but comparing distance and extinction values according to Cavallo et al. (2024) instead of Hunt & Reffert (2023). Note again the large differences among stars at distance ≳3 kpc. |
Stellar parameters and abundance ratios of stars.
The difference in the distance to the open clusters translate into large differences in the estimation of age. From Table 2, this fact becomes clear. Despite this, the mean difference between the three studies is not very large2, namely: 0.19±0.38, 0.01±0.44 and −0.18±0.38 for the age (log (age) in years) difference between Cantat-Gaudin & Anders (2020) and Hunt & Reffert (2023), Cantat-Gaudin & Anders (2020) and Cavallo et al. (2024), and Hunt & Reffert (2023) and Cavallo et al. (2024), respectively. However, the age dispersion is considerable: for some clusters, differences in age reach more than a factor 10. On average Cavallo et al. (2024) derive systematically lower ages than the other two studies3. Differences in the age of a given cluster have a critical impact on the estimation of Mini for a given object. For example, adopting the Cantat-Gaudin et al. (2020) ages, the stars IRAS 19582+2907, Case 121, and HD 11800 would have an initial mass larger than ∼6 M⊙. Thus, theoretically, the two former stars would not be C-stars but O-rich AGBs, and the three stars would be candidates for HBB stars. HD 11800 could even be a supergiant: (Dorda et al. 2018) classified it as a KI5b star. However, the spectra of both IRAS 19582+2907 and Case 121 indeed look like normal C stars, as shown below. Therefore, whether IRAS 19582+2907 and Case 121 do not belong to the clusters quoted or the age of Berkeley 72 and FSR 0172 was largely underestimated by Cantat-Gaudin et al. (2020). In fact, Kharchenko et al. (2013), report for these clusters considerably larger ages (8.84 and 9.12, respectively, similar to Hunt & Reffert 2023; Cavallo et al. 2024, see Table 2), so the corresponding turn-off mass would be considerably lower than ∼6 M⊙. One may not discard the possibility that these clusters may contain two stellar populations; IRAS 19582+2907 and Case 121 belonging to the older one. This possibility has already been mentioned for massive stellar clusters in the Magellanic Clouds (see e.g. Costa et al. 2019), although this issue is still under discussion (Bragaglia et al. 2024). The remaining C-stars in our sample belong to clusters with ages (turn-off masses) close to that of NGC 7789, where the kink in the IFMR was identified. The conclusion that emerges from all this is that despite the accurate Gaia DR2/DR3 astrometry, the estimated age of the open clusters remains rather uncertain.
2.3. Spectral analysis
For each star, we computed synthetic LTE spectra using the Turbospectrum v.20 code (Plez 2012) in the different spectral ranges studied. For the C-stars, we used a grid of atmosphere models constructed by K. Eriksson & B. Gustafsson (private communication). The minimum Teff in this grid of atmosphere models is 2500 K. For the coolest star in the sample (the Mira C-star V493 Mon, Chen et al. 2020), we built a ‘tailored’ model atmosphere (Y. Pavlenko, private communication). For S and MS stars, we used the grid of models by Van Eck et al. (2017), and for K and M stars, the common MARCS models. All these models are built in spherical geometry following the assumptions and methods in Gustafsson et al. (2008). The synthetic spectra were convolved using a Gaussian function that mimics the spectral resolution. This included the macroturbulence parameter; typical values used range from 10−15 km s−1. Due to the young ages of the clusters, we initially assumed a solar metallicity for the stars based on the solar abundances of Grevesse et al. (2007). The final metallicity was obtained as the average of the metallicity derived from the theoretical fits to the metallic lines mentioned above (basically the Fe, Ni, and Ti lines). This resulted in a good approximation (see below), except in the star Case 588 (Dias 2), for which we derived an average metallicity [M/H] ∼ −14 (note that this metallicity value is in agreement with that estimated by Cavallo et al. 2024).
As an initial estimate of the effective temperature, we adopted the values derived by Marigo et al. (2022) fitting the spectral energy distribution (SED) of the stars observed at several photometric bands. However, the final value was determined by an iterative method by changing the Teff value of the model atmosphere until a good fit to the observed spectrum was obtained in all spectral ranges studied. We adopted a gravity value of log g = 0.0 (in cm s−2) for all stars; this value is acceptable for stars in the AGB phase. For the less evolved K-type stars, we initially adopted a larger gravity value (typically log g∼1) from the grid of the MARCS models and changed this value (keeping constant the Teff) until good agreement was found in all the spectral ranges studied. For this procedure, we use theoretical fits to the Ca II triplet lines at λ∼8600 Å because the wings of these lines are sensitive to changes in gravity (and effective temperature). The atomic and molecular line lists adopted in this spectral region are from Contursi et al. (2021) and Recio-Blanco et al. (2023); in fact, they are those used in the analysis of the Gaia DR3 Radial Velocity Spectrometer (RVS) spectra. We adopted a microturbulence parameter between 2.5−4.0 km s−1 for M-, MS-, S-, and C-type stars. In general, the microturbulece parameter increased with the wavelength of the spectral region studied. For K-type stars, the adopted value was ∼1.8 km s−1 typically.
The next step was to derive the C/O ratio by iterative fits to some OH, CO, and CN lines in the APOGEE, 2.3 μm, and ∼8000−8600 Å spectral regions until convergence was achieved. In O-rich stars, the oxygen abundance was estimated by the simultaneous fitting of OH lines in the APOGEE region together with some CO lines in the 2.3 μm region, while keeping the C abundance constant. Once a reasonable fit to these features was found, we modified the abundance of C to fit some weak CN lines in the APOGEE region (see Guerço et al. 2022). This modified the C/O ratio; therefore, the O abundance was changed to fit the corresponding OH and CO lines until convergence was found. The C/O ratio derived from these spectral regions was tested at visual wavelengths by fitting some of the TiO bands present there, in particular in the ∼6708 Å Li I line region. In general, we found reasonable fits to these TiO bands; otherwise, we repeated the procedure by changing the C/O ratio until convergence (within the uncertainties, see below) was reached. For C stars, OH lines are unavailable; thus, we estimated the C/O ratios by simultaneously fitting some CO and CN lines in the ranges of 2.3 μm and ∼8000−8600 Å, respectively. For both O- and C-rich objects, the nitrogen abundance was then derived from the CN lines available in the 7900−8100 Å range. However, we note that these CN lines are not very sensitive to variations in the N abundance, making the N abundance rather uncertain.
Finally, considering the effective temperature, gravity, average metallicity, and C/O ratio, we proceeded with a full chemical analysis of the stars. To do this, we computed theoretical spectra in LTE with the Turbospectrum code using the adequate model atmosphere for the observed spectral ranges and changed the abundance of a given chemical species until a good fit was found between the observed (atomic or molecular) and theoretical spectral lines. The observed and synthetic spectra were compared by χ2 minimisation over the whole line profile.
Figures 4, 5, and 6 show examples of synthetic fits to observed spectra in several spectral regions. In particular, Figure 4 shows the best fit (red continuous line) to the K-type star HD 11800 (NGC 743) in the region of the Ca II triplet. The wings of the Ca II lines were used to estimate the gravity of the warmest stars (Teff≳3800 K) in the sample. Some of the metallic lines used to derive the average metallicity in this star (and others) are indicated. Note that the effect of blanketing in the spectral continuum resulting from TiO absorption is not appreciated, even though its C/O ratio is lower than unity (see Table 4). This is because of its relatively high effective temperature. Figure 5 compares the theoretical spectra with the O-rich AGB star 2MASS J20560894+5059071 (Berkeley 53, top panel) and the C-star IRAS 19582+2967 (FRS 0172, bottom panel) in the region where we detected several Zr I lines useful for abundance analysis. The TiO blanketing is clearly observed in the spectrum of the former star. In IRAS 19582+2967, CN absorption dominates this spectral region. Due to their chemical properties, we believe that 2MASS J20560894+5059071 is probably an M-type star in the early AGB phase, while IRAS 19582+2967 is a typical AGB C-star (see Table 1). Finally, Figure 6 compares the theoretical and observed spectra of Case 588 (Dias 2) in the APOGEE region, where some Ce II lines were detected by Cunha et al. (2017) in O-rich stars. We show here that these Ce II lines can also be detected in C-stars, and that some of them are useful for abundance analysis in C-rich objects. Case 588 is the most metal-poor C-star in the sample and clearly exhibits an enhancement of Ce, [Ce/M] = 1.2 dex.
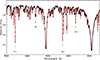 |
Fig. 4. Comparison of observed (solid black circles) and synthetic spectra for the K-type star HD 11800 (best fit, red line) in the region of the Ca II triplet (the λ∼8498 and λ∼8542 Å Ca II lines are shown). Note that the cores of these lines are not well reproduced. Some metallic lines used to determine the metallicity of the sample stars are indicated (see text). This star belongs to the very young open cluster NGC 743 (see Table 2). |
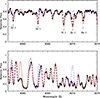 |
Fig. 5. Comparison of observed (solid black circles) and synthetic spectra (lines) for two stars in the sample in the region of some Zr I lines used in abundance analysis. Top panel: O-rich star 2MASS J20560894+5059071 (Berkeley 53). Dashed blue lines: no-Zr and [Zr/M] = 0.0; red continuous line [Zr/M] = +0.5. Bottom panel: Same as for the carbon star IRAS 19582+2967 (FSR 172). Dashed blue lines: no-Zr and [Zr/M] = 0.0; red continuous line [Zr/M] = +0.6. Note the difference in the observed spectrum in this spectral region between an O-rich and a C-rich star; the former star is dominated by TiO and atomic absorptions, whereas the C-star is dominated by CN lines. |
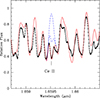 |
Fig. 6. Comparison between the observed (solid back circles) and synthetic spectra (lines) of the C-star Case 588 (belonging to the cluster Dias 2) in the APOGEE region. In this spectral region, some Ce II lines identified by Cunha et al. (2017) were used for abundance analysis. Dashed blue lines: no Ce and, [Ce/M] = 0.0; Solid red line: [Ce/M] = +1.2, best fit. |
Absolute Ks and bolometric magnitudes of the stars derived using distances and extinctions from different cases.
A detailed discussion of the error sources and their impact on the final abundances (or isotopic ratios) derived can be found in our previous studies on the chemical composition of AGB stars (see, e.g. Abia et al. 2002, 2009, 2017a; Hedrosa et al. 2013). The total uncertainty in the determination of the abundance can be calculated from the dependence of the specific abundance (or abundance ratio) on the stellar atmospheric parameters. These errors are typically ±200 K in Teff; gravity ±0.5 dex, microturbulence ±0.5 km s−1, metallicity ±0.25 dex, and the C/O ratio from ±0.05 to ±0.1 (the cooler the star, the lower this error). To this, we add the uncertainty in the location of the spectral continuum (≲1% for K-type stars, and ∼1−4% for the rest of the spectral types); this uncertainty is typically larger in the visual than in the NIR spectrum. This effect also primarily affects stars with Teff≲3800 K. The quadratic addition of all these sources of error gives a typical uncertainty of ±0.25 dex for the [M/H] and [F/M] ratios; ±0.3 dex for the average s-element enhancement, [〈s〉/M]; ±0.03 dex for the C/O ratio; ±10 for the 12C/13C ratio; a factor of two for the 14N/15N ratio; ±300 for 16O/17O ratio, and finally, between ±0.2 dex and ±0.4 dex for the Li abundance from the warmest to the coolest stars in the sample, respectively. These values exclude possible systematic errors, such as those in the model atmosphere structure and possible deviations from the LTE.
3. Results and discussion
Table 3 presents the stellar parameters adopted for our stars and the main chemical features derived. [〈s〉/M] is the average abundance of s-elements (derived from some Zr, Ba, and Ce lines; see Section 2). In the following, we discuss the abundance results for C- and O-rich stars independently.
3.1. Carbon stars
First, we excluded the C-star V493 Mon. As we mentioned previously, this star is a Mira variable with very broad and crowded spectral lines, so its chemical analysis is rather uncertain (see Table 3), probably requiring the use of a dynamical model atmosphere (see e.g. Lebzelter et al. 2014). Excluding this object, most of the C-stars analysed have a metallicity close to solar, considering the typical uncertainty (±0.25 dex). This confirms our hypothesis of initially adopting a solar metallicity in the chemical analysis considering the youth of the clusters. The exception to this rule is Case 588 (Dias 2), for which we derive [Fe/H] = −1.0. For the other C-star in the same cluster, DH Mon, we instead derived [Fe/H] = −0.30, which is in very good agreement with the value estimated by Dias et al. (2021) for this cluster. Further spectroscopic measurements of the metallicity of the stars belonging to Dias 2 are needed to elucidate this issue. For the rest of the C stars, we derived a metallicity in excellent agreement with that obtained from Dias et al. (2021) in the clusters in common. This is not the case when compared to the metallicity estimated by Cavallo et al. (2024). With the latter authors, we only agreed on the metallicity value for two C-stars (Case 63 and Cas 473); Cavallo et al. (2024) systematically obtained much higher metallicities than we did. Hunt & Reffert (2023) did not estimate the metallicity of the clusters in their study. We found in the literature more reliable spectroscopic estimates for NGC 7789 ([Fe/H] = −0.03±005, Nagarajan et al. 2023) and Trumpler 5 ([Fe/H] = −0.49±0.14, Lucertini et al. 2023), which agree (within the uncertainty) with our estimation for the stars MSB 75 and V493 Mon that belong to these clusters, respectively.
However, the C/O ratios derived in C-stars are only slightly larger than unity; the higher value is found for the metal-poor star Case 588 (C/O = 1.41), which agrees with the theoretical expectation that the TDU is more efficient at decreasing metallicity and with the fact that it is easier for an metal-poor AGB star to become C-rich because the lower O abundance. The ratio C/O ≈ 1, found in almost all the C-star in our sample agrees with the theoretical expectation of Marigo et al. (2022) and Addari et al. (2024) in the case that shallow TDUs occur in the particular Mini range where the kink in the IFMR is suggested to exist. However, C/O ∼ 1 have been found in the overwhelming majority of galactic field AGB C-stars with metallicity close to solar, independently of their mass (see e.g. Lambert et al. 1986; Abia et al. 2002).
For this reason, alternative explanations have been proposed. For example, Lodders & Fegley (1997) suggest that as carbon is transported to the surface by the action of the TDU episodes and the star progressively cools in its ascent to the AGB phase, the carbon atoms condense into amorphous graphite, TiC, and SiC grains on the cool surface of the star. Consequently, the gas phase at the surface is continuously depleted in carbon by condensation into grains. This may cause the C/O ratio in the gas phase (what we actually see in the visual and NIR spectra) to never exceed unity significantly. This process is highly dependent on the metallicity of the star (Lodders & Fegley 1997): in metal-poor carbon stars, C/O ratios exceeding largely unity are found, as is the case for our only metal-poor star in the sample (Case 588; see Table 3) and for the few extragalactic metal-poor AGB C-stars studied to date (de Laverny et al. 2006; Abia et al. 2008).
Taking into account the typical uncertainty in the abundance features shown in Table 3 (see Section 2), the derived isotopic ratios of carbon, nitrogen, and oxygen are also similar to those found in normal-field C stars (Lambert et al. 1986; Ohnaka & Tsuji 1996; Abia et al. 2002, 2017a; Hedrosa et al. 2013). The 12C/13C found typically range from 30 (the value expected in the early AGB phase for solar metallicity stars) to about 60 as 12C is added into the envelope due to the TDU. The C stars studied do not show evidence of extra mixing during the AGB phase, as this phenomenon would result in the 12C/13C ratio falling below 30 (see e.g. Busso et al. 2010; Karakas & Lattanzio 2014). Only DH Mon exhibits a low ratio ∼10, but together with the other chemical characteristics found in this star, this low carbon isotopic ratio indicates that this object is not a normal C-star but probably a J-type carbon star. Note that the luminosity derived for this star (see Table 4) agrees very well with the average value found for J-type stars in the Galactic field, which is fainter than that of normal C-stars (Abia et al. 2022). Obviously, more detailed spectroscopic and photometric studies are needed to elucidate the nature and evolutionary stage of this carbon star.
Another valuable piece of information is provided by the 14N/15N and 16O/17O ratios. During the AGB phase, these isotope ratios are not expected to be modified from the values attained after the first dredge-up (FDU). Only in the case of the occurrence of extra mixing episodes during the RGB and/or AGB phases would these ratios increase because the operation of the CNO cycle easily destroys 15N and 17O by proton capture reactions. The 14N/15N we measured in a few C-stars were close to the values typically attained after the FDU (∼1000) in stars with initial masses in the range that would become C-stars during the AGB phase (∼1.5−3.0 M⊙ for solar metallicity). The same occurs for the 16O/17O ratio: the values derived here range between 300 and 1000, just the expected values after the FDU in solar metallicity stars in the same range of initial mass and similar to those found in field C-stars (Abia et al. 2017a). This result agrees with the standard theoretical predictions for low-mass AGB stars (see Karakas & Lattanzio 2014; Cristallo et al. 2015). Again, only the star DH Mon deviates from this finding: we derive a low 14N/15N (see Table 3). Similar low nitrogen isotopic ratios have been observed in other J-type stars (Hedrosa et al. 2013), which reinforces the idea that DH Mon is a C-star of this type and that J-type stars might be sources of AB-type grains (e.g. Davis 2011). If confirmed with further abundance analyses, and considering the age of the host cluster of DH Mon (Dias 2, see Table 2), this may constrain the proposed scenarios for the formation of these carbon stars of still unknown origin (e.g. Zhang & Jeffery 2013; Sengupta et al. 2013; Choplin et al. 2024).
The same can be concluded by looking at the remaining chemical properties of the C-stars studied here. Li is heavily depleted in all of them, as observed in most AGB C-stars of the Galactic field (Abia et al. 1993). This result also agrees with the standard theoretical modes for AGB stars (see e.g. Palmerini et al. 2011). Again, DH Mon is an exception: this star exhibits a mild enhancement (see Table 3) similar to that found in many other J-type stars (Abia & Isern 2000). Finally, the fluorine and s-element ratios derived with respect to the average metallicity are also those typically found in normal C-stars of near-solar metallicity: i.e. low or mild enhancements. On the other hand, among the carbon stars that Marigo et al. (2022) placed just in the kink of the IFMR (Case 63, Case 588 and MSB 75), we did not find significant differences in their chemical features (considering the typical uncertainties mentioned above) with respect to the other carbon stars in the sample. Only Case 588 exhibits larger C/O and [〈s〉/M] ratios because of its considerably lower metallicity (see Table 3), which agrees with theoretical expectations (see e.g. Busso et al. 1999). Thus, globally, the C-stars belonging to the open clusters in our sample show a chemical pattern similar to that found in the overwhelming majority of field galactic C-stars, without any chemical anomaly.
3.2. O-rich stars
For the seven O-rich stars in the sample of spectral types K, M, MS, and S, we also found a near-solar average metallicity for all of them (see Table 3), again consistent with the young age of the open clusters. For these stars, except one, we agree with the metallicity derived for the corresponding open cluster by Dias et al. (2021) and Cavallo et al. (2024). The exception is the K-type star BD +60 2534 in NGC 7654, we derived [M/H] = +0.1, while Cavallo et al. (2024) derive +0.53 as the average metallicity of the cluster. To our knowledge, there are no other determinations of the metallicity of this cluster in the literature. However, our analysis of the Hertzsprung-Russell (HR) diagram of this cluster seems incompatible with such a high metallicity (see below). For the stars in the sample that belong to the same cluster (Berkeley 53, see Table 1), we derive a consistent metallicity between them within the uncertainty. In the literature, we find more robust spectroscopic derivations of the metallicity: [Fe/H] = −0.12±0.17 for NGC 1798 (Carrera 2012), and [Fe/H] = −0.02±0.05 for Tombaugh 1 (Sales Silva et al. 2016), values that are also in agreement (within the uncertainty) with the metallicity estimated here for [D75b]Star 30 and CSS 0291, which belong to these clusters, respectively.
The Li abundances derived from O-rich stars are similar to those found in stars of the same spectral type in the Galactic field and in some globular clusters (see e.g. Luck 1977; Lambert et al. 1980; Luck & Lambert 1982; Brown et al. 1989; Mallik 1999; Canto Martins et al. 2011). According to the standard stellar evolution and, depending on the stellar mass and metallicity, the Li abundance in the envelope is gradually depleted because of the inward extension of the convective envelope as the star evolves. Li abundances in the range A(Li) ≈ 1 to −1.5 (or even smaller) are expected after the FDU to the AGB phase: the highest Li values are usually found in less evolved K-type stars, while the lowest values are found in O-rich stars already in the AGB phase, such as MS- and S-type stars (see Palmerini et al. 2011). Despite the small number of O-rich objects studied here, Table 3 shows such a trend: the K-type stars HD 11800 and BD +60 2534 have higher Li abundances, while the MS- ([D75b]Star 30) and S- (CSS 0291) type stars have the lowest values among our O-rich stellar sample. These two latter stars exhibit Li abundance similar to those found in more evolved C-stars.
The C/O ratio derived in O-rich stars is obviously lower than unity. Taking into account this fact, the relatively low Teff of the stars IRAS 20540+5049 and 2MASS J20560894+5059071 (of unknown spectral type according to SIMBAD, see Table 1), and the presence of metal oxide bands in their spectra make us conclude that these two objects are typical M-type giants. On the other hand, we found a sequence of increasing C/O ratios from K-type stars to MS- and S-type stars; i.e. from solar-like values (∼0.54) in the former stars to somewhat larger values (∼0.70 in the latter). This is the expected consequence of the operation of the TDU during the TP-AGB phase. This is also appreciated in the 12C/13C ratios derived as they go from typically post-FDU values (∼20, the exact value depending on the stellar mass and metallicity) in the K-type stars (HD 11800, and BD +60 2534) to larger values (>30) in M-, MS-, and S-type stars already in the TP-AGB phase. This trend in the C/O and 12C/13C ratios is consistent with the location of these O-rich stars in the Gaia-2MASS diagram (see Fig. 7 below, blue points): HD 11800, BD +60 2534 and HD 292921 are located in the ‘faint AGB and RGB region’ and the rest of the O-rich objects in the ‘low-mass O-rich AGB’ area. We did not find evidence of any extra-mixing process or operation of the HBB in any of the O-rich stars, since this would imply 12C/13C⪅20, a significant Li and 14N enhancements, and some 12C depletion (see e.g. McSaveney et al. 2007; García-Hernández et al. 2013; Ventura et al. 2015; Abia et al. 2017b). Although the minimum mass for the operation of the HBB is still uncertain, this would imply that the O-rich TP-AGB stars studied here would have a mass not greater than ∼5±1 M⊙, which is compatible with the ages of the open cluster reported in Table 2, to which these stars belong, and with our analysis of the clusters in the next section. Thus, only stars HD 11800 and BD +60 2534, for which we estimate a mass ∼5 M⊙ (see below), might suffer HBB in the future, as they evolve through the TP-AGB phase. In contrast, the C/O and carbon isotopic ratios derived agree with those found in similar evolved stars in open clusters (Gilroy 1989), and the Miras and semi-irregular M variables in the Galactic field (Hinkle et al. 2016; Lebzelter et al. 2019).
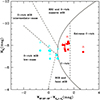 |
Fig. 7. Gaia-2MASS diagram for our sample stars. The curved solid line delineates the theoretical limit between the O-rich (cyan symbols) and AGB C-stars (red symbols). Dashed lines separate the sub-groups of stars, as indicated in the figure. The circles correspond to |


The nitrogen isotopic ratio was not derived in any of the O-rich stars in the sample. This is because the C14N lines at ∼8000 Å useful for this are extremely weak or absent in these stars. We derived the 16O/17O ratio in four of the seven O-rich stars (see Table 3). These ratios are similar to those derived in the corresponding Galactic field K- and M-type stars (Harris et al. 1988; Smith & Lambert 1990; Hinkle et al. 2016; Lebzelter et al. 2019) of similar metallicity. Standard stellar models predict that, with the exception of the more massive AGB (M>4−5 M⊙), which may undergo HBB, the oxygen isotopic ratios should coincide with those left by the FDU. No significant differences are expected among the M, MS, S, and C-stars with similar masses. The majority of MS and S stars, with masses ranging between 1.5 and 3 M⊙, should have 16O/17O roughly confined between 200 and 1000. M stars, which can be less massive, show larger 16O/17O ratios of up to about 2700 (see e.g. Karakas 2010; Lebzelter et al. 2015; Hinkle et al. 2016; Abia et al. 2017a). This is what we found here: together with the 12C/13C ratio, the 16O/17O ratios derived would be compatible with these stars having a mass ∼1.5−3.5 M⊙, which is consistent with our conclusion above that these stars do not suffer HBB. Unfortunately, we could not derive the 17O/18O ratio, which is a good tracer of HBB. The above mass range is also compatible with the age estimated for the clusters Berkeley 34, Berkeley 53, NGC 743, NGC 1798, NGC 7654, and Tombaugh 1 (see Table 2), to which the seven O-rich stars belong, and with our analysis of these clusters (see next section).
Finally, the [F/M] and [〈s〉/M] ratios derived agree with theoretical expectations according to their evolutionary status. The K-type stars HD 11800 and BD +60 2534 show solar-like ratios (within the uncertainty), suggesting that these stars have not yet entered the TP-AGB phase: considering their  magnitude (see Table 4), they are probably near the tip of the RGB or in the e-AGB phase. The rest of the O-rich stars show small fluorine and s-element enhancements, indicating a more advanced evolutionary stage. The MS-type [D75b]Star 30 deserves a separate comment: among the O-rich stars, this object has the largest [F/M] and [〈s〉/M] ratios, which would indicate that it had undergone several TDU episodes. However, its luminosity might be as low as Mbol=−3.8 mag, derived from the individual distance by Bailer-Jones et al. (2021) (see Table 4). For the initial mass that we derived for this star (∼2.0 M⊙, see Table 5) this low luminosity value would indicate that this star is at the very beginning of the TP-AGB phase, which seems to be incompatible with its mild s-element enhancement (see Table 3) and O-rich nature. According to the FRUITY database, even for a lower mass model (1.5 M⊙, Z=Z⊙), a value [〈s〉/M] ∼ +0.5 is reached after 4 or 5 TPs, when the star is brighter (Mbol∼−4.2 mag) than observed and it is already a C-rich star. A possible solution is that this star might be an extrinsic low-mass O-rich star, and its F and s-element enhancements might be due to the mass transferred from a more massive companion when it was in the AGB-phase5. On average extrinsic S-stars are less luminous than intrinsic ones: 〈Mbol〉=−3.52±0.68 mag and 〈Mbol〉=−4.42±0.68 mag, respectively (see e.g. Abia et al. 2022).
Stellar parameters predicted by the FUNS code and from the HR diagram analysis of the OCs for the stars in the sample.
3.3. Stellar luminosities
As was mentioned in Section 1, another goal of this work was to study the possible existence of a discontinuity in the IFMR suggested by Marigo et al. (2020, 2022) in the initial stellar mass range ∼1.6−2.1 M⊙. To do so, we need to derive the bolometric luminosity, which would give an estimate of the current core mass, Mcore, for each AGB star in our sample. This is done by using the predictions of TP-AGB stellar models because, as is well known, there is a direct proportionality between the quiescent luminosity sustained by the H-burning shell and the core mass during the AGB phase (see e.g. Eggleton 1967; Paczyński 1970; Boothroyd & Sackmann 1988). To calculate Mbol, we estimated the absolute magnitude,  , using three different approaches to derive the distance and then applied a bolometric correction (BCK). We used the empirical BCK versus (J−K) relation in carbon stars by Kerschbaum et al. (2010). This was based on a critical review of previous bolometric correction studies on cool giants. For (J−K) between 1.0 and 4.4 mag, the maximum standard deviation of this relation is 0.11 mag, although for values (J−K)≥2.2 mag, the scatter increased to 0.15 mag. For the O-rich stars in this study, we also adopted the relation derived by Kerschbaum et al. (2010) for M stars. These three approximations (cases) were all based on Gaia DR3 astrometry. Then we used the location of our sample stars in the Gaia-2MASS diagram (Lebzelter et al. 2018) as another tool to infer their evolutionary status. The cases are as follows:
-
Case 1: We adopted individual Gaia DR3 geometric Bayesian distances according to Bailer-Jones et al. (2021) without any parallax zero-point offset. Recent studies have shown that Gaia DR3 parallaxes are affected by a systematic offset, whose magnitude is primarily dependent on the position in the sky, magnitude, and colour (see, e.g. Groenewegen 2021). However, the source samples used for zero-point calibration do not adequately cover the characteristic intervals of the AGB stars for some parameters. Therefore, these corrections must be performed with caution for these stars. On the other hand, we preferred to use the geometric distances instead of the photo-geometric ones because it is still unclear whether large variations in the colours of the stars (note that most of the stars in our sample are variables of different types) affect the parallax measurement. We confirmed that for our stars the geometric distances are, on average, only slightly larger (∼4%) than the photo-geometric distance, so the impact on the derived luminosity is negligible.
The extinction of each star, AV, was derived from the 3D Galactic model by Lallement et al. (2022). For reddening corrections, we used the relations
 AV and AJ = 2.47
  (Cardelli et al. 1989). Note that the 3D Galactic model by Lallement et al. (2022) is combined with that of Marshall et al. (2006) on the outer disc (>3 kpc). In the latter case, a correction was applied to allow a smooth transition. We have already mentioned that for stars located at distances larger than this limit, significant differences are observed between the extinctions and distances derived from the three approximations considered here.
 -
Case 2: We adopted the distances and extinctions of the open cluster to which each star belongs according to Hunt & Reffert (2023). These authors inferred the basic astrometric parameters, ages, extinctions, and distances of more than 7000 Galactic clusters, some of which are candidate new objects. They used hierarchical density-based spatial clustering of applications with a noise algorithm to recover the clusters. They validated the clusters using a statistical density test and a Bayesian convolutional neural network for the colour-magnitude diagram classification (we refer to this paper for details).
-
Case 3: Similar to the previous case, we adopted the distances and extinctions of the open clusters to which each star belongs, but according to Cavallo et al. (2024). These authors developed an artificial neural network (ANN) trained on synthetic clusters to estimate the age, metallicity, extinction, and distance of the Gaia open clusters (again, we refer to this paper for details).
An extended discussion on the difference in the distances, extinctions, and ages of the Galactic open clusters in the most recent literature can be found in Cavallo et al. (2024); in particular, a detailed comparison is made with the studies by Dias et al. (2021) and Hunt & Reffert (2023). The luminosities obtained in these three cases had to be compared with those derived by Marigo et al. (2022), who used Gaia DR3 purely inverted parallax-based distances and theoretical fits to individual SEDs (see Table 4) to determine the luminosity of the stars. In the SED fitting procedure, the parameters gravity, Teff, mass and C/O ratio were allowed to vary within selected ranges by the authors. During the match with the observed spectrum, from several photometry filter values, they also specify the distance of the star (derived as mentioned above) and the AV value obtained from Cantat-Gaudin & Anders (2020) and/or Dias et al. (2021) (see Marigo et al. 2022, for details).
Table 4 presents the de-reddened absolute magnitudes,  and Mbol, derived in the three cases above. It also shows the distances and AV values derived in case 1 for each star. This must be compared with similar values given in Table 2 (cases 2 and 3). The uncertainties in
  and Mbol are dominated by those in the distances. For the typical parallax uncertainty in our stars (≤15%, see Sect. 2), an error of ∼±0.22 mag in the absolute magnitudes is estimated. Adding the uncertainties associated with the magnitudes J and Ks and the bolometric correction, we estimated ±0.28 mag as a typical error for
  and Mbol in the full sample of stars. The actual uncertainty is probably slightly higher because we did not consider the uncertainty in AV in this estimate. We also included in Table 4 the values of
  and Mbol derived from Marigo et al. (2022) for a more detailed comparison. Note that some stars studied here were excluded from the SED analysis by these authors; thus, their magnitudes are not given in this table.
On average, in case 3, we derive higher luminosities, followed by cases 2 and 1, in this order. This is mainly due to the larger distances on average derived by Cavallo et al. (2024) for the clusters. Extinction plays a secondary role in general, although in some clusters like Berkeley 53 and FSR 0172, differences in the AV between the three cases are significant, so the impact on the stellar luminosity is not negligible. In fact, at least in Berkeley 53 and NGC 7654, the presence of an abnormal (differential) interstellar extinction law towards the cluster (Maciejewski et al. 2009; Pandey et al. 2001) is already known. For the C-stars in our sample, it is interesting to compare their luminosity with the average value obtained in large surveys of C-stars in the Galaxy and the Magellanic Clouds. Our average  and Mbol magnitudes for case 1, case 2, and case 3 are −7.96±0.28 mag, −8.05±0.38 mag, −8.20±0.21 mag; and −4.81±0.27 mag, −4.92±0.38 mag, and −5.08±0.21 mag, respectively. These average values agree well within the uncertainties with those found in NIR photographic surveys of the Magellanic Clouds (e.g. Frogel et al. 1980) and the Galaxy (Schechter et al. 1987), and with the more recent Galactic survey based on Gaia DR3 astrometry (Abia et al. 2022,
  mag and Mbol=−5.04±0.55 mag, respectively).
After calculating the luminosity of the stars, we constructed the Gaia-2MASS diagram (see Fig. 7). The proposed method was originally designed by Lebzelter et al. (2018) and is particularly suitable to highlight the presence of AGB stars. In this diagram, the  magnitude is correlated with a particular combination of Gaia and 2MASS (Two Micron all Sky Survey) photometry through the quantity
  , where WRP,BP−RP and
  are reddening-free Wesenheit functions (Soszyński et al. 2005), defined as WRP,BP−RP=GRP−1.3(GBP−GRP) and
  , respectively. This diagram is a powerful tool for analysing and identifying the different spectral types of AGB stars as a function of their chemical type and initial mass. The diagram also allows the distinction between regions with low-, intermediate-mass, and massive O-rich AGB stars, RGB or faint AGB stars, red super-giants, and normal or extreme C-rich AGB stars, and the specific stellar mass range in each group depending on the stellar metallicity (see Girardi et al. 2005; Marigo et al. 2017; Lebzelter et al. 2018, for details). The region called extreme C-rich stars concerns very red objects with high (J−Ks) values that are associated with high mass-loss rates but do not necessarily have large C/O ratios.
Figure 7 shows the C- and O-rich AGB stars (red and blue symbols, respectively) in our study for case 1 (solid circles) and case 2 (open triangles). For clarity, we do not include case 3 in this figure; in any case, most of the data points in this last case would be shifted to slightly lower  values (see Table 4). It can be observed that all the stars are placed in the expected location depending on their C- or O-rich nature. The object located in the extreme C-rich region is the C-star V493 Mon, which belongs to the oldest cluster in the sample, Trumpler 5. This star is classified as a Mira variable. In fact, its spectrum is crowded with very broad Doppler-shifted lines. This is usually a sign of strong atmospheric pulsation and large mass loss. As a consequence, the chemical analysis of this star was very limited (see Table 3) because we could only derive (or set upper limits) in a few chemical features. Furthermore, since we did not consider the role played by the existence of circumstellar extinction in the derivation of the luminosity of the stars, the luminosity of V493 Mon is more uncertain than that of the other stars. Finally, the two stars located just at the border between the O- and C-rich zones in the RGB and faint AGB star region are the K-type stars HD 11800 and BD +60 2534. These stars are classified as red supergiants in the SIMBAD database; however, both have a luminosity fainter than expected for such a type of star: Mbol≲−6.5 mag (see e.g. Dorda et al. 2016 and Table 4), and absolute K-magnitude typical of a giant star near the tip of the RGB (
 mag). The chemical analysis of these two stars is also compatible with normal post-FDU RGB stars or e-AGB stars.
3.4. Comparison with the theoretical models: Nucleosynthesis and the IFMR
In this section, we compare the chemical patterns found in individual stars with the predictions of theoretical nucleosynthesis during the AGB phase from the FUNS stellar evolutionary code and the FRUITY database (Cristallo et al. 2011, 2015). To do this, we assume the luminosities derived in case 1 (Section 3) and look for the nucleosynthesis predictions from the FRUITY database just at the luminosity and metallicity derived for each star (within the observational uncertainty, see Tables 3 and 4 and Section 2). The reason for choosing case 1 for the stellar luminosities is that, as discussed previously, we prefer distances and extinctions to individual stars rather than the average distance and extinction to the cluster. In fact, for the case 2 and 3 luminosities, we could not find a good theoretical solution for the chemical pattern observed in six and five stars in the sample, respectively. In this comparison, we excluded the C-stars V493 Mon and DH Mon. The former star is a Mira variable showing very broad spectral lines, for which we were unable to perform an accurate abundance analysis. The latter star is probably a J-type carbon star, whose origin is unknown, showing a chemical pattern that is very different from that of normal C-stars. It is important to note that, with the approximations made in the FUNS code with regard to mass loss and convection treatment, we are able to reproduce the observed luminosity function of Galactic AGB C-stars (see e.g. Abia et al. 2022).
The procedure we followed to derive the turn-off mass (i.e. Mini) and the corresponding age of each cluster is illustrated next. We selected the stellar members of each cluster from the catalogues in Hunt & Reffert (2023, 2024) applying three filters; we selected only stars with the flags RUWE < 1.4, DR3 astrometry fidelity >0.9, and cluster membership probability >68%. These catalogues also provide the G magnitude and (BP−RP) colour for each star. The uncertainty in G and (BP−RP) was calculated from the corresponding flux errors in the Gaia DR3 database. Then, the stellar effective temperature and luminosity of each star were calculated. First, for each cluster, we considered their distance and absorption AV as in case 1 (see above), assuming typical errors of 10%, and 0.1 mag, respectively. The uncertainty for the metallicity of the cluster was fixed at 0.25 dex and we also adopted a mean [α/Fe] content typical of the Galactic disc, that is, it varied as a function of the metallicity, assuming a dispersion of 0.1 dex (Recio-Blanco et al. 2014). Then, for each dwarf star, we adopted a random gravity in the range log g = 4.0−4.5. The mean extinction in the Gaia bands towards each cluster, E(BP−RP), was then estimated from AV, adopting the conversion coefficients provided by the PARSEC stellar isochrones webpage6. From log g, [M/H], [α/Fe], and (BP−RP) colour corrected from the adopted extinction, we computed the stellar effective temperature using the relation of Casagrande et al. (2021). However, for hotter stars (Teff≳8000 K), we adopted the relation by Jordi et al. (2010), forcing their value at 8000 K to be equal to Casagrande et al. (2021). The uncertainty in Teff is dominated by photometric errors, which are negligible. Therefore, we assumed a Teff uncertainty of ±100 K for each star. Bolometric corrections for the Gaia G band (BCG) were calculated from Teff, log g, and [M/H] by using the parametrisation derived from Casagrande & VandenBerg (2018) for stars cooler than 8000 K. For hotter stars, we adopted the relation of Eker & Bakış (2023), again rescaling their values to the Casagrande & VandenBerg (2018) one at 8000 K. The absolute bolometric magnitudes were calculated from BCG, the apparent magnitude in the G band, the absorption, and the adopted distance (case 1). Then, it was converted into stellar luminosity, adopting Mbol = 4.74 mag for the Sun. Finally, the uncertainty in the luminosity and effective temperature was estimated by performing 1000 Monte Carlo realisations, varying all the input parameters within their uncertainty ranges. The effective temperature and luminosity values obtained are then the median of the Monte Carlo distributions, while their uncertainty is the value (Q84−Q16)/2, with Q16 and Q84 being the values of the 16th and 84th quantiles of the distributions, respectively.
The low quality of the photometric data renders the age of these open clusters, when determined by the classic isochrone fitting method, highly uncertain, even employing sophisticated machine learning algorithms (see, e.g. Hunt & Reffert 2023; Cavallo et al. 2024). Consequently, we derived a range of possible turn-off masses by comparing a set of FUNS evolutionary tracks, whose metallicity is compatible with that of each cluster, with the location of turn-off stars in the HR diagram. In practice, we employed a visual fitting to select the possible minimum and maximum mass at the turn-off. This fitting is sufficiently conservative, and uncertainties in the measured distance, extinction, and metallicity were also considered.
Table 5 lists the stellar parameters, according to the FUNS code, that best account for the chemical patterns of the AGB stars in our sample, namely (columns 3 to 7): the estimated main-sequence mass (Mstar), the bolometric magnitude, the metallicity, the number of TDU events that occurred so far, and the current core mass (Mcore). Next, we list the range of possible turn-off masses (Mto), as deduced by means of the track fitting described above, and the final mass of the FRUITY model with main-sequence mass Mstar. For comparison with previous studies, the corresponding age range is also reported (last column of Table 5), but the latter data are not used in our analysis.
We note that the gravity adopted in the spectroscopic analysis (see Table 3) is consistent (within the uncertainty) with that deduced from the usual expression linking gravity with luminosity, mass (see Table 5) and effective temperature, for all the stars except for HD 292921 and CSS 0291. For these two stars, the estimated spectroscopic gravity is significantly higher than the theoretical one.
In general, we find that the FUNS/FRUITY predictions for AGB models in the ∼1.5−2.0 M⊙ range can account for most of the chemical features observed in the C-stars of the sample at the luminosity quoted in Table 5 (within uncertainties). Only for the C-star IRAS 19582+2907, we found that a ∼3.0 M⊙ AGB model would fit the observations better. In any case, this mass range (∼1.5−3.0 M⊙) agrees very well with that predicted for a star to become a C-star during the AGB phase for near-solar metallicity (Karakas & Lattanzio 2014; Straniero et al. 2023). Remarkably, for the two metal-poor C-stars in the sample (Case 588 and C* 908), the Mstar found is ≲1.5 M⊙, which also agrees with the theoretical prediction that the lower mass limit for an AGB star to become C-rich decreases with metallicity. However, the FUNS models do not match the C/O and 12C/13C ratios derived in most of the C-stars, which are predicted to be larger than observed. Note that PARSEC/COLIBRI models by Marigo et al. (2022), Addari et al. (2024) can account for the ratio C/O slightly larger than 1 found in most of C-stars in the sample, assuming that shallow TDUs and low mass loss rates occur in the particular Mini range where the kink in the IFMR is suggested to exist7. However, as mentioned previously, this is a long-standing problem between theoretical predictions and observed C/O ratio in C-stars (e.g. Straniero et al. 2023 and references above). It should be noted that some bright RGB stars show 12C/13C ratios lower than expected after the FDU (e.g. Shetrone et al. 1993). For a nearly solar composition, in particular, 10<12C/13C<20 is typically found (see Fig. 13 in Lagarde et al. 2024). This occurrence is commonly ascribed to the operation of some extra-mixing processes, which are active just below the convective envelope. In this framework, as a low-mass star (M≲2.5 M⊙) evolves in the bright part of the RGB and experiences moderate extra-mixing, it should present a 12C/13C<20, but only marginal changes of the C/O and other isotopic ratios of CNO (see Fig. 6 in Straniero et al. 2017). Later, when this star arrives on the AGB and undergoes a number of TDUs, so that the C/O becomes ∼1, the corresponding 12C/13C should be <40. Note that the C-stars in our sample, for which we obtain 12C/13C<40, have initial masses low enough to be compatible with this RGB extra-mixing scenario. Next, we comment on the theoretical solutions for some particular stars.
IRAS 20540+5049, 2MASS J02560894+505907, and Case 473: These three objects belong to the old open cluster Berkeley 53. The Gaia DR3 astrometry solutions for 2MASS J02560894+505907 and Case 473 have the flag fidelity <0.5, so the distance to these two stars may be quite uncertain. For these three objects, the solution found (MAGB∼1.5 M⊙) is only based on FUNS theoretic predictions because we could not fit the observational HR diagram of this cluster. In fact, the stars in the main sequence of this cluster show a large spread in luminosity for a given Teff, and the turn-off luminosity appears quite diffuse. This cluster is known to exhibit high differential extinction (see above). For clarity, only Case 473 is included in Table 5 and Figure 8.
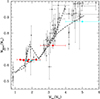 |
Fig. 8. The Semi-empirical IFMR obtained using the stars in this study. The red and cyan circles are our C-stars and O-rich, respectively. Note that several stars in Table 5 correspond to the same data point. Grey points are white dwarfs from Cummings et al. (2018). The 4-piece linear fit (long-dashed line) draws the kink around Mini∼1.6−2.1 M⊙ suggested by Marigo et al. (2020, 2022). The dash-dotted line is the best fit obtained by Hollands et al. (2024) from the analysis of the double white dwarf binaries from Gaia DR3, focusing on the range Mini = 1−5 M⊙. |
[D75b] Star 30: This MS-type star belongs to NGC 1798 and also has a fidelity astrometry flag <0.5. In fact, we derived a distance (case 1) that is significantly smaller than that derived by Cantat-Gaudin et al. (2020), Hunt & Reffert (2023) and Cavallo et al. (2024) (see Tables 2 and 4). Its luminosity according to case 1 is rather low (Mbol=−3.8 mag) for a star in the AGB phase, as pointed out by its mild F and s-element enhancements (see Table 3), except if it is an extrinsic S star. However, its RUWE flag is lower than 1.4 indicating that the DR3 single-star astrometry solution for this star is valid. If it were a normal intrinsic S star, then we have to nearly double its distance to find a coherent solution between the fitting to the HR diagram of NGC 1798 and the FUNS predictions. The parameters listed in Table 5 for this star correspond to this option.
HD 292921: This M-type star belongs to Berkeley 34. The luminosity derived in case 1 is marginally in agreement (within the uncertainty, see Table 4) with that obtained from the FUNS predictions for its chemical pattern (see Table 5). A greater distance to this star would lead to better agreement with its observed (case 1) and predicted luminosity. Note that the distance to this cluster vary significantly among the different recent studies (see Table 2).
Case 121: For this carbon star (Berkeley 72) our theoretical estimate of its luminosity (Mbol=−4.70 mag, Table 5) is also marginally in agreement with the value derived in Case 1 (Mbol=−5.0 mag). For cases 2 and 3 this star would be even more luminous. This fact, together with the young age for Berkeley 72 derived by Hunt & Reffert (2023) and Cavallo et al. (2024), points out that this star would have a considerable mass, ∼6−7 M⊙; thus, a plausible candidate for the occurrence of HBB. However, if that were the case, this star would be an O-rich AGB, not a carbon star, as its spectrum reveals. Our chemical analysis of this star would be compatible with a mass in the 2−2.5 M⊙ range, compatible with being an AGB carbon star. We note that this star has a DR3 astrometry fidelity flag <0.5, and that Dias et al. (2021) derive an older age for Berkeley 72, so the progenitor mass of Case 121 would become ∼3.0 M⊙ according to the age estimated by these latter authors, which puts it back into a normal TP-AGB star and would be more in agreement with our solution. Furthermore, we did not find any evidence of nitrogen enhancement, or a low 12C/13C, both of which are signatures of HBB. Nevertheless for this star, we do not find good agreement between some of the observed and predicted abundance figures. In particular the observed 16O/17O ratio (1000) is much higher than predicted (300), whereas the observed [〈s〉/M] ratio (0.2 dex) contrasts with the predicted one (0.7 dex). Considering some extra-mixing in this star would put in agreement the observed and predicted oxygen isotopic ratio, but the discrepancy for the [〈s〉/M] ratio would remain.
MSB 75: This carbon star (NGC 7789) is probably the most interesting object in the sample, as its progenitor falls in the initial mass range where a kink in the IFMR was suggested by Marigo et al. (2022). Our estimated Mini∼1.75±0.25 M⊙ is within this range. This star, together with the C-star BM IV 90 (NGC 2660 with a similar age that NGC 7789), which unfortunately we could not observe, are two of the objects for which Marigo et al. (2022) derived a luminosity higher than the expected for their estimated initial mass (∼1.90 M⊙, see their Table 5). As a consequence, they derived a core mass (∼0.7 M⊙) larger than usual for stars with this initial mass. This result led Marigo et al. (2022) to support the existence of a kink in the IMFR as inferred from the observations of white dwarfs in these two clusters (Cummings et al. 2018). Our estimated MAGB and Mini values for MSB 75 agree with those derived by Marigo et al. (2022), but our luminosity for this star is considerably fainter (Mbol=−5.0 versus −5.4 mag), and so the corresponding core mass. The chemical pattern and luminosity (both observational and theoretical) derived here for this object are compatible with this star being a normal C-star with a final core mass (∼0.63 M⊙); however, they are smaller than the values found by Cummings et al. (2018) in some white dwarfs belonging to NGC 7789.
Finally, HD 11800 and BD +60 2534: The stellar parameters and luminosities of these stars, which belong to NGC 743 and NGC 7654, respectively, are very similar. These values and their chemical patterns (see Table 3) suggest that these stars are not very evolved. Their position in the Gaia-2MASS diagram (Fig. 7) would be compatible with them being at the early AGB (e-AGB) or near the tip of the RGB. The oxygen isotopic ratio of both is compatible with an intermediate mass. We estimate Mini = 5±1 M⊙, which is consistent with the young ages of NGC 743 and NGC 7654 (see Tables 4 and 5).
To conclude, we constructed an IFMR with the stars analysed. To do so, we estimated the final core mass (Mfinal) as that of the core at the very end of the AGB phase according to the FUNS code for the Mstar estimated for each star. As reported in the 9th column of Table 5, the final core mass is typically between 0.6−0.9 M⊙. Note that within the Mstar range where the kink in the IFMR could exist, the final mass is only slightly larger than the core mass shown in the 7th column of Table 5 (a maximum difference of only ∼+0.04 M⊙). The result is shown in Figure 8, where we have drawn the final mass (Mfinal in Table 5) against the turn-off mass (Mto in Table 5), which should be very close to the real initial mass of the stars in our sample. The red and blue circles correspond to C-stars and O-rich stars, respectively. Note that several stars in Table 5 are located at the same data point. The error bars show the range of possible Mto in Table 5, which fit the HR diagram of the host cluster. Note that this mass range is compatible with the Mstar value that fits the chemical pattern found for each star. The small grey circles show the IFMR derived from white dwarfs by Cummings et al. (2018). The dashed line is the IFMR suggested by Marigo et al. (2022) where the kink at Mini≈1.8 M⊙ is clearly seen, and the dash-dotted line is the best fit obtained by Hollands et al. (2024) from the analysis of the double white dwarf binaries from Gaia DR3. It is clear from this figure that a discontinuity around Mini∼1.6−2.1 M⊙ is not seen based on our AGB stars: our analysis is compatible with a linear behaviour in this mass range and pretty much follows the behaviour of the IFMR obtained by Hollands et al. (2024). Note that the most metal-poor and less massive C-stars in Table 5 (Case 588 and C* 908) are located in Figure 8, slightly above the trend depicted in the study from Hollands et al. (2024). This is consistent with the observed and predicted figure that for a given Mini, the final core mass increases with decreasing metallicity (i.e. Weidemann 1987; Domínguez et al. 1999). Obviously, more observations are needed in the range Mini≈1−3 M⊙ to confirm this figure.
4. Summary
This study provides a detailed chemical analysis of the AGB star population in some Galactic open clusters, considering the new Gaia DR3 data. To our knowledge, this is the first time this study on abundances has been conducted. The 16 AGB candidates belong to open clusters with young and intermediate ages, and were selected because of their high cluster membership probability according to the analysis of the Gaia DR3 proper motions. The stars are of K, M, MS, S, and C spectral types, and some of them belong to open clusters with ages corresponding to initial masses around 1.6−2.1 M⊙ that could populate the possible kink in the semi-empirical IFMR suggested by Marigo et al. (2020, 2022).
By using very high-resolution spectroscopy in the visual and NIR spectral ranges we characterise the stars by deriving the average metallicity, the C/O ratio, the carbon, nitrogen, and oxygen isotopic ratios, and the Li and F abundances together with the average s-element abundance. Globally, the chemical features of these stars are found to be identical to those of other field O-rich or C-rich AGB stars with similar metallicity. Interestingly enough, most of the C-stars analysed have C/O ratios slightly larger than unity as predicted by Marigo et al. (2022), Addari et al. (2024) for the stars that may populate the suggested kink in the IFMR. However, this figure is a common feature in the overwhelming Galactic C-stars analysed to date; the cause of this observational fact is still under discussion.
On the other hand, we found a possible J-type carbon star (DH Mon) in the cluster Dias 2. Despite the high uncertainty in the age of this cluster, it may provide valuable information on the timescale involved in the formation of J-type stars, whose origin is still unknown.
We have derived the luminosities of these stars using different approaches to estimated the distance and extinction (AV), all based on Gaia DR3 astrometry. We find that distance and extinction differ significantly between the methods used, mainly for objects at distances larger than about ∼3000 pc. Interestingly, this distance value coincides with the named Gaia sphere, beyond which the uncertainty in the Gaia DR3 parallax increases significantly. In any case, the luminosities derived according to geometric distances from Bailer-Jones et al. (2021) using extinctions from the Galactic model by Lallement et al. (2022), agree very well for most of the stars (within the uncertainty) with the ones derived at the AGB phase from the FUNS evolutionary code for which we are able to match the chemical pattern observed in the stars. This leads to an estimate of the initial mass of the stars, which is found to be in the range of Mstar≈1.3−5.0 M⊙. These masses are compatible with the turn-off mass estimated from fits to the HR diagram of the corresponding cluster, also using the FUNS code. Finally, we estimated the final core mass (Mfinal) of each star at the very end of the AGB and built a semi-empirical IFMR. Note that the final core masses are just slightly larger than the corresponding estimated actual core masses of the observed stars. Our IFMR obviously follows the theoretical monotonic increasing behaviour predicted by the FUNS code (Cristallo et al. 2011) in the mass range mentioned above, which is also the usual pattern obtained from white dwarf observations. The deduced behaviour does not show a non-linearity in the mass range where the kink in the IFMR has been suggested. This monotonic behaviour is in agreement with the usual IFMR deduced from white dwarfs in open clusters and in field binary systems (Weidemann 1987, 2000; Catalán et al. 2008; Kalirai et al. 2008; Andrews et al. 2015; El-Badry et al. 2018), as well as the recent studies based on Gaia DR3 by Cunningham et al. (2024) and Hollands et al. (2024).
We conclude that the main reason for which the study by Marigo et al. (2022) supported the idea of a possible kink in the IFMR was the method used to determine the distances of the AGB stars analysed: purely the inverse of the parallax, which led them to derive higher than expected luminosities in the AGB stars belonging to open clusters with turn-off masses in the range of 1.6−2.1 M⊙, and thus larger core masses (∼0.7 M⊙). Clearly, more accurate distances and stellar statistics in open clusters (in both white dwarfs and AGB stars) are needed to elucidate whether the kink in the IFMR would exist. Certainly, Gaia DR4 will be a strong step forward in this sense, as it is expected to significantly reduce the uncertainty (<10%) in the parallax for objects with G<14 mag.
Acknowledgments
We dedicate this study to the memory of our friend Paola Marigo who inspired it. Part of this work was supported by the Spanish project PID2021-123110NB-I00 financed by MICIU/AEI/10.13039/501100011033 and by FEDER, una manera de hacer Europa, UE. MRG acknowledges the support by the Spanish MICIN/AEI/10.13039/501100011033 and by “ERDF A way of making Europe” by the European Union through grant PID2021-122842OB-C21, and the Institute of Cosmos Sciences University of Barcelona (ICCUB, Unidad de Excelencia María de Maeztu) through grant CEX2019-000918-M. The authors are grateful for the Vizier service, which we accessed for numerous purposes during this study. This research used the SIMBAD database, operated at CDS, Strasbourg, France. This study also used data from the European Space Agency (ESA) Gaia mission (https://www.cosmos.esa.int/gaia), processed by the Gaia Data Processing and Analysis Consortium (DPAC, https://www.cosmos.esa.int/web/gaia/dpac/consortium). Funding for the DPAC was provided by national institutions, in particular the institutions participating in the Gaia Multilateral Agreement. This article is based in part on observations made in the Observatorios de Canarias del IAC with the TNG operated on the island of La Palma by the INAF in the Observatorio del Roque de los Muchachos. Based in part on observations collected at Centro Astronómico Hispano en Andalucía (CAHA) at Calar Alto, proposal 22B-3.5-005, operated jointly by Junta de Andalucía and Consejo Superior de Investigaciones Científicas (IAA-CSIC). The authors thank the referee and Leo Girardi for their valuable comments and suggestions that improved the understanding of this study.
IRAF is distributed by the National Optical Astronomy Observatory, which is operated by the Association of Universities for Research in Astronomy (AURA) under cooperative agreement with the National Science Foundation.
We remind that Cantat-Gaudin & Anders (2020) is based on Gaia DR2 astrometry.
It is beyond the scope of this work to discuss the reasons for these differences. We refer to Cavallo et al. (2024) for a detailed discussion of this.
We adopt the usual notation [X/Y] ≡ log (X/Y)★ − log (X/Y)⊙ for the stellar value of any abundance ratio X/Y (by number).
Note that this star has a Gaia DR3 fidelity flag < 0.5.
The PARSEC and COLIBRI codes do not include a nucleosynthesis network large enough to predict the abundances of fluorine and/or s-process elements, which are also derived in this work.
References
- Abia, C., & Isern, J. 2000, ApJ, 536, 438 [NASA ADS] [CrossRef] [Google Scholar]
- Abia, C., Boffin, H. M. J., Isern, J., & Rebolo, R. 1993, A&A, 272, 455 [NASA ADS] [Google Scholar]
- Abia, C., Domínguez, I., Gallino, R., et al. 2002, ApJ, 579, 817 [NASA ADS] [CrossRef] [Google Scholar]
- Abia, C., Domínguez, I., Gallino, R., et al. 2003, PASA, 20, 314 [CrossRef] [Google Scholar]
- Abia, C., de Laverny, P., & Wahlin, R. 2008, A&A, 481, 161 [NASA ADS] [CrossRef] [EDP Sciences] [Google Scholar]
- Abia, C., Recio-Blanco, A., de Laverny, P., et al. 2009, ApJ, 694, 971 [NASA ADS] [CrossRef] [Google Scholar]
- Abia, C., Cunha, K., Cristallo, S., & de Laverny, P. 2015, A&A, 581, A88 [NASA ADS] [CrossRef] [EDP Sciences] [Google Scholar]
- Abia, C., Hedrosa, R. P., Domínguez, I., & Straniero, O. 2017a, A&A, 599, A39 [NASA ADS] [CrossRef] [EDP Sciences] [Google Scholar]
- Abia, C., Straniero, O., & Ventura, P. 2017b, Mem. Soc. Astron. Ital., 88, 360 [Google Scholar]
- Abia, C., de Laverny, P., Romero-Gómez, M., & Figueras, F. 2022, A&A, 664, A45 [NASA ADS] [CrossRef] [EDP Sciences] [Google Scholar]
- Addari, F., Marigo, P., Bressan, A., et al. 2024, ApJ, 964, 51 [NASA ADS] [CrossRef] [Google Scholar]
- Andrews, J. J., Agüeros, M. A., Gianninas, A., et al. 2015, ApJ, 815, 63 [NASA ADS] [CrossRef] [Google Scholar]
- Bailer-Jones, C. A. L., Rybizki, J., Fouesneau, M., Demleitner, M., & Andrae, R. 2021, AJ, 161, 147 [Google Scholar]
- Bladh, S., Eriksson, K., Marigo, P., Liljegren, S., & Aringer, B. 2019a, A&A, 623, A119 [NASA ADS] [CrossRef] [EDP Sciences] [Google Scholar]
- Bladh, S., Liljegren, S., Höfner, S., Aringer, B., & Marigo, P. 2019b, A&A, 626, A100 [NASA ADS] [CrossRef] [EDP Sciences] [Google Scholar]
- Boothroyd, A. I., & Sackmann, I. J. 1988, ApJ, 328, 641 [Google Scholar]
- Bragaglia, A., D’Orazi, V., Magrini, L., et al. 2024, A&A, 687, A124 [NASA ADS] [CrossRef] [EDP Sciences] [Google Scholar]
- Bressan, A., Marigo, P., Girardi, L., et al. 2012, MNRAS, 427, 127 [NASA ADS] [CrossRef] [Google Scholar]
- Brown, J. A., Sneden, C., Lambert, D. L., & Dutchover, E. 1989, ApJS, 71, 293 [NASA ADS] [CrossRef] [Google Scholar]
- Busso, M., Gallino, R., & Wasserburg, G. J. 1999, ARA&A, 37, 239 [Google Scholar]
- Busso, M., Palmerini, S., Maiorca, E., et al. 2010, ApJ, 717, L47 [Google Scholar]
- Cantat-Gaudin, T., & Anders, F. 2020, A&A, 633, A99 [NASA ADS] [CrossRef] [EDP Sciences] [Google Scholar]
- Cantat-Gaudin, T., Anders, F., Castro-Ginard, A., et al. 2020, A&A, 640, A1 [NASA ADS] [CrossRef] [EDP Sciences] [Google Scholar]
- Canto Martins, B. L., Lèbre, A., Palacios, A., et al. 2011, A&A, 527, A94 [NASA ADS] [CrossRef] [EDP Sciences] [Google Scholar]
- Canton, P. 2018, PhD Thesis, University of Oklahoma, Norman, USA [Google Scholar]
- Cardelli, J. A., Clayton, G. C., & Mathis, J. S. 1989, ApJ, 345, 245 [Google Scholar]
- Carrera, R. 2012, A&A, 544, A109 [NASA ADS] [CrossRef] [EDP Sciences] [Google Scholar]
- Casagrande, L., & VandenBerg, D. A. 2018, MNRAS, 479, L102 [NASA ADS] [CrossRef] [Google Scholar]
- Casagrande, L., Lin, J., Rains, A. D., et al. 2021, MNRAS, 507, 2684 [NASA ADS] [CrossRef] [Google Scholar]
- Catalán, S., Isern, J., García-Berro, E., & Ribas, I. 2008, MNRAS, 387, 1693 [Google Scholar]
- Cavallo, L., Spina, L., Carraro, G., et al. 2024, AJ, 167, 12 [NASA ADS] [CrossRef] [Google Scholar]
- Chen, X., Wang, S., Deng, L., et al. 2020, ApJS, 249, 18 [NASA ADS] [CrossRef] [Google Scholar]
- Choplin, A., Siess, L., & Goriely, S. 2024, A&A, 691, L7 [NASA ADS] [CrossRef] [EDP Sciences] [Google Scholar]
- Contursi, G., de Laverny, P., Recio-Blanco, A., & Palicio, P. A. 2021, A&A, 654, A130 [NASA ADS] [CrossRef] [EDP Sciences] [Google Scholar]
- Costa, G., Girardi, L., Bressan, A., et al. 2019, A&A, 631, A128 [NASA ADS] [CrossRef] [EDP Sciences] [Google Scholar]
- Cristallo, S., Straniero, O., Gallino, R., et al. 2009, ApJ, 696, 797 [NASA ADS] [CrossRef] [Google Scholar]
- Cristallo, S., Piersanti, L., Straniero, O., et al. 2011, ApJS, 197, 17 [NASA ADS] [CrossRef] [Google Scholar]
- Cristallo, S., Straniero, O., Piersanti, L., & Gobrecht, D. 2015, ApJS, 219, 40 [Google Scholar]
- Cummings, J. D., Kalirai, J. S., Tremblay, P. E., Ramirez-Ruiz, E., & Choi, J. 2018, ApJ, 866, 21 [NASA ADS] [CrossRef] [Google Scholar]
- Cunha, K., Smith, V. V., Hasselquist, S., et al. 2017, ApJ, 844, 145 [Google Scholar]
- Cunningham, T., Tremblay, P. E., & O’Brien, W. M. 2024, MNRAS, 527, 3602 [Google Scholar]
- Davis, A. M. 2011, Proc. Natl. Acad. Sci., 108, 19142 [Google Scholar]
- de Laverny, P., Abia, C., Domínguez, I., et al. 2006, A&A, 446, 1107 [NASA ADS] [CrossRef] [EDP Sciences] [Google Scholar]
- Dias, W. S., Monteiro, H., Moitinho, A., et al. 2021, MNRAS, 504, 356 [NASA ADS] [CrossRef] [Google Scholar]
- Domínguez, I., Chieffi, A., Limongi, M., & Straniero, O. 1999, ApJ, 524, 226 [NASA ADS] [CrossRef] [Google Scholar]
- Dorda, R., González-Fernández, C., & Negueruela, I. 2016, A&A, 595, A105 [NASA ADS] [CrossRef] [EDP Sciences] [Google Scholar]
- Dorda, R., Negueruela, I., & González-Fernández, C. 2018, MNRAS, 475, 2003 [CrossRef] [Google Scholar]
- Eggleton, P. P. 1967, MNRAS, 135, 243 [Google Scholar]
- Eker, Z., & Bakış, V. 2023, MNRAS, 523, 2440 [NASA ADS] [CrossRef] [Google Scholar]
- El-Badry, K., Rix, H. -W., & Weisz, D. R. 2018, ApJ, 860, L17 [NASA ADS] [CrossRef] [Google Scholar]
- Eriksson, K., Nowotny, W., Höfner, S., Aringer, B., & Wachter, A. 2014, A&A, 566, A95 [NASA ADS] [CrossRef] [EDP Sciences] [Google Scholar]
- Frogel, J. A., Persson, S. E., & Cohen, J. G. 1980, ApJ, 239, 495 [NASA ADS] [CrossRef] [Google Scholar]
- Frogel, J. A., Mould, J., & Blanco, V. M. 1990, ApJ, 352, 96 [Google Scholar]
- Frost, C. A., & Lattanzio, J. C. 1996, ApJ, 473, 383 [NASA ADS] [CrossRef] [Google Scholar]
- Gaia Collaboration (Brown, A. G. A., et al.) 2018, A&A, 616, A1 [NASA ADS] [CrossRef] [EDP Sciences] [Google Scholar]
- Gaia Collaboration (Brown, A. G. A., et al.) 2021, A&A, 649, A1 [NASA ADS] [CrossRef] [EDP Sciences] [Google Scholar]
- García-Hernández, D. A., Zamora, O., Yagüe, A., et al. 2013, A&A, 555, L3 [NASA ADS] [CrossRef] [EDP Sciences] [Google Scholar]
- Gilroy, K. K. 1989, ApJ, 347, 835 [CrossRef] [Google Scholar]
- Girardi, L., Chiosi, C., Bertelli, G., & Bressan, A. 1995, A&A, 298, 87 [NASA ADS] [Google Scholar]
- Girardi, L., Groenewegen, M. A. T., Hatziminaoglou, E., & da Costa, L. 2005, A&A, 436, 895 [NASA ADS] [CrossRef] [EDP Sciences] [Google Scholar]
- Grevesse, N., Asplund, M., & Sauval, A. J. 2007, Space Sci. Rev., 130, 105 [Google Scholar]
- Groenewegen, M. A. T. 2021, A&A, 654, A20 [NASA ADS] [CrossRef] [EDP Sciences] [Google Scholar]
- Guerço, R., Smith, V. V., Cunha, K., et al. 2022, MNRAS, 516, 2801 [CrossRef] [Google Scholar]
- Gustafsson, B., Edvardsson, B., Eriksson, K., et al. 2008, A&A, 486, 951 [NASA ADS] [CrossRef] [EDP Sciences] [Google Scholar]
- Harris, M. J., Lambert, D. L., & Smith, V. V. 1988, ApJ, 325, 768 [Google Scholar]
- Hedrosa, R. P., Abia, C., Busso, M., et al. 2013, ApJ, 768, L11 [NASA ADS] [CrossRef] [Google Scholar]
- Hinkle, K. H., Lebzelter, T., & Straniero, O. 2016, ApJ, 825, 38 [NASA ADS] [CrossRef] [Google Scholar]
- Hollands, M. A., Littlefair, S. P., & Parsons, S. G. 2024, MNRAS, 527, 9061 [Google Scholar]
- Hunt, E. L., & Reffert, S. 2023, A&A, 673, A114 [NASA ADS] [CrossRef] [EDP Sciences] [Google Scholar]
- Hunt, E. L., & Reffert, S. 2024, A&A, 686, A42 [NASA ADS] [CrossRef] [EDP Sciences] [Google Scholar]
- Jordi, C., Gebran, M., Carrasco, J. M., et al. 2010, A&A, 523, A48 [NASA ADS] [CrossRef] [EDP Sciences] [Google Scholar]
- Kalirai, J. S., Hansen, B. M. S., Kelson, D. D., et al. 2008, ApJ, 676, 594 [NASA ADS] [CrossRef] [Google Scholar]
- Kalirai, J. S., Marigo, P., & Tremblay, P. -E. 2014, ApJ, 782, 17 [Google Scholar]
- Karakas, A. I. 2010, MNRAS, 403, 1413 [NASA ADS] [CrossRef] [Google Scholar]
- Karakas, A. I., & Lattanzio, J. C. 2014, PASA, 31, e030 [NASA ADS] [CrossRef] [Google Scholar]
- Kerschbaum, F., Lebzelter, T., & Mekul, L. 2010, A&A, 524, A87 [NASA ADS] [CrossRef] [EDP Sciences] [Google Scholar]
- Kharchenko, N. V., Piskunov, A. E., Schilbach, E., Röser, S., & Scholz, R. D. 2013, A&A, 558, A53 [NASA ADS] [CrossRef] [EDP Sciences] [Google Scholar]
- Lagarde, N., Minkevičiūtė, R., Drazdauskas, A., et al. 2024, A&A, 684, A70 [NASA ADS] [CrossRef] [EDP Sciences] [Google Scholar]
- Lallement, R., Vergely, J. L., Babusiaux, C., & Cox, N. L. J. 2022, A&A, 661, A147 [NASA ADS] [CrossRef] [EDP Sciences] [Google Scholar]
- Lambert, D. L., Dominy, J. F., & Sivertsen, S. 1980, ApJ, 235, 114 [NASA ADS] [CrossRef] [Google Scholar]
- Lambert, D. L., Gustafsson, B., Eriksson, K., & Hinkle, K. H. 1986, ApJS, 62, 373 [Google Scholar]
- Lattanzio, J. C. 2002, New Astron. Rev., 46, 469 [Google Scholar]
- Lebzelter, T., Lederer, M. T., Cristallo, S., et al. 2008, A&A, 486, 511 [NASA ADS] [CrossRef] [EDP Sciences] [Google Scholar]
- Lebzelter, T., Nowotny, W., Hinkle, K. H., Höfner, S., & Aringer, B. 2014, A&A, 567, A143 [NASA ADS] [CrossRef] [EDP Sciences] [Google Scholar]
- Lebzelter, T., Straniero, O., Hinkle, K. H., Nowotny, W., & Aringer, B. 2015, A&A, 578, A33 [NASA ADS] [CrossRef] [EDP Sciences] [Google Scholar]
- Lebzelter, T., Mowlavi, N., Marigo, P., et al. 2018, A&A, 616, L13 [NASA ADS] [CrossRef] [EDP Sciences] [Google Scholar]
- Lebzelter, T., Hinkle, K. H., Straniero, O., et al. 2019, ApJ, 886, 117 [NASA ADS] [CrossRef] [Google Scholar]
- Lederer, M. T., Lebzelter, T., Cristallo, S., et al. 2009, A&A, 502, 913 [NASA ADS] [CrossRef] [EDP Sciences] [Google Scholar]
- Limongi, M., Roberti, L., Chieffi, A., & Nomoto, K. 2024, ApJS, 270, 29 [NASA ADS] [CrossRef] [Google Scholar]
- Lodders, K., & Fegley, B. 1997, AIP Conf. Ser., 402, 391 [NASA ADS] [Google Scholar]
- Lucertini, F., Monaco, L., Caffau, E., et al. 2023, A&A, 671, A137 [NASA ADS] [CrossRef] [EDP Sciences] [Google Scholar]
- Luck, R. E. 1977, ApJ, 218, 752 [Google Scholar]
- Luck, R. E., & Lambert, D. L. 1982, ApJ, 256, 189 [Google Scholar]
- Maceroni, C., Testa, V., Plez, B., García Lario, P., & D’Antona, F. 2002, A&A, 395, 179 [NASA ADS] [CrossRef] [EDP Sciences] [Google Scholar]
- Maciejewski, G., Mihov, B., & Georgiev, T. 2009, Astron. Nachr., 330, 851 [Google Scholar]
- Mallik, S. V. 1999, A&A, 352, 495 [NASA ADS] [Google Scholar]
- Marigo, P., Bressan, A., Nanni, A., Girardi, L., & Pumo, M. L. 2013, MNRAS, 434, 488 [Google Scholar]
- Marigo, P., Girardi, L., Bressan, A., et al. 2017, ApJ, 835, 77 [Google Scholar]
- Marigo, P., Cummings, J. D., Curtis, J. L., et al. 2020, Nat. Astron., 4, 1102 [NASA ADS] [CrossRef] [Google Scholar]
- Marigo, P., Bossini, D., Trabucchi, M., et al. 2022, ApJS, 258, 43 [NASA ADS] [Google Scholar]
- Marshall, D. J., Robin, A. C., Reylé, C., Schultheis, M., & Picaud, S. 2006, A&A, 453, 635 [NASA ADS] [CrossRef] [EDP Sciences] [Google Scholar]
- Mattsson, L., Wahlin, R., & Höfner, S. 2010, A&A, 509, A14 [NASA ADS] [CrossRef] [EDP Sciences] [Google Scholar]
- McSaveney, J. A., Wood, P. R., Scholz, M., Lattanzio, J. C., & Hinkle, K. H. 2007, MNRAS, 378, 1089 [Google Scholar]
- Nagarajan, N., Sneden, C., Afşar, M., & Pilachowski, C. A. 2023, AJ, 165, 245 [NASA ADS] [CrossRef] [Google Scholar]
- Ohnaka, K., & Tsuji, T. 1996, A&A, 310, 933 [NASA ADS] [Google Scholar]
- Paczyński, B. 1970, Acta Astron., 20, 47 [NASA ADS] [Google Scholar]
- Palmerini, S., Cristallo, S., Busso, M., et al. 2011, ApJ, 741, 26 [NASA ADS] [CrossRef] [Google Scholar]
- Pandey, A. K., Nilakshi, O. K., Sagar, R., & Tarusawa, K. 2001, A&A, 374, 504 [NASA ADS] [CrossRef] [EDP Sciences] [Google Scholar]
- Pastorelli, G., Marigo, P., Girardi, L., et al. 2020, MNRAS, 498, 3283 [Google Scholar]
- Plez, B. 2012, Astrophysics Source Code Library, [record ascl:1205.004] [Google Scholar]
- Recio-Blanco, A., de Laverny, P., Kordopatis, G., et al. 2014, A&A, 567, A5 [NASA ADS] [CrossRef] [EDP Sciences] [Google Scholar]
- Recio-Blanco, A., de Laverny, P., Palicio, P. A., et al. 2023, A&A, 674, A29 [NASA ADS] [CrossRef] [EDP Sciences] [Google Scholar]
- Rybizki, J., Green, G. M., Rix, H. -W., et al. 2022, MNRAS, 510, 2597 [NASA ADS] [CrossRef] [Google Scholar]
- Salaris, M., Serenelli, A., Weiss, A., & Miller Bertolami, M. 2009, ApJ, 692, 1013 [NASA ADS] [CrossRef] [Google Scholar]
- Sales Silva, J. V., Carraro, G., Anthony-Twarog, B. J., et al. 2016, AJ, 151, 6 [Google Scholar]
- Schechter, P. L., Cook, K. H., Aaronson, M., & Blanco, V. M. 1987, BAAS, 19, 1069 [NASA ADS] [Google Scholar]
- Sengupta, S., Izzard, R. G., & Lau, H. H. B. 2013, A&A, 559, A66 [NASA ADS] [CrossRef] [EDP Sciences] [Google Scholar]
- Shetrone, M. D., Sneden, C., & Pilachowski, C. A. 1993, PASP, 105, 337 [Google Scholar]
- Shetye, S., Van Eck, S., Jorissen, A., et al. 2018, A&A, 620, A148 [NASA ADS] [CrossRef] [EDP Sciences] [Google Scholar]
- Smith, V. V., & Lambert, D. L. 1990, ApJS, 72, 387 [NASA ADS] [CrossRef] [Google Scholar]
- Soszyński, I., Gieren, W., & Pietrzyński, G. 2005, PASP, 117, 823 [Google Scholar]
- Straniero, O., Bruno, C. G., Aliotta, M., et al. 2017, A&A, 598, A128 [CrossRef] [EDP Sciences] [Google Scholar]
- Straniero, O., Piersanti, L., Dominguez, I., & Tumino, A. 2019, Nuclei in the Cosmos XV, 219, 7 [Google Scholar]
- Straniero, O., Abia, C., & Domínguez, I. 2023, Eur. Phys. J. A, 59, 17 [NASA ADS] [CrossRef] [Google Scholar]
- Van Eck, S., Neyskens, P., Jorissen, A., et al. 2017, A&A, 601, A10 [NASA ADS] [CrossRef] [EDP Sciences] [Google Scholar]
- Ventura, P., & D’Antona, F. 2005, A&A, 439, 1075 [NASA ADS] [CrossRef] [EDP Sciences] [Google Scholar]
- Ventura, P., Karakas, A. I., Dell’Agli, F., et al. 2015, MNRAS, 450, 3181 [NASA ADS] [CrossRef] [Google Scholar]
- Wallerstein, G., & Knapp, G. R. 1998, ARA&A, 36, 369 [NASA ADS] [CrossRef] [Google Scholar]
- Weidemann, V. 1987, A&A, 188, 74 [NASA ADS] [Google Scholar]
- Weidemann, V. 2000, A&A, 363, 647 [NASA ADS] [Google Scholar]
- Zhang, X., & Jeffery, C. S. 2013, MNRAS, 430, 2113 [NASA ADS] [CrossRef] [Google Scholar]
All Tables
Absolute Ks and bolometric magnitudes of the stars derived using distances and extinctions from different cases.
Stellar parameters predicted by the FUNS code and from the HR diagram analysis of the OCs for the stars in the sample.
All Figures
|
Fig. 1. Distance difference between Hunt & Reffert (2023) and Cavallo et al. (2024) to the corresponding open cluster versus distances from the former authors. The colour code (right) shows the difference between the extinction values according to the mentioned authors. Note the significant differences in both distances and AV values in open clusters at distance ≳3 kpc. |
| In the text | |
|
Fig. 2. Same as Figure 1 but comparing the distance difference between the geometric DR3 distances to individual stars according to Bailer-Jones et al. (2021), and those measured by Hunt & Reffert (2023) to the corresponding open cluster versus distance from the former authors. The colour code (right) shows the difference between the extinction values of individual stars according to Lallement et al. (2022) using the geometric distances, and those estimated by Hunt & Reffert (2023). The discrepancy in both distance and AV values for stars/clusters at distance ≳3 kpc is significant. |
| In the text | |
|
Fig. 3. Same as Fig. 2, but comparing distance and extinction values according to Cavallo et al. (2024) instead of Hunt & Reffert (2023). Note again the large differences among stars at distance ≳3 kpc. |
| In the text | |
|
Fig. 4. Comparison of observed (solid black circles) and synthetic spectra for the K-type star HD 11800 (best fit, red line) in the region of the Ca II triplet (the λ∼8498 and λ∼8542 Å Ca II lines are shown). Note that the cores of these lines are not well reproduced. Some metallic lines used to determine the metallicity of the sample stars are indicated (see text). This star belongs to the very young open cluster NGC 743 (see Table 2). |
| In the text | |
|
Fig. 5. Comparison of observed (solid black circles) and synthetic spectra (lines) for two stars in the sample in the region of some Zr I lines used in abundance analysis. Top panel: O-rich star 2MASS J20560894+5059071 (Berkeley 53). Dashed blue lines: no-Zr and [Zr/M] = 0.0; red continuous line [Zr/M] = +0.5. Bottom panel: Same as for the carbon star IRAS 19582+2967 (FSR 172). Dashed blue lines: no-Zr and [Zr/M] = 0.0; red continuous line [Zr/M] = +0.6. Note the difference in the observed spectrum in this spectral region between an O-rich and a C-rich star; the former star is dominated by TiO and atomic absorptions, whereas the C-star is dominated by CN lines. |
| In the text | |
|
Fig. 6. Comparison between the observed (solid back circles) and synthetic spectra (lines) of the C-star Case 588 (belonging to the cluster Dias 2) in the APOGEE region. In this spectral region, some Ce II lines identified by Cunha et al. (2017) were used for abundance analysis. Dashed blue lines: no Ce and, [Ce/M] = 0.0; Solid red line: [Ce/M] = +1.2, best fit. |
| In the text | |
|
Fig. 7. Gaia-2MASS diagram for our sample stars. The curved solid line delineates the theoretical limit between the O-rich (cyan symbols) and AGB C-stars (red symbols). Dashed lines separate the sub-groups of stars, as indicated in the figure. The circles correspond to |
| In the text | |
|
Fig. 8. The Semi-empirical IFMR obtained using the stars in this study. The red and cyan circles are our C-stars and O-rich, respectively. Note that several stars in Table 5 correspond to the same data point. Grey points are white dwarfs from Cummings et al. (2018). The 4-piece linear fit (long-dashed line) draws the kink around Mini∼1.6−2.1 M⊙ suggested by Marigo et al. (2020, 2022). The dash-dotted line is the best fit obtained by Hollands et al. (2024) from the analysis of the double white dwarf binaries from Gaia DR3, focusing on the range Mini = 1−5 M⊙. |
| In the text | |
Current usage metrics show cumulative count of Article Views (full-text article views including HTML views, PDF and ePub downloads, according to the available data) and Abstracts Views on Vision4Press platform.
Data correspond to usage on the plateform after 2015. The current usage metrics is available 48-96 hours after online publication and is updated daily on week days.
Initial download of the metrics may take a while.