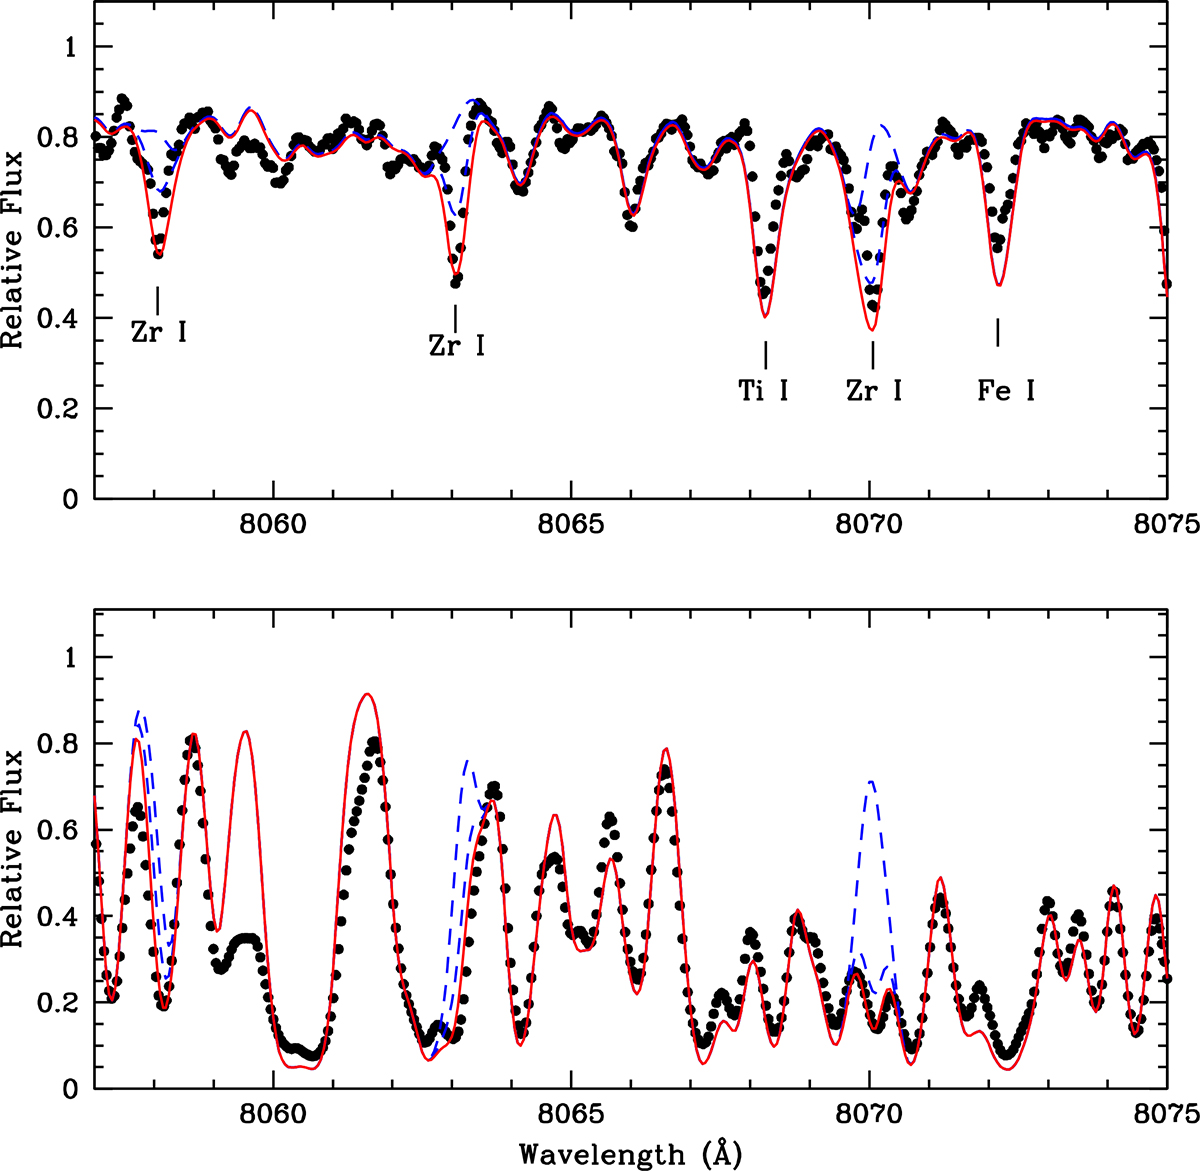
Fig. 5.
Download original image
Comparison of observed (solid black circles) and synthetic spectra (lines) for two stars in the sample in the region of some Zr I lines used in abundance analysis. Top panel: O-rich star 2MASS J20560894+5059071 (Berkeley 53). Dashed blue lines: no-Zr and [Zr/M] = 0.0; red continuous line [Zr/M] = +0.5. Bottom panel: Same as for the carbon star IRAS 19582+2967 (FSR 172). Dashed blue lines: no-Zr and [Zr/M] = 0.0; red continuous line [Zr/M] = +0.6. Note the difference in the observed spectrum in this spectral region between an O-rich and a C-rich star; the former star is dominated by TiO and atomic absorptions, whereas the C-star is dominated by CN lines.
Current usage metrics show cumulative count of Article Views (full-text article views including HTML views, PDF and ePub downloads, according to the available data) and Abstracts Views on Vision4Press platform.
Data correspond to usage on the plateform after 2015. The current usage metrics is available 48-96 hours after online publication and is updated daily on week days.
Initial download of the metrics may take a while.