Fig. 7.
Download original image
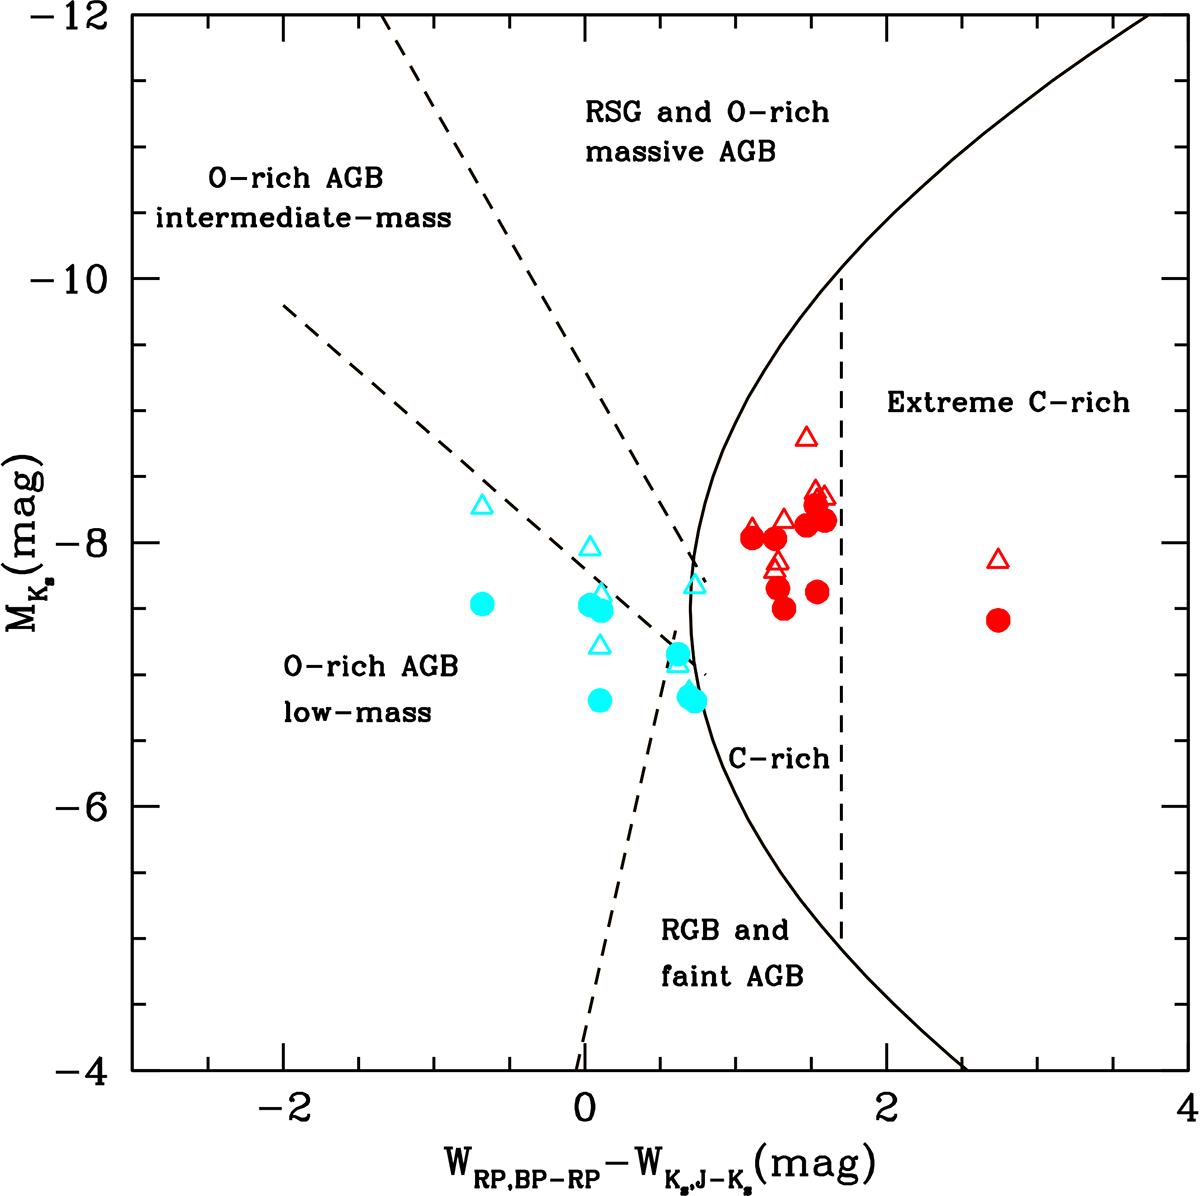
Gaia-2MASS diagram for our sample stars. The curved solid line delineates the theoretical limit between the O-rich (cyan symbols) and AGB C-stars (red symbols). Dashed lines separate the sub-groups of stars, as indicated in the figure. The circles correspond to ![]() magnitudes derived using phot-geometric DR3 distances from Bailer-Jones et al. (2021) and extinction from Lallement et al. (2022). For comparison, open triangles show the same but using distances and extinction values from Hunt & Reffert (2023). The uncertainty in
magnitudes derived using phot-geometric DR3 distances from Bailer-Jones et al. (2021) and extinction from Lallement et al. (2022). For comparison, open triangles show the same but using distances and extinction values from Hunt & Reffert (2023). The uncertainty in ![]() is typically ±0.28 mag.
is typically ±0.28 mag.
Current usage metrics show cumulative count of Article Views (full-text article views including HTML views, PDF and ePub downloads, according to the available data) and Abstracts Views on Vision4Press platform.
Data correspond to usage on the plateform after 2015. The current usage metrics is available 48-96 hours after online publication and is updated daily on week days.
Initial download of the metrics may take a while.