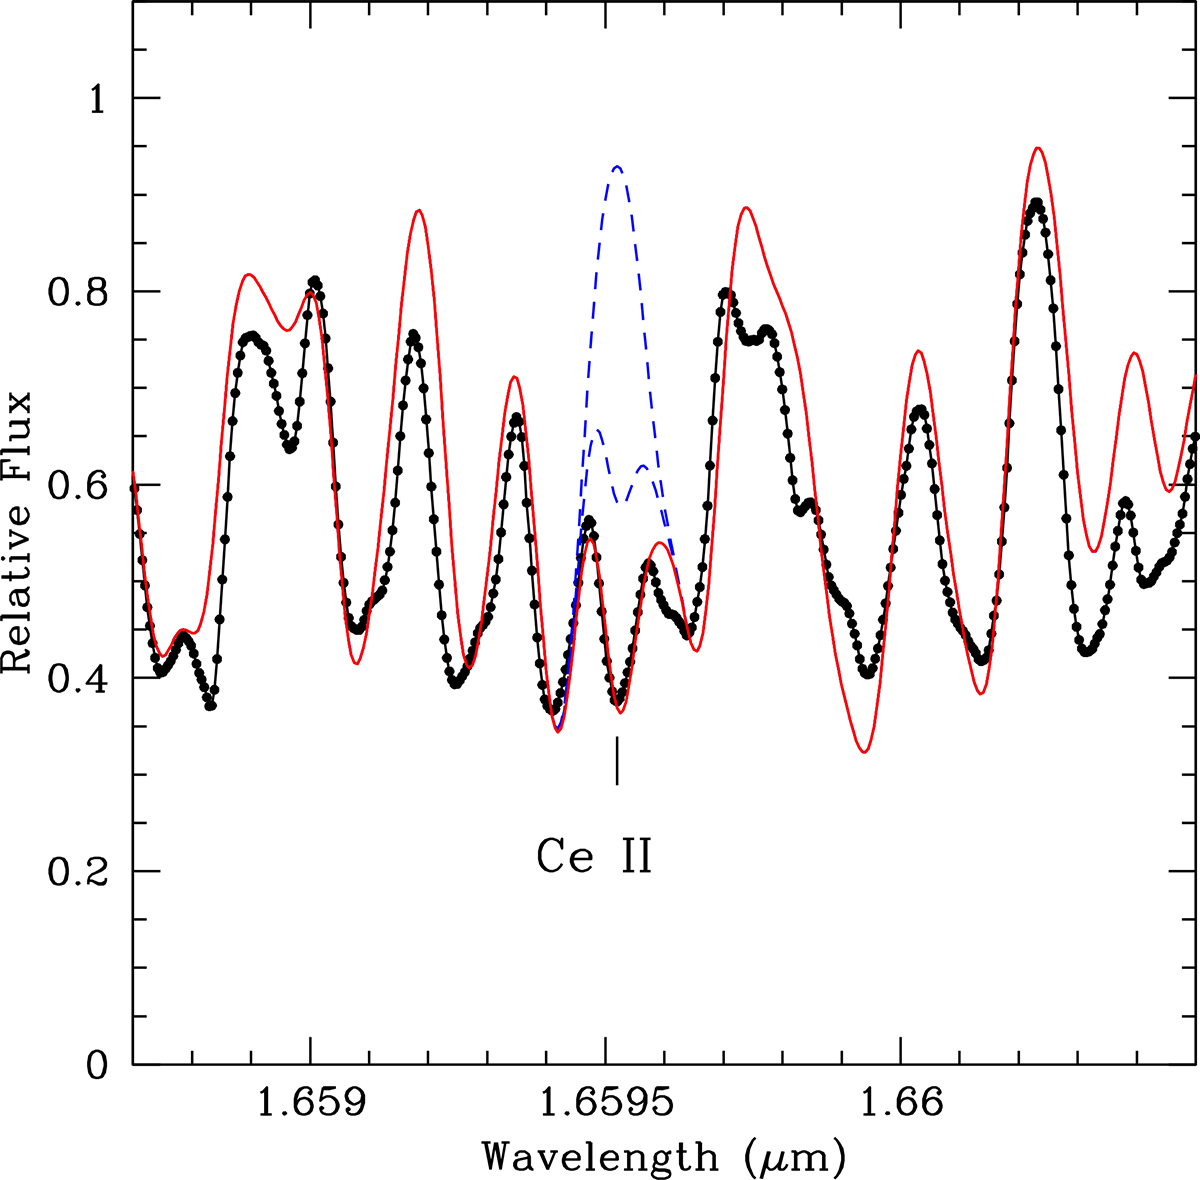
Fig. 6.
Download original image
Comparison between the observed (solid back circles) and synthetic spectra (lines) of the C-star Case 588 (belonging to the cluster Dias 2) in the APOGEE region. In this spectral region, some Ce II lines identified by Cunha et al. (2017) were used for abundance analysis. Dashed blue lines: no Ce and, [Ce/M] = 0.0; Solid red line: [Ce/M] = +1.2, best fit.
Current usage metrics show cumulative count of Article Views (full-text article views including HTML views, PDF and ePub downloads, according to the available data) and Abstracts Views on Vision4Press platform.
Data correspond to usage on the plateform after 2015. The current usage metrics is available 48-96 hours after online publication and is updated daily on week days.
Initial download of the metrics may take a while.