| Issue |
A&A
Volume 699, July 2025
|
|
|---|---|---|
| Article Number | A376 | |
| Number of page(s) | 12 | |
| Section | Extragalactic astronomy | |
| DOI | https://doi.org/10.1051/0004-6361/202554509 | |
| Published online | 25 July 2025 | |
The formation and evolution of supermassive disks in IllustrisTNG
1
Departamento de Física, Universidad Técnica Federico Santa María, Avenida España 1680, Valparaíso, Chile
2
Instituto de Astrofísica, Pontificia Universidad Católica de Chile, Avenida Vicuña Mackenna 4860, 7820436, Macul, Santiago, Chile
3
Millenium Nucleus ERIS, Chile
4
Centro de Astro-Ingeniería, Pontificia Universidad Católica de Chile, Av. Vicuña Mackenna 4860, Santiago, Chile
5
Departamento de Astronomía, Universidad de La Serena, Av. Raúl Bitrán 1305, La Serena, Chile
6
Instituto de Física, Pontificia Universidad Católica de Valparaíso, Casilla 4059, Valparaíso, Chile
⋆ Corresponding author: This email address is being protected from spambots. You need JavaScript enabled to view it.
Received:
13
March
2025
Accepted:
28
June
2025
Abstract
Context. Supermassive disks are outstanding galaxies whose formation and evolution are still poorly understood. They comprise a large variety of objects, from large low-surface brightness galaxies such as Malin-1 to the most spectacular superluminous spirals. However, we still do not know the physical mechanisms behind their formation, whether they will be long-lived objects, or whether their mass could destroy them in time.
Aims. We investigated the formation and evolution of supermassive disks in the magnetohydrodynamic state-of-the-art simulation IllustrisTNG-100. We aim to characterize the main formation mechanisms behind these galaxies and to understand the role played by the environment in their formation.
Methods. Supermassive disks were identified using morpho-kinematic criteria based on a relation between the spin-parameter (λR) and its ellipticity (ɛ) with two different thresholds. We defined supermassive disks as galaxies with λ/√ɛ ≥ 0.31 or 0.71, and with stellar mass log10M⋆/M⊙>1011. We studied their colors, merging histories, active galactic nucleus histories, and environments. Additionally, we studied galaxies individually to check how they formed.
Results. Supermassive disk galaxies typically have a quiescent merging history, with 48% experiencing no significant mergers at z≤1. Their stellar mass growth is driven mainly by star formation, unlike spheroidal galaxies, which require a significant number of mergers to form. Moreover, the mergers experienced by disk galaxies are generally rich in gas, irrespective of whether they are minor or major events. Supermassive disks exist across various environments, from in isolation to in clusters, with ∼60% in isolation or low-mass groups, ∼25% in massive groups, and ∼15% within galaxy clusters. When studying the evolution of supermassive disks at z = 0.5, we show that when they gain sufficient mass, the probability of them maintaining their disk-like structure up to z = 0 is relatively high (∼60%). Lastly, while active galactic nuclei significantly influence the regulation of star formation in galaxies, they do not directly alter their morphological structures.
Key words: methods: numerical / galaxies: evolution / galaxies: formation / galaxies: interactions / galaxies: kinematics and dynamics / galaxies: spiral
© The Authors 2025
 Open Access article, published by EDP Sciences, under the terms of the Creative Commons Attribution License (https://creativecommons.org/licenses/by/4.0), which permits unrestricted use, distribution, and reproduction in any medium, provided the original work is properly cited.
This article is published in open access under the Subscribe to Open model. This email address is being protected from spambots. You need JavaScript enabled to view it. to support open access publication.
1. Introduction
Galaxies in the Universe can take various shapes and forms. Since the first half of the 20th century, classification schemes have been developed to organize them by their morphology, the most famous being the Hubble sequence (Hubble 1926).
Nowadays, it is well understood that morphology is closely related to some more fundamental properties of galaxies. Elliptical (early-type) galaxies tend to exhibit lower star formation rates (SFRs), an older population, and, consequently, redder colors. On the other hand, spiral (late-type) galaxies have higher SFRs and a population dominated by young stars and, consequently, show bluer colors (Morgan & Mayall 1957; Gómez et al. 2003; Kauffmann et al. 2004; Blanton & Moustakas 2009).
A fundamental pending question is how the morphology of galaxies evolves in the transition zone between late- and early-type galaxies. This transition zone has been called the “green valley” given the vast and relatively flat shape of the region occupied by galaxies in the color-magnitude diagram (Wyder et al. 2007; Schiminovich et al. 2007; Martin et al. 2007). Morphological transformations are likely to occur throughout a galaxy's history. Early observations of the Universe have indicated a prevalence of luminous disk-like galaxies (Kolesnikov et al. 2024). Later on, with the arrival of deep observations, it was established that most nearby dwarf galaxies are spheroidal (Bernardi et al. 2003; Wuyts et al. 2011; Conselice et al. 2014; Shibuya et al. 2015). Given the hierarchical paradigm of structure formation (White & Rees 1978), these transformations in morphology from rotationally supported disks to dispersion-dominated spheroids are widely explained by galaxy mergers (Toomre & Toomre 1972; Barnes 1992; Bournaud et al. 2007; Martin et al. 2018; Montaguth et al. 2023, 2025). This process becomes crucial toward the high-mass end of the galaxy mass function (Faber et al. 2007; McIntosh et al. 2008; Cattaneo et al. 2011; Kaviraj et al. 2017). After the knee of the galaxy mass function (log10M⋆≥10.8[M⊙]), mergers are thought to be needed for galaxies to achieve such high stellar masses. In this sense, spheroidal galaxies are expected to dominate the high-mass regime.
Within this context, Quilley & de Lapparent (2022) revisited the relation between morphology and color using the extensive morphological classification from the EFIGI (“Extraction de Formes Idéalisées de Galaxies en Imagerie”) galaxies (de Lapparent et al. 2011), a subsample of the MorCat (“Morphology Catalogue”) from the Sloan Digital Sky Survey (SDSS) Data Release 8 (DR8; Aihara et al. 2011). Quilley & de Lapparent (2022) propose that the Hubble sequence can be understood as an inverse sequence of galaxy evolution. In this sense, internal dynamical processes, such as the dominant presence of bars and strong flocculent arms in high-mass galaxies, suggest that the internal dynamics of massive disk galaxies, likely triggered by fly-by encounters or minor mergers, can lead to bulge growth in the green valley. This systematic bulge growth across the green valley highlights the region's transitional nature and allows us to rule out the possibility of a predominantly quick transit due to rapid quenching. However, it is worth noting that this result may change when considering the environment in which galaxies reside (e.g., Pallero et al. 2022).
A key result highlighted in Quilley & de Lapparent (2022) is the lack of massive disks compared to elliptical galaxies. Specifically, they did not find disks more massive than log10M⋆≥11.8[M⊙], proposing this as an upper limit. These results are in agreement with what was found by Cappellari (2016), who find a critical mass of log10M⋆>11.3[M⊙] as the dividing line between fast (disks) and slow (spheroids) rotators. This result was also explored in Jackson et al. (2020) using galaxies from the Horizon-AGN cosmological hydrodynamical simulation (Dubois et al. 2013). They find two main formation mechanisms for massive disks (log10M⋆>11.4[M⊙]): a rejuvenation scenario and a quiescent merging history. The primary one is the rejuvenation scenario, which accounts for 70% of their sample of massive disks. In this case, spheroidal galaxies experience a significant gas-rich merger (mass ratio ≥ 1:10), recreating the disk from a rotationally supported galaxy. Mergers create a new rotational stellar component, leaving a massive disk. The secondary channel accounts for the remaining 30% of their sample. These galaxies experience a quiescent merger history and have a disk morphology throughout their history. It should be noted that the fraction of massive disks that these authors find accounts for ∼11% of massive galaxies within their simulations. Later on, Jackson et al. (2022) found a similar fraction of massive disks in a sample of observed galaxies from the SDSS using the MPA-JHU Value-Added Catalogue1. Although significant efforts have been made to study these types of objects, supermassive disks remain scarce, with fewer than 200 objects detected to date (Ogle et al. 2019; Jackson et al. 2022). We expect this knowledge gap to be filled by next-generation wide-field surveys such as Euclid (Laureijs et al. 2011) and the Vera C. Rubin Observatory's Legacy Survey of Space and Time (LSST; Ivezić et al. 2019).
In this work we revisit the formation mechanisms of extremely massive disk galaxies with the state-of-the-art IllustrisTNG simulations. We investigate the likelihood of these galaxies forming and the various formation mechanisms behind the formation of massive disks, and we aim to understand whether these massive disks are long-lived structures or merely a transitional phase during the transformation from disks to spheroids.
The article is organized as follows. In Sect. 2 we summarize the relevant aspects of IllustrisTNG. We define our galaxy sample and the procedures performed to measure the morpho-kinematical properties of galaxies. In Sect. 3 we show the disk fraction in the galaxy-mass function and the positions that massive disks occupy in the color-mass diagram, providing crucial insights into the formation of these galaxies. We also quantify the significance of mergers in building up the stellar components of massive disks. In Sect. 4 we investigate whether massive disks are long-lived structures and the different environments in which they can exist, shedding light on the longevity and diversity of galaxies. In addition, we compare the formation mechanisms identified in this work with those previously reported in the literature, thereby further enhancing our understanding of galaxy evolution and its implications for future research. Finally, in Sect. 5 we summarize our results and conclusions.
2. Data
2.1. IllustrisTNG
IllustrisTNG (The Next Generation, TNG hereafter; Marinacci et al. 2018; Naiman et al. 2018; Nelson et al. 2018; Pillepich et al. 2018a; Springel et al. 2018)2 is the natural successor of the Illustris3 project (Genel et al. 2014; Vogelsberger et al. 2014a, b; Nelson et al. 2015; Sijacki et al. 2015). It corresponds to a suite of magnetohydrodynamic simulations with a comprehensive galaxy formation model, which includes prescriptions for star formation, stellar evolution, chemical enrichment, stellar feedback, galactic outflows, black-hole formation, active galactic nucleus (AGN) feedback and metal cooling (see Pillepich et al. 2018b, for a detailed description).
This suite offers three different simulation volumes for TNG50, TNG100, and TNG300, with cosmological volumes of (51.7 cMpc)3, (106.5 cMpc)3, and (302.6 cMpc)3, respectively. This work will only use the TNG100, the intermediate resolution and size simulation. This simulation presents the best compromise between a large and representative sample of different galaxies and environments. It reaches the high-mass end of the mass function with a good sample of galaxies while maintaining an excellent resolution to measure the kinematics and morphology. For this simulation, the mean baryonic particle resolution is mbar∼1.4×10⁶ M⊙ (gas and stars) while having a dark matter particle resolution of mDM∼7.5×10⁶ M⊙.
The simulations were performed using the AREPO code (Springel 2010), a gravitational solver for Poisson's equations, using a tree-particle-mesh algorithm. Additionally, it solves equations for magnetohydrodynamics using a Voronoi tessellation method within the simulation domain (Pakmor et al. 2011). All simulations start at z = 127 and adopt a flat Λ cold dark matter cosmology, whose parameters were calibrated with the data obtained by the Planck mission (Planck Collaboration XIII 2016): Energy density ΩΛ = 0.6911, matter density Ωm = 0.3089, baryonic density Ωb = 0.0486, a Hubble constant H0 = 100 h km s−1Mpc−1 with h = 0.6774, a σ8 = 0.8159 and a spectral index ns = 0.9667.
Several observable have been tested within the simulation and show remarkable agreement with observations, such as the color bimodality for galaxies at z = 0 (Nelson et al. 2018), the evolution of the mass-metallicity relation (Torrey et al. 2018), the mass-size relation for quiescent and star-forming galaxies (Genel et al. 2018) and the metal distribution within the intra-cluster medium (Vogelsberger et al. 2018). Additionally, within the publicly available catalogs, the simulations include fluxes for galaxies in several bands. Here, we briefly summarize the most important aspects of their computation, but we refer the reader to Nelson et al. (2018) for a more detailed explanation. First, each star particle is treated as a single-burst simple stellar population with recorded formation time, metallicity, and initial mass. Their spectral properties were modeled using the FSPS code (Conroy et al. 2009), with Padova isochrones, the MILES stellar library, and a Chabrier initial mass function (Chabrier 2003). The isochrone grid spans 22 metallicity and 94 age bins (in log space), and simple stellar population spectra are convolved with SDSS filter responses (u,g,r,i, and z at airmass 1.3), including default dust and nebular emission models. Band magnitudes for each star particle are computed via bicubic interpolation on the isochrone grid and scaled by initial mass. Total galaxy magnitudes are obtained by summing all subhalo star particles.
For these reasons, TNG100 is an excellent laboratory for studying galaxy evolution and understanding the reasons behind morphological transformations in various environments.
2.2. Galaxy sample
We relied on the Group Catalogues available in the public TNG database to select galaxies in the simulations. The main properties of haloes and sub-haloes were determined using the friends-of-friends (FOF) and SUBFIND algorithms (Springel et al. 2001; Dolag et al. 2009) for the 100 snapshots spanning the redshift range 0<z<20. First, a standard FOF group finder with a linking length b = 0.2 was used to identify haloes. Then, SUBFIND recognizes and hierarchically characterizes the gravitationally bound substructures. The subhalo catalog includes centrals and satellites, where the central matches the position of FOF haloes, defined as the position of the dark matter particle with the minimum gravitational potential. Central galaxies can host one or more sub-haloes. These sub-haloes can contain stellar particles (or not).
This article defines galaxies as all those objects in the subhalo catalog with a stellar content greater than M⋆≥109.5 M⊙. Consequently, we ensured a minimum resolution of approximately 1000 stellar particles per object. Figure 1 shows the stellar-mass distribution for all the galaxies in TNG-100. The simulation comprises 12 535 objects at z = 0 with a stellar mass higher than M⋆≥109.5 M⊙ (represented by the green bars). Among these objects, 694 have a stellar mass higher than M⋆≥1011 M⊙ (depicted by the orange bars) and constitute our primary sample for the study. Given the nature of our study, for each galaxy in the primary sample, we have at least ∼105 stellar particles per galaxy, enabling us to measure the kinematics of our objects with reasonable confidence.
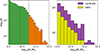 |
Fig. 1. Left: Stellar-mass distribution for all galaxies in TNG100. The dashed line shows the limit log at which we consider galaxies to be “massive”. The orange bars comprise the core of our study sample. Right: Satellite (yellow)–central (purple) separation for galaxies with log10M⋆/M⊙>1011. Massive galaxies are predominantly central, though a non-negligible fraction are satellites. |
As mentioned earlier, central galaxies are those designated as the dominant galaxies within each FOF halo, while satellites are defined as sub-haloes hosted by the central halo. In the right panel of Fig. 1, the central-satellite distribution is shown exclusively for the massive galaxies in our sample. As expected, on average, satellite galaxies tend to be slightly less massive and constitute 27.9% of the entire sample of supermassive galaxies, indicating that central galaxies primarily dominate the high-mass bin. The magnitudes, stellar masses, M200, and R200 used in this study are publicly available in the TNG database. Additionally, to split the sample between disk and spheroids, we performed a morpho-kinematical analysis of each galaxy in our sample, as described below.
2.3. Kinematic properties
This subsection explains the methodology employed to measure the kinematic properties for categorizing galaxies into disks and spheroids. We followed the procedure proposed in Lagos et al. (2017) to measure, from the stellar component, the velocity dispersion (σ); the specific angular momentum (j); the rotational velocity (Vrot); and the spin parameter λR, defined below. Unless stated otherwise, all properties were estimated within three stellar half-mass radii, i.e., three times the radii enclosing half of the galaxy's stellar mass. This property is used as a proxy for the “half-light radius” of the galaxy.
Firstly, we computed the specific angular momentum of the stellar component, j⋆, using the formula
 (1)
(1)
Here, ri, vi, and mi represent the position, velocity, and mass of the i-th particle of a galaxy, while rCOM and vCOM are the position and velocity of the center of mass of the galaxy, respectively. With the specific angular momentum, the rotational velocity of a galaxy, Vrot(r), can be determined as
 (2)
(2)
Additionally, we can measure the velocity dispersion perpendicular to the disk's mid-plane. To do this, we took the velocity dispersion above parallel to the total stellar angular momentum (L⋆) from the galaxy. In the measurement of L⋆, we considered all stellar particles bound to the subhalo.
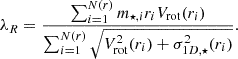
Finally, the 1D velocity dispersion parallel to the disk is measured as follows:
 (3)
(3)
Here, 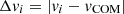 is the velocity relative to the center of mass, and
 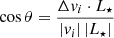 .
.
The λR parameter was presented by Emsellem et al. (2007) to estimate how rotationally supported a galaxy is. As shown in Naab et al. (2014), to measure λR appropriately, we needed to combine the properties mentioned above in annuli as follows:
 (4)
(4)
Here, the sum is over all radial bins, N(r), from the inner one to r, and m⋆,i is the stellar mass enclosed in each bin. Although it is evident that, by design, this property is dependent on the resolution of the bins, our focus on studying kinematical properties in the internal parts of the galaxies in our sample ensures that our results remain consistent when using a fixed aperture of three half-mass radii for all the properties mentioned above, including the λR parameter.
Additionally, we gauged the galaxy's ellipticity within the same enclosed region using only the stellar component's inertia tensor. The components of the inertia tensor were measured as follows:
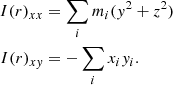 (5)
(5)
Due to this tensor's symmetry, measuring the other components follows the same procedure. After constructing the tensor, it is diagonalized, and the eigenvalues are sorted in ascending order. These eigenvalues were then utilized to define the three axes of the galaxy:
 (6)
(6)
Finally, we defined the ellipticity of the galaxy, ɛ, as
 (7)
(7)
where a and c correspond to the major and minor axis, respectively.
3. Results
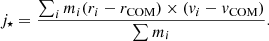
Massive disks are rare in the Universe, with previous studies reporting that superluminous spiral galaxies, a type of massive disk, account for no more than ∼10% of galaxies at the high-mass end (log10M⋆≥11.4[M⊙]) (Jackson et al. 2020, 2022). Additionally, Quilley & de Lapparent (2022) suggests an upper threshold in stellar mass for disks to exist. Notably, their work found no disks more massive than log10M⋆≥11.8[M⊙]. The reasons behind this apparent threshold in stellar mass remain an open question. To address this, in the first part of this article, we select all disks within the simulation using the morpho-kinematic statistics detailed in Sect. 2.3. We chose galaxies dominated by their rotational support and exhibiting small ellipticities by applying a threshold in the ratio between λ and ɛ. Figure 2 illustrates the disk fraction as a function of stellar mass for all galaxies in the simulation. We used three different threshold criteria ( represented by red, green, and blue bars, respectively) to select disks. These thresholds correspond to the suggested values in Emsellem et al. (2011) for different apertures. For simplicity, we refer to fast and slow rotators as disk and spheroidal galaxies, respectively, as those galaxies above (below) our kinematic selection threshold. It is important to note that for our final disk classification, we verified the morphologies of the selected disks through visual inspection to ensure that our morpho-kinematic criteria identified actual disks.
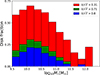 |
Fig. 2. Disk fraction for the TNG simulation measured with three different threshold criteria, |

From Fig. 2, it is apparent that the fraction of disks decreases with increasing mass. The disk fraction steadily decreases at log10M⋆≥10.5[M⊙]. It is worth noting that irrespective of the selected threshold, there are disks with stellar masses up to log10M⋆≥11[M⊙], with the most extreme case reaching log10M⋆∼12[M⊙].
Figure 3 shows the gas density of some of the most spectacular cases in our sample, all with log10M⋆≥ 11.4[M⊙]. This mix of spirals and lenticular galaxies resides in various environments, from the field to clusters and satellites to centrals.
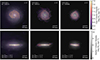 |
Fig. 3. Blended stellar and gas density of three massive disks in face-on (top row) and edge-on (bottom row) views, selected using a |

For the remainder of this article, we use the term “supermassive disks” to refer to all disks with stellar masses log10M⋆≥11[M⊙], where the drop in number of disks in TNG is noticeable. Also, of the three aforementioned thresholds, we focused only on  and 0.71 since there are no substantial differences between using
  and 0.81 besides increasing the statistical noise. Of the 694 galaxies available within this mass range, we recovered a total of 220 (32%) and 50 (7%) disks for
  and 0.71, respectively.
3.1. Control sample
Constructing a control sample (CS) was crucial in this project. It plays a pivotal role in isolating the phenomena that lead to the formation of supermassive disks, thereby enhancing the accuracy and reliability of our findings. We can identify intrinsic properties and behaviors specific to our galaxies of interest by comparing massive fast and slow rotators. Different methods of building a CS can introduce selection biases, leading to misleading interpretations of the data. To mitigate these issues, it is essential to impose constraints on parameters such as redshifts, stellar masses, and local densities, which can significantly reduce selection biases. To do this, we built a CS of massive spheroidal galaxies at z = 0 with the same stellar mass distribution as our supermassive disks, following Perez et al. (2009):
-
We selected a candidate sample of spheroidal galaxies with log10M⋆≥11 and
 .
. -
For each massive disk, we looked for massive spheroids with the same stellar mass with 0.01 dex of tolerance (abs(log10M⋆,disk−log10M⋆,Sph<0.01)) to construct a sample of candidates.
-
We randomly selected galaxy analogs per supermassive disk to build our CS while maintaining the stellar mass distribution.
By constructing our CS, we ensured that we could compare the same stellar mass distribution while maximizing the number of candidates to compare. In this case, depending on the morpho-kinematic threshold imposed for the supermassive disks, we ended up with 220 and 250 massive spheroids in the CS for disks with  and 0.71, respectively.
Given that different kinematic criteria produce different stellar mass distributions, we built a CS for each galaxy set. It is worth noting that this random procedure was performed for several control samples and that our results remained unchanged when we selected other galaxy sets. Throughout this article, we present our results based on the same CS for each chosen kinematic criterion. In Fig. 4 we show the fraction of satellites for supermassive galaxies split by morphological type using a kinematic threshold of  and 0.71 to split between disks and spheroids, shown as squares (blue) and filled circles (red). The error bars correspond to binomial errors within one sigma. The dashed black line shows the median satellite fraction for supermassive galaxies, and the gray-shaded area shows errors within three sigma for the whole sample of supermassive galaxies. At first glance, it appears that supermassive disks tend to exhibit a mild tendency to be satellites compared to both spheroids and the entire sample. Nevertheless, we cannot detect any special trend within one standard deviation. We explore these results further in Sect. 4.3.
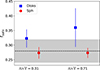 |
Fig. 4. Fraction of satellites in our sample of supermassive galaxies. Disks and spheroids are shown as blue squares and red circles. The dashed black line shows the mean fraction of satellites within the massive regime. Errors correspond to one sigma binomial errors as stated in Cameron (2011), while the gray shaded area corresponds to three sigma binomial errors for the whole sample. We can see that although disks tend to have a mild tendency to be satellites, the fractions of satellites for disks and spheroids are comparable within one sigma. |
3.2. Color-mass diagram
To visualize the distribution of disks compared to the entire population of galaxies in the simulation, Fig. 5 shows the color-stellar mass relation for all galaxies with log10M⋆≥9.5 [M⊙] (left panel). Additionally, in the rightmost panels, we show a zoomed-in view of the region that includes only supermassive galaxies, where disks are selected using  (upper panel) and 0.71 (lower panel). As we can see, supermassive disks occupy all regions in the color-stellar mass diagram, mainly populating the green valley and the red population. Although this may seem counterintuitive at first glance, as previously mentioned, our supermassive disks correspond to a mix of spirals and lenticular galaxies that should dominate at this mass range. At the same time, although our galaxies have supermassive disks, most also have a well-defined supermassive spheroidal (red) component within their bulge.
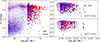 |
Fig. 5. Left: Color (U−r) stellar mass diagram for all galaxies in the simulation. Blue and red dots show disk and spheroidal galaxies, with stars highlighting galaxies with log10M⋆≥11. We chose a threshold |


It is also worth noting that although we recover the drop in disk fraction shown in Quilley & de Lapparent (2022), it is shifted to lower masses, being at log10M⋆ = 11[M⊙] and log10M⋆ = 11.4[M⊙] for TNG and Quilley & de Lapparent (2022), respectively. This is somewhat expected given that, as shown in Genel et al. (2018), late-type galaxies within TNG are slightly less massive than what is expected for a given size at log10M⋆/M⊙>10.5. Additionally, as reported in our work, there are few late-type galaxies (or fast rotators) with log10M⋆/M⊙>11.4. This result holds for early-type galaxies as well, although there are several early-type galaxies with log10M⋆/M⊙>11.4.
3.3. Merger histories
As a proxy to quantify how essential mergers were for the assembly of our sample, we defined a parameter that relates the number of mergers, the stellar mass ratio of galaxies at the time of the merger, and the redshift at which this merger took place, following Fragkoudi et al. (2020). Here, we measured the sum of the relative importance of each merger in the build-up of the stellar mass of that galaxy using the following equation:
 (8)
(8)
where fi is the ratio between the maximum stellar mass reached by the two merging galaxies; fi=Msat/Mcen; and zi corresponds to the redshift of the merging time. We defined the merging time as the last moment when the two galaxies can be recognized independently by SUBFIND. This was done to ensure the merger is final and to avoid cases where SUBFIND could detect two galaxies passing close to each other as a single merged galaxy. This parameter was measured for all mergers since z = 1 with fi>1/10. Then, we summed the parameters obtained at all z for each galaxy.
Figure 6 shows the relative importance of mergers for each galaxy for all our thresholds. We can see that disk galaxies have a significantly more quiescent recent (z<1) merger history than spheroidal galaxies. For any selection threshold, more than 30% of disk galaxies did not experience any significant merger at z<1. Moreover, we can see that for  , 46% of galaxies have not experienced any substantial mergers since z = 1. Additionally, when we examine each distribution, we can see that the merger's impact on disks is an order of magnitude less significant for supermassive disks than in our CS. Additionally, the impact of mergers becomes less significant when stricter criteria are considered. This result highlights that spheroidal galaxies tend to have a more active recent merging history, with a broader range of values for the merging parameter. Moreover, we can see that only ∼10% of the galaxies from our CS did not have any significant merger since z = 1 at any morpho-kinematic threshold.
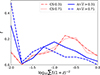 |
Fig. 6. Relative merger importance for the growth in the stellar mass of massive galaxies. Solid and dashed blue lines correspond to disks selected with |

To further highlight the differences between populations, Fig. 7 shows the number of significant mergers (fi≥1:10) experienced by the galaxies in our sample. In this case, we not only show normal mergers, but we highlight gas-rich mergers as well, where we define a gas-rich merger as mergers where the maximum gas mass of the two merging galaxies, at their merging time, i.e., fgas=Mgas,sat/Mgas,cen>0.1. Regardless of the threshold used as selection criteria, disks have a lower number of mergers compared to spheroids. Moreover, at most, 80% of disk galaxies suffered only one significant merger throughout their history. On the other hand, ≥50% of spheroids need at least two mergers to form.
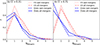 |
Fig. 7. Number of mergers experienced by supermassive galaxies for |

When comparing the number of gas-rich mergers with the whole merging history, we can see that the two distributions are very similar. This means that, for disk galaxies, in addition to having fewer mergers than our CS, the few mergers they encounter are gas-rich. Moreover, in the case of galaxies with  , by comparing cases one by one, we found that only five galaxies experience mergers that do not classify as gas-rich. These cases were minor mergers at z∼1, although significant.
These results suggest that gas-rich mergers allow disks to be destroyed and reformed as supermassive disks. This may not be the case for our CS, as having a large number of mergers could dynamically heat the stellar population, inhibiting the reformation of disks. Nevertheless, we want to highlight that even though this may be the case for some galaxies, the bulk of our sample comprises supermassive disk galaxies that do not experience any merger at z<1 regardless of their mass.
3.4. The impact of AGNs in forming supermassive disks
Another possibility to stop disks from growing is if enough energy is injected into the interstellar medium. This injection may prevent disks’ reformation and halt their star formation, making them unable to survive in time. Several feedback mechanisms may inject energy into the medium, but the most important one, especially at the high-mass bin, is the AGN feedback, as extensively reviewed in Fabian (2012). To see the impact that the AGN feedback can have on the survival conditions of supermassive disks, we tracked the energy injected into the medium thermally and kinetically in those phases where the AGN was active as a quasar and in radio mode, respectively. Figure 8 shows the AGN's mean energy injected into the galaxy in quasar and radio modes for our disks and our CS. The energy feedback distribution for each of our selected thresholds is shown from top to bottom. We can see that the differences between samples are small for both the kinetic and thermal AGN feedback, with supermassive disks having slightly less active AGN histories (∼0.25 dex at  ). Although a small difference related to the morphology can be seen in the thermal energy injected throughout galaxy history, it is worth mentioning that the kinematic mode is expected to be the one that directly affects the morphology of galaxies, while the thermal mode may at most affect their star formation history, as shown in previous work (eg. Pillepich et al. 2018b; Rosas-Guevara et al. 2019, 2025). In this sense, the thermal mode can stall the star formation in disks, transforming them from spirals to lenticulars, but it is not expected to transform a disk into a spheroid. Considering this, we conclude that AGNs do not play a key role in stopping the formation of supermassive disks but can stall their growth in stellar mass or prevent the reformation of a new disk after a significant merger.
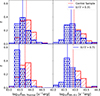 |
Fig. 8. Distribution of energy injected into the medium by AGN feedback thermally (quasar mode, left panels) and kinetically (radio mode, right panels) for disks (starred blue bars) and our CS (hashed red bars). Disk galaxies show marginally lower values of both types of energetic feedback (∼0.125 – ∼0.25 dex). |
4. Discussion
4.1. Evolution of supermassive disks in the last 4 Gyr
Supermassive disks have experienced a more quiescent merging history than spheroidal galaxies. However, it is still unclear how likely they are to survive once they have formed. To answer this question, we made a new sample of supermassive disks selected at z = 0.5 and followed their evolutionary history up to z = 0. For these new disks, we used the same constraints as for our disks at z = 0, i.e., log10M⋆≥11[M⊙] and λ/ɛ≥0.31 and 0.71, with a total of 164 and 26 supermassive disks, respectively at z = 0.5.
Surprisingly, our results suggest that most disks survive until z = 0, retaining their disk condition. Figure 9 shows the fraction of supermassive disks that survive since z = 0.5 (surviving disks), the fraction of galaxies that survive until z = 0, but their morphology was transformed from disk to spheroidal (surviving spheroids) and the fraction of disks that do not survived until z = 0, because they merged with other more massive spheroidal galaxy between z = 0.5 and z = 0 (merged spheroid). When selecting disks with  and 0.71, we find that
-
102 (63%) and 15 (58%) disks survived for at least 4 Gyr (surviving disks).
-
38 (23%) and 9 (35%) transform into spheroids by z = 0 (surviving spheroids).
-
24 (14%) and 2 (7%) merged with a more massive galaxy during this time (merging spheroids).
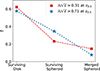 |
Fig. 9. Fate of supermassive disks (log10M⋆ 1011[M⊙]) selected at z = 0.5. The fraction of surviving disks (SD), the fraction of disks that merge with a more massive galaxy (MS), and the fraction of disks that transform to spheroidal throughout their history (SS) are shown here. Disks selected according to the thresholds |

It is worth noting that although we found very few supermassive disks with substantial rotational support at z = 0.5, this is a consequence of the lack of supermassive galaxies at intermediate z within our limited volume sample, and not the lack of rotationally supported galaxies. These results suggest that once supermassive disks are formed, they are long-lived, with ∼60% of supermassive disks selected at z = 0.5 surviving until z = 0 regardless of the selection threshold. Between 20% and 35% of supermassive disks formed at z = 0.5 merged with a less massive galaxy, transforming its morphology by z = 0. Additionally, it is worth noting that in some cases, disks found at z = 0.5 can undergo a gas-rich merger, resulting in a transitional state with a broken disk. Nonetheless, if the mergers are gas-rich enough, the disk can be reconstructed, and the morphology can be preserved (Romeo et al. 2023). This phenomenon will be explored in Sect. 4.4.
4.2. A comparison with observations
Supermassive disks are rarely found in the Universe, with ≤200 objects reported until now (Ogle et al. 2019; Jackson et al. 2022). As we show in Sect. 3, they only constitute between ∼7 and 30% of the galaxies in the TNG sample, depending on the criterion. Moreover, in Jackson et al. (2020), using a different set of simulations, they found that supermassive disks constitute ∼11% of their sample. While this value exceeds what we find under our stricter selection criteria, it still corresponds to only a minority of the massive systems. Additionally, in Jackson et al. (2022), it is reported that supermassive disks account for ∼13% of galaxies within the high-mass end, in agreement with their previous work. On the other hand, Zhu et al. (2023) studied a particular type of supermassive disks, the giant low surface brightness galaxies (LSBGs), using TNG-100. They found that around 6% of galaxies per stellar mass bin, within the mass range of 10.2 ≤ log10M⋆/M⊙≤11.6, correspond to giant LSBGs. This is in rough agreement with our results, although the studied mass range differs. Additionally, in Pérez-Montaño & Cervantes Sodi (2019), using a galaxy sample from the Korea Institute for Advanced Study (KIAS) Value-Added Galaxy Catalog (a subsample of SDSS DR7; Abazajian et al. 2009; Choi et al. 2010), they showed that LSBGs tend to reside closer to filaments than clusters, compared to high-surface brightness galaxies. They further tested these results using TNG-100 (Pérez-Montaño et al. 2022, 2024), where they found that, in addition to being closer to filaments, rotationally supported LSBGs tend to reside in low-density environments. They suggest that this environment contributes to the formation of this type of object.
In Fig. 10 we compare our sample of simulated supermassive disk galaxies with two observational datasets: the supermassive disks from Ogle et al. (2019) and the LSBGs from O’Neil et al. (2004). We show the SFR as a function of stellar mass (left panel) and absolute R-band magnitude (right panel). As we can see, most of the observational galaxies lie along the star-forming main sequence. At the same time, our simulated population spans a broader range in SFR, including both star-forming and quiescent systems. This diversity likely reflects the nature of our selection criteria and the fact that our sample is volume-complete. Since we selected galaxies solely based on their stellar mass, our analysis is unaffected by observational biases, which allows us to include low luminosities. These high-mass galaxies may remain undetected in flux-limited surveys. Although our sample extends to somewhat lower stellar masses than those in Ogle et al. (2019), the star-forming galaxies in our simulation follow a similar SFR–mass relation to that observed. This consistency suggests that the observational sample of supermassive disks is incomplete, particularly at lower surface brightnesses. With the advent of next-generation wide-field surveys such as the Vera C. Rubin Observatory's LSST, we expect this gap to be significantly reduced, enabling more comprehensive studies of the supermassive disk galaxy population.
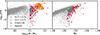 |
Fig. 10. SFR as a function of stellar mass (left) and absolute magnitude (right) for our simulated supermassive disk galaxies compared with observational samples. In the left panel, our galaxies are compared with the supermassive galaxy sample from Ogle et al. (2019) (orange crosses). In contrast, the right panel shows a comparison with the LSBGs from O’Neil et al. (2004). Most observational galaxies lie along the star-forming main sequence, whereas our simulated sample includes both star-forming and quiescent systems, highlighting their broader diversity in star formation activity. |
4.3. Environmental distribution
Previous studies have shown that these galaxies comprise a minority of the massive galaxies in the Universe. Nevertheless, understanding which environments are more prevalent may help future studies by facilitating their discovery and observation in all-sky surveys.
In Fig. 11 we show the stellar mass as a function of the host halo M200 in which massive galaxies reside. We can see that, surprisingly, supermassive disks inhabit haloes of a wide range of masses. Qualitatively speaking, they tend to inhabit slightly less massive haloes than spheroidal galaxies, but exhibit a wider distribution than our CS, as indicated by the isocontours. Nevertheless, both samples have a broad range of haloes in which they can reside. Additionally, supermassive disks tend to reside as centrals, following the trends for most supermassive galaxies. It is worth mentioning that satellite supermassive disks tend to reside in massive groups and galaxy clusters. Figure 11 also highlights that, as we move toward a stricter kinematic threshold, our sample of disks tends to be slightly less massive, but we reckon that this may be related to our limited sample.
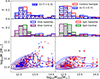 |
Fig. 11. Bottom panels: Distribution of haloes versus stellar mass for the galaxies in our sample, using a threshold of |

Even though the number of supermassive disks decreases with host halo mass, supermassive disk galaxies can reside in any environment, ranging from isolated systems to the most massive clusters in the simulation. It is worth reminding the reader that, as we are defining disks, these massive systems that reside within galaxy clusters as satellites probably correspond to lenticular galaxies and red spirals. As highlighted by Fig. 5, as we move toward more massive galaxies, disks tend to reside within the green valley and the red population, highlighting that what dominates the formation of rotationally supported galaxies is their merging history instead of their environment. When splitting the available environments into low-mass groups (12 ≤ log10M200[M⊙]≤13), massive groups (13 ≤ log10M200[M⊙] ≤ 14) and galaxy clusters (14 ≤ log10M200[M⊙]), we found that around ∼60% of supermassive disks reside in low-mass groups, ∼25% reside in massive groups, while the remaining ∼15% reside in galaxy clusters.
Additionally, their conditions as satellites or centrals can foster or halt their formation and survival (Romeo et al. 2020, 2023). As shown in Fig. 4, disks do not have any preferential tendency to be a satellite regardless of the selection criteria. Nonetheless, this was done in general terms. To investigate this relation further, in Fig. 12 we show the fraction of satellites as a function of their rotational support. We measured the median fraction of satellites in bins of 0.1 ; the error bars correspond to the binomial errors following Cameron (2011) within one sigma. As we move toward higher values of
  , the fraction of satellites grows, with an apparent increase at
  . These results, at first glance, may suggest that more rotationally supported systems prefer to be satellites rather than central galaxies, in agreement with our previous claim of having a less active merging history. Nevertheless, within one sigma error, we cannot conclude any particular difference with confidence. It is worth noting that, since our sample is a simulation box of 100 cMpc with only 14 clusters, the most massive being M200 = 3.8×10¹⁴ [M⊙], it is limited in volume. Considering this, we acknowledge that the fractions and conditions of centrals and satellites may change if we examine more massive clusters or larger samples of galaxies and environments, where the number of rotationally supported galaxies could increase, reducing the errors. Nonetheless, our results highlight that the most crucial condition for supermassive disks to exist is a relatively quiescent but gas-rich merger history, which does not correlate directly with the environment.
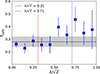 |
Fig. 12. Fraction of satellites in our sample of supermassive disks compared to the whole sample of massive spheroids. We can see that the fraction of supermassive disks as satellites is similar to their spheroidal counterpart. |
4.4. Formation pathways of supermassive disks
In Jackson et al. (2020), two different formation scenarios were discussed for the formation of supermassive spirals. The first one, and the most predominant in their sample, explains that when a massive dispersion-dominated galaxy undergoes a significant merger (fmerger>1/10) with a gas-rich satellite, the interaction can spin up the spheroidal component, leaving a stellar disk as the remnant of the interaction. This pathway accounts for 70% of the galaxies in their sample. Additionally, they found that this mechanism is facilitated by galaxies inhabiting less dense environments, which makes them less susceptible to gas-depleting processes like ram pressure and tidal stripping. On the other hand, the second formation scenario is due to an anomalously quiescent merging history in their sample, with the remaining 30% retaining their disk condition throughout the galaxy's history.
As we have seen throughout this work, although the formation pathways proposed by these authors align with our findings, the fractions that each of these mechanisms accounts for in our sample are different, with most of our supermassive disks experiencing a relatively quiescent merging history compared with spheroidal galaxies. It is worth noting that some of our disks have experienced only one merger (between 30% and 40%, depending on the selection criteria) since z = 1, in agreement with the authors’ formation scenario. To further shed light on the nuances of the formation pathways followed by our supermassive disks, in this section, we split our sample more thoroughly into the following four categories: (i) galaxies with no significant mergers after z = 1, (ii) disk galaxies that suffer a significant merger after z = 1, reform their disks after the interaction, (iii) spheroidal galaxies that suffer a significant merger after z = 1 that consistently had high rotational support, and (iv) spheroidal galaxies that suffer a significant merger after z = 1, producing a disk as a remnant.
Figure 13 shows an example of each of the classifications mentioned above, with the morpho-kinematic parameter used to perform the selection displayed as a function of redshift. As we can see, sudden drops in the morpho-kinematic parameter can be interpreted as passages during the merging process. As stated previously, in the case of our stricter threshold, 24 galaxies (48%) did not experience any significant interaction after z = 1. They have a remarkably quiescent merging history and are the most dominant population in our sample, followed by spheroids without significant rotation until the last gas-rich mergers with 13 galaxies (∼26%). Only 10 disk galaxies (∼20%) suffered a significant merger at z<1, but were able to reconstruct their disk after the interaction. The remaining 3 (∼6%) galaxies were spheroidal before the merger but had significant rotational support even before the merger.
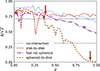 |
Fig. 13. Examples of galaxies experiencing different formation pathways: a quiescent merging history (cyan), a disk that experienced mergers (red), a spheroidal galaxy with high rotational support (purple), and a spheroidal galaxy that rapidly transformed into disks after a gas-rich merger (brown). Colored arrows and stars highlight the time when the merger starts and ends. |
Our results show that even though the vast majority of our sample did not experience an active merging history, once disks are formed, they are rarely disrupted. Moreover, it only takes one gas-rich merger to trigger a disk in some cases, even if the galaxies are widely dispersion-dominated.
5. Summary and conclusions
We studied the conditions needed for the formation and survival of supermassive disks using the state-of-the-art public database from the magnetohydrodynamic cosmological simulations of the TNG project.
Using the public database from the high-resolution run from TNG100, we used a morpho-kinematic criterion to split our massive galaxies between disks and spheroids as follows: galaxies must have a log10M⋆≥11[M⊙], and disks must have a λ/ɛ≥0.31 or 0.71. With these criteria, we find 220 and 50 supermassive disks with each morpho-kinematic criterion, respectively, from a total of 694 galaxies with log10M⋆≥11[M⊙].
The fraction of supermassive disks steadily decreases with stellar mass, but we still find four galaxies with log10M⋆≥11.4[M⊙]; one has a log10M⋆∼11.8[M⊙] regardless of the kinematic threshold. These results suggest that, as reported in Quilley & de Lapparent (2022), the density of disks suddenly drops when a certain stellar mass is reached, in our case log10M⋆≥11[M⊙]. Although this does not mean that supermassive disks cannot exist, they become less likely for certain definitions.
The distribution in stellar mass of supermassive disks is generally less spread out than that of our sample of spheroids. However, even when comparing galaxies within the same stellar mass distribution, as for our CS, apparent differences arise in their assembly histories.
Supermassive disks tend to have a quiescent merging history, with most of their stellar mass assembled by star formation. In contrast, spheroidal galaxies have a relatively large number of mergers at any stellar mass. Additionally, the few mergers that disk galaxies have tend to be gas-rich, regardless of whether the merger was minor or major. Supermassive disks can be found in any environment, from isolation to clusters, although they are more prominent in low-density environments. Additionally, we find that they can exist and survive regardless of their condition as satellites or centrals of their host haloes. When selecting supermassive disk galaxies at z = 0.5, we find that once those disks become massive enough, the chances of surviving and maintaining their disk morphology are relatively high (∼60%) at any selection threshold. When comparing the impact that AGNs can have on the formation or stability of supermassive disks, we find that although there are some differences between spheroidal and disk galaxies regarding the energy injected thermally via AGNs, only minor differences are seen in the kinetic energy injected into the medium at any stellar mass or kinematic threshold. This result suggests that although AGNs play a key role in regulating the star formation of galaxies, they do not directly change their morphology.
These results led us to conclude that the number of mergers defines a galaxy's morphology and/or its kinematical support at any stellar mass. That said, we find that supermassive disks are long-lived objects with a quiescent merging history that are more often found in low-density environments. However, they can reside in various environments, ranging from isolation to clusters.
These objects are exciting candidates for studying secular galaxy evolution. As this work establishes, their merging history should have been very quiescent in the last 8 Gyr. Studying these objects in the future with upcoming surveys will be key to better understanding the star formation history of rotationally supported supermassive galaxies.
Acknowledgments
We want to thank the referee for their helpful and insightful comments, which significantly improved this work. We would also like to thank Yetli Rosas-Guevara, Yara Jaffé, and Jacob Crosset for valuable comments and discussions. We gratefully acknowledge support from the ANID BASAL project FB210003. DP acknowledges financial support from ANID through FONDECYT Postdoctorado Project 3230379. GG thanks Pontificia Universidad Católica de Chile, ESO, France-Chile Laboratory of Astronomy (FCLA), and Laboratoire d’Astrophysique de Marseille (LAM) for their support during a 2024-2025 sabbatical leave. PBT acknowledges partial funding by Fondecyt-ANID 1240465/2024 and Núcleo Milenio ERIS NCN2021_017. AM acknowledges support from the FONDECYT Regular grant 1212046. FAG acknowledges support from the FONDECYT Regular grant 1211370. PBT, AM and FAG acknowledge funding from the HORIZON-MSCA-2021-SE-01 Research and Innovation Programme under the Marie Sklodowska-Curie grant agreement number 101086388. BTC gratefully acknowledges funding by ANID (Beca Doctorado Nacional, Folio 21232155).
References
- Abazajian, K. N., Adelman-McCarthy, J. K., Agüeros, M. A., et al. 2009, ApJS, 182, 543 [Google Scholar]
- Aihara, H., Allende Prieto, C., An, D., et al. 2011, ApJS, 193, 29 [NASA ADS] [CrossRef] [Google Scholar]
- Barnes, J. E. 1992, ApJ, 393, 484 [NASA ADS] [CrossRef] [Google Scholar]
- Bernardi, M., Sheth, R. K., Annis, J., et al. 2003, AJ, 125, 1817 [NASA ADS] [CrossRef] [Google Scholar]
- Blanton, M. R., & Moustakas, J. 2009, ARA&A, 47, 159 [Google Scholar]
- Bournaud, F., Jog, C. J., & Combes, F. 2007, A&A, 476, 1179 [NASA ADS] [CrossRef] [EDP Sciences] [Google Scholar]
- Cameron, E. 2011, PASA, 28, 128 [Google Scholar]
- Cappellari, M. 2016, ARA&A, 54, 597 [Google Scholar]
- Cattaneo, A., Mamon, G. A., Warnick, K., & Knebe, A. 2011, A&A, 533, A5 [NASA ADS] [CrossRef] [EDP Sciences] [Google Scholar]
- Chabrier, G. 2003, PASP, 115, 763 [Google Scholar]
- Choi, Y. -Y., Han, D. -H., & Kim, S. -S. S. 2010, J. Korean Astron. Soc., 43, 191 [NASA ADS] [CrossRef] [Google Scholar]
- Conroy, C., Gunn, J. E., & White, M. 2009, ApJ, 699, 486 [Google Scholar]
- Conselice, C. J., Bluck, A. F. L., Mortlock, A., Palamara, D., & Benson, A. J. 2014, MNRAS, 444, 1125 [Google Scholar]
- de Lapparent, V., Baillard, A., & Bertin, E. 2011, A&A, 532, A75 [NASA ADS] [CrossRef] [EDP Sciences] [Google Scholar]
- Dolag, K., Borgani, S., Murante, G., & Springel, V. 2009, MNRAS, 399, 497 [Google Scholar]
- Dubois, Y., Gavazzi, R., Peirani, S., & Silk, J. 2013, MNRAS, 433, 3297 [CrossRef] [Google Scholar]
- Emsellem, E., Cappellari, M., Krajnović, D., et al. 2007, MNRAS, 379, 401 [Google Scholar]
- Emsellem, E., Cappellari, M., Krajnović, D., et al. 2011, MNRAS, 414, 888 [Google Scholar]
- Faber, S. M., Willmer, C. N. A., Wolf, C., et al. 2007, ApJ, 665, 265 [Google Scholar]
- Fabian, A. C. 2012, ARA&A, 50, 455 [Google Scholar]
- Fragkoudi, F., Grand, R. J. J., Pakmor, R., et al. 2020, MNRAS, 494, 5936 [Google Scholar]
- Genel, S., Vogelsberger, M., Springel, V., et al. 2014, MNRAS, 445, 175 [Google Scholar]
- Genel, S., Nelson, D., Pillepich, A., et al. 2018, MNRAS, 474, 3976 [Google Scholar]
- Gómez, P. L., Nichol, R. C., Miller, C. J., et al. 2003, ApJ, 584, 210 [Google Scholar]
- Hubble, E. P. 1926, ApJ, 64, 321 [Google Scholar]
- Ivezić, Ž., Kahn, S. M., Tyson, J. A., et al. 2019, ApJ, 873, 111 [Google Scholar]
- Jackson, R. A., Martin, G., Kaviraj, S., et al. 2020, MNRAS, 494, 5568 [NASA ADS] [CrossRef] [Google Scholar]
- Jackson, R. A., Kaviraj, S., Martin, G., et al. 2022, MNRAS, 511, 607 [NASA ADS] [CrossRef] [Google Scholar]
- Kauffmann, G., White, S. D. M., Heckman, T. M., et al. 2004, MNRAS, 353, 713 [Google Scholar]
- Kaviraj, S., Laigle, C., Kimm, T., et al. 2017, MNRAS, 467, 4739 [NASA ADS] [Google Scholar]
- Kolesnikov, I., Sampaio, V. M., de Carvalho, R. R., & Conselice, C. 2024, arXiv e-prints [arXiv:2412.03778] [Google Scholar]
- Lagos, C. d. P., Theuns, T., Stevens, A. R. H., et al. 2017, MNRAS, 464, 3850 [Google Scholar]
- Laureijs, R., Amiaux, J., Arduini, S., et al. 2011, arXiv e-prints [arXiv:1110.3193] [Google Scholar]
- Marinacci, F., Vogelsberger, M., Pakmor, R., et al. 2018, MNRAS, 480, 5113 [NASA ADS] [Google Scholar]
- Martin, D. C., Wyder, T. K., Schiminovich, D., et al. 2007, ApJS, 173, 342 [NASA ADS] [CrossRef] [Google Scholar]
- Martin, G., Kaviraj, S., Devriendt, J. E. G., Dubois, Y., & Pichon, C. 2018, MNRAS, 480, 2266 [Google Scholar]
- McIntosh, D. H., Guo, Y., Hertzberg, J., et al. 2008, MNRAS, 388, 1537 [NASA ADS] [CrossRef] [Google Scholar]
- Montaguth, G. P., Torres-Flores, S., Monachesi, A., et al. 2023, MNRAS, 524, 5340 [NASA ADS] [CrossRef] [Google Scholar]
- Montaguth, G. P., Monachesi, A., Torres-Flores, S., et al. 2025, A&A, 696, A240 [NASA ADS] [CrossRef] [EDP Sciences] [Google Scholar]
- Morgan, W. W., & Mayall, N. U. 1957, PASP, 69, 291 [NASA ADS] [CrossRef] [Google Scholar]
- Naab, T., Oser, L., Emsellem, E., et al. 2014, MNRAS, 444, 3357 [Google Scholar]
- Naiman, J. P., Pillepich, A., Springel, V., et al. 2018, MNRAS, 477, 1206 [Google Scholar]
- Nelson, D., Pillepich, A., Genel, S., et al. 2015, Astron. Comput., 13, 12 [Google Scholar]
- Nelson, D., Pillepich, A., Springel, V., et al. 2018, MNRAS, 475, 624 [Google Scholar]
- Ogle, P. M., Lanz, L., Appleton, P. N., Helou, G., & Mazzarella, J. 2019, ApJS, 243, 14 [Google Scholar]
- O’Neil, K., Bothun, G., van Driel, W., & Monnier Ragaigne, D. 2004, A&A, 428, 823 [CrossRef] [EDP Sciences] [Google Scholar]
- Pakmor, R., Bauer, A., & Springel, V. 2011, MNRAS, 418, 1392 [NASA ADS] [CrossRef] [Google Scholar]
- Pallero, D., Gómez, F. A., Padilla, N. D., et al. 2022, MNRAS, 511, 3210 [NASA ADS] [CrossRef] [Google Scholar]
- Perez, J., Tissera, P., & Blaizot, J. 2009, MNRAS, 397, 748 [NASA ADS] [CrossRef] [Google Scholar]
- Pérez-Montaño, L. E., & Cervantes Sodi, B. 2019, MNRAS, 490, 3772 [CrossRef] [Google Scholar]
- Pérez-Montaño, L. E., Rodriguez-Gomez, V., Cervantes Sodi, B., et al. 2022, MNRAS, 514, 5840 [CrossRef] [Google Scholar]
- Pérez-Montaño, L. E., Cervantes Sodi, B., Rodriguez-Gomez, V., Zhu, Q., & Ogiya, G. 2024, MNRAS, 533, 93 [Google Scholar]
- Pillepich, A., Nelson, D., Hernquist, L., et al. 2018a, MNRAS, 475, 648 [Google Scholar]
- Pillepich, A., Springel, V., Nelson, D., et al. 2018b, MNRAS, 473, 4077 [Google Scholar]
- Planck Collaboration XIII. 2016, A&A, 594, A13 [NASA ADS] [CrossRef] [EDP Sciences] [Google Scholar]
- Quilley, L., & de Lapparent, V. 2022, A&A, 666, A170 [NASA ADS] [CrossRef] [EDP Sciences] [Google Scholar]
- Romeo, A. B., Agertz, O., & Renaud, F. 2020, MNRAS, 499, 5656 [NASA ADS] [CrossRef] [Google Scholar]
- Romeo, A. B., Agertz, O., & Renaud, F. 2023, MNRAS, 518, 1002 [Google Scholar]
- Rosas-Guevara, Y. M., Bower, R. G., McAlpine, S., Bonoli, S., & Tissera, P. B. 2019, MNRAS, 483, 2712 [NASA ADS] [CrossRef] [Google Scholar]
- Rosas-Guevara, Y., Bonoli, S., Puchwein, E., Dotti, M., & Contreras, S. 2025, A&A, 698, A20 [NASA ADS] [CrossRef] [EDP Sciences] [Google Scholar]
- Schiminovich, D., Wyder, T. K., Martin, D. C., et al. 2007, ApJS, 173, 315 [Google Scholar]
- Shibuya, T., Ouchi, M., & Harikane, Y. 2015, ApJS, 219, 15 [Google Scholar]
- Sijacki, D., Vogelsberger, M., Genel, S., et al. 2015, MNRAS, 452, 575 [NASA ADS] [CrossRef] [Google Scholar]
- Springel, V. 2010, MNRAS, 401, 791 [Google Scholar]
- Springel, V., White, S. D. M., Tormen, G., & Kauffmann, G. 2001, MNRAS, 328, 726 [Google Scholar]
- Springel, V., Pakmor, R., Pillepich, A., et al. 2018, MNRAS, 475, 676 [Google Scholar]
- Toomre, A., & Toomre, J. 1972, BAAS, 4, 214 [Google Scholar]
- Torrey, P., Vogelsberger, M., Hernquist, L., et al. 2018, MNRAS, 477, L16 [Google Scholar]
- Vogelsberger, M., Genel, S., Springel, V., et al. 2014a, Nature, 509, 177 [Google Scholar]
- Vogelsberger, M., Genel, S., Springel, V., et al. 2014b, MNRAS, 444, 1518 [Google Scholar]
- Vogelsberger, M., Marinacci, F., Torrey, P., et al. 2018, MNRAS, 474, 2073 [NASA ADS] [CrossRef] [Google Scholar]
- White, S. D. M., & Rees, M. J. 1978, MNRAS, 183, 341 [Google Scholar]
- Wuyts, S., Förster Schreiber, N. M., van der Wel, A., et al. 2011, ApJ, 742, 96 [NASA ADS] [CrossRef] [Google Scholar]
- Wyder, T. K., Martin, D. C., Schiminovich, D., et al. 2007, ApJS, 173, 293 [Google Scholar]
- Zhu, Q., Pérez-Montaño, L. E., Rodriguez-Gomez, V., et al. 2023, MNRAS, 523, 3991 [NASA ADS] [CrossRef] [Google Scholar]
All Figures
|
Fig. 1. Left: Stellar-mass distribution for all galaxies in TNG100. The dashed line shows the limit log at which we consider galaxies to be “massive”. The orange bars comprise the core of our study sample. Right: Satellite (yellow)–central (purple) separation for galaxies with log10M⋆/M⊙>1011. Massive galaxies are predominantly central, though a non-negligible fraction are satellites. |
| In the text | |
|
Fig. 2. Disk fraction for the TNG simulation measured with three different threshold criteria, |
| In the text | |
|
Fig. 3. Blended stellar and gas density of three massive disks in face-on (top row) and edge-on (bottom row) views, selected using a |
| In the text | |
|
Fig. 4. Fraction of satellites in our sample of supermassive galaxies. Disks and spheroids are shown as blue squares and red circles. The dashed black line shows the mean fraction of satellites within the massive regime. Errors correspond to one sigma binomial errors as stated in Cameron (2011), while the gray shaded area corresponds to three sigma binomial errors for the whole sample. We can see that although disks tend to have a mild tendency to be satellites, the fractions of satellites for disks and spheroids are comparable within one sigma. |
| In the text | |
|
Fig. 5. Left: Color (U−r) stellar mass diagram for all galaxies in the simulation. Blue and red dots show disk and spheroidal galaxies, with stars highlighting galaxies with log10M⋆≥11. We chose a threshold |
| In the text | |
|
Fig. 6. Relative merger importance for the growth in the stellar mass of massive galaxies. Solid and dashed blue lines correspond to disks selected with |
| In the text | |
|
Fig. 7. Number of mergers experienced by supermassive galaxies for |
| In the text | |
|
Fig. 8. Distribution of energy injected into the medium by AGN feedback thermally (quasar mode, left panels) and kinetically (radio mode, right panels) for disks (starred blue bars) and our CS (hashed red bars). Disk galaxies show marginally lower values of both types of energetic feedback (∼0.125 – ∼0.25 dex). |
| In the text | |
|
Fig. 9. Fate of supermassive disks (log10M⋆ 1011[M⊙]) selected at z = 0.5. The fraction of surviving disks (SD), the fraction of disks that merge with a more massive galaxy (MS), and the fraction of disks that transform to spheroidal throughout their history (SS) are shown here. Disks selected according to the thresholds |
| In the text | |
|
Fig. 10. SFR as a function of stellar mass (left) and absolute magnitude (right) for our simulated supermassive disk galaxies compared with observational samples. In the left panel, our galaxies are compared with the supermassive galaxy sample from Ogle et al. (2019) (orange crosses). In contrast, the right panel shows a comparison with the LSBGs from O’Neil et al. (2004). Most observational galaxies lie along the star-forming main sequence, whereas our simulated sample includes both star-forming and quiescent systems, highlighting their broader diversity in star formation activity. |
| In the text | |
|
Fig. 11. Bottom panels: Distribution of haloes versus stellar mass for the galaxies in our sample, using a threshold of |
| In the text | |
|
Fig. 12. Fraction of satellites in our sample of supermassive disks compared to the whole sample of massive spheroids. We can see that the fraction of supermassive disks as satellites is similar to their spheroidal counterpart. |
| In the text | |
|
Fig. 13. Examples of galaxies experiencing different formation pathways: a quiescent merging history (cyan), a disk that experienced mergers (red), a spheroidal galaxy with high rotational support (purple), and a spheroidal galaxy that rapidly transformed into disks after a gas-rich merger (brown). Colored arrows and stars highlight the time when the merger starts and ends. |
| In the text | |
Current usage metrics show cumulative count of Article Views (full-text article views including HTML views, PDF and ePub downloads, according to the available data) and Abstracts Views on Vision4Press platform.
Data correspond to usage on the plateform after 2015. The current usage metrics is available 48-96 hours after online publication and is updated daily on week days.
Initial download of the metrics may take a while.