Fig. 1.
Download original image
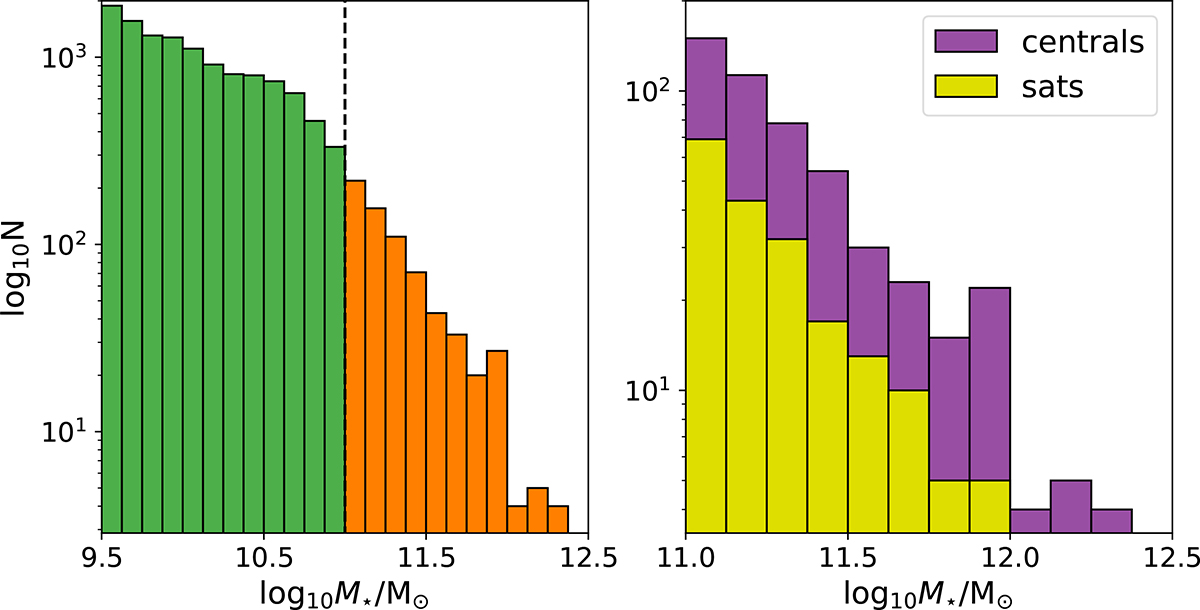
Left: Stellar-mass distribution for all galaxies in TNG100. The dashed line shows the limit log at which we consider galaxies to be “massive”. The orange bars comprise the core of our study sample. Right: Satellite (yellow)–central (purple) separation for galaxies with log10M⋆/M⊙>1011. Massive galaxies are predominantly central, though a non-negligible fraction are satellites.
Current usage metrics show cumulative count of Article Views (full-text article views including HTML views, PDF and ePub downloads, according to the available data) and Abstracts Views on Vision4Press platform.
Data correspond to usage on the plateform after 2015. The current usage metrics is available 48-96 hours after online publication and is updated daily on week days.
Initial download of the metrics may take a while.