Fig. 7.
Download original image
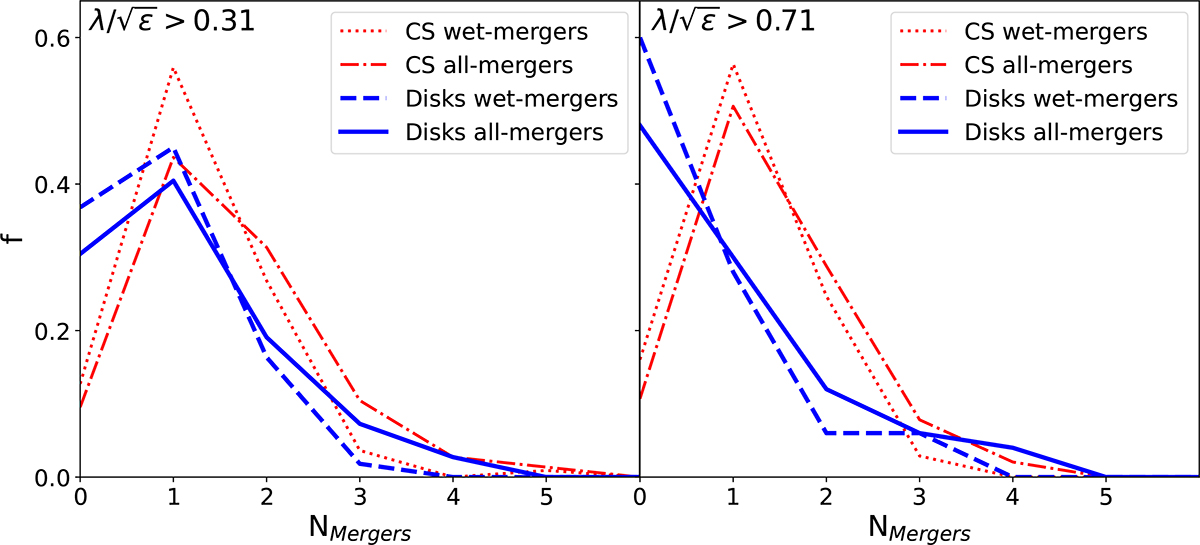
Number of mergers experienced by supermassive galaxies for ![]() (left panel) and 0.71 (right panel). Solid and dashed blue lines show the number of all and only gas-rich mergers experienced by disks. In contrast, dash-dotted and dotted red lines correspond to all and only gas-rich mergers experienced by our CS, respectively. Up to 45% of disks in our sample did not experience any merger at z<1, with fewer than 20% of disks in our sample experiencing two or more mergers. On the other hand, spheroidal galaxies have a very active merging history, with more than 70% of them experiencing one or two mergers at z<1.
(left panel) and 0.71 (right panel). Solid and dashed blue lines show the number of all and only gas-rich mergers experienced by disks. In contrast, dash-dotted and dotted red lines correspond to all and only gas-rich mergers experienced by our CS, respectively. Up to 45% of disks in our sample did not experience any merger at z<1, with fewer than 20% of disks in our sample experiencing two or more mergers. On the other hand, spheroidal galaxies have a very active merging history, with more than 70% of them experiencing one or two mergers at z<1.
Current usage metrics show cumulative count of Article Views (full-text article views including HTML views, PDF and ePub downloads, according to the available data) and Abstracts Views on Vision4Press platform.
Data correspond to usage on the plateform after 2015. The current usage metrics is available 48-96 hours after online publication and is updated daily on week days.
Initial download of the metrics may take a while.