Fig. 11.
Download original image
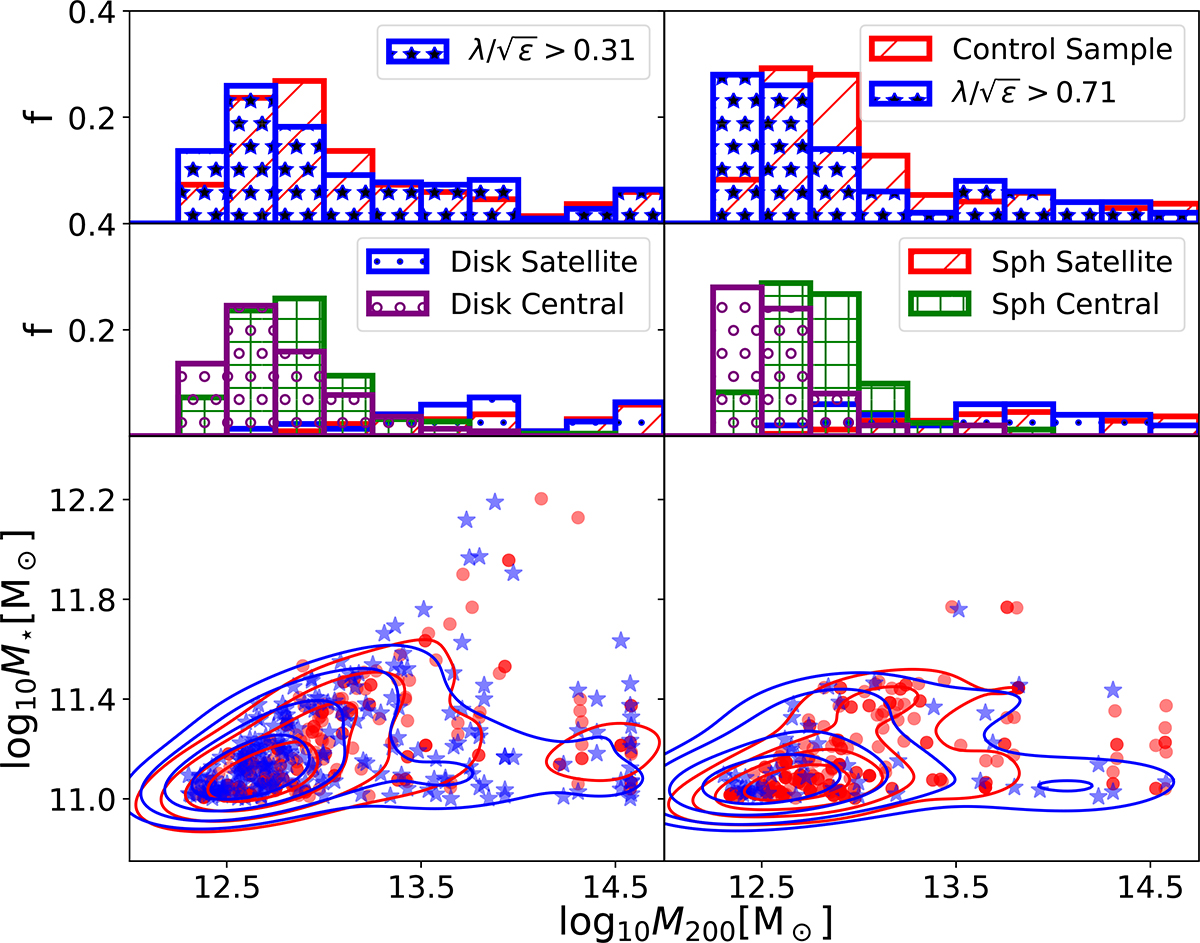
Bottom panels: Distribution of haloes versus stellar mass for the galaxies in our sample, using a threshold of ![]() (left) and 0.71 (right). Blue stars and red dots represent disks and spheroids (CS), respectively. Upper panels: Histograms showing the log10M200 mass distribution for disks (starred blue bars) and spheroids (dashed red bars). Middle panels: Distribution of central disks (purple), satellite disks (blue), central spheroids (green), and satellite spheroids (red). We can see that disk galaxies do not have any particular distribution in M200, showing even a slightly more extended distribution in halo mass than our CS and reaching up to the most massive clusters.
(left) and 0.71 (right). Blue stars and red dots represent disks and spheroids (CS), respectively. Upper panels: Histograms showing the log10M200 mass distribution for disks (starred blue bars) and spheroids (dashed red bars). Middle panels: Distribution of central disks (purple), satellite disks (blue), central spheroids (green), and satellite spheroids (red). We can see that disk galaxies do not have any particular distribution in M200, showing even a slightly more extended distribution in halo mass than our CS and reaching up to the most massive clusters.
Current usage metrics show cumulative count of Article Views (full-text article views including HTML views, PDF and ePub downloads, according to the available data) and Abstracts Views on Vision4Press platform.
Data correspond to usage on the plateform after 2015. The current usage metrics is available 48-96 hours after online publication and is updated daily on week days.
Initial download of the metrics may take a while.