Fig. 5.
Download original image
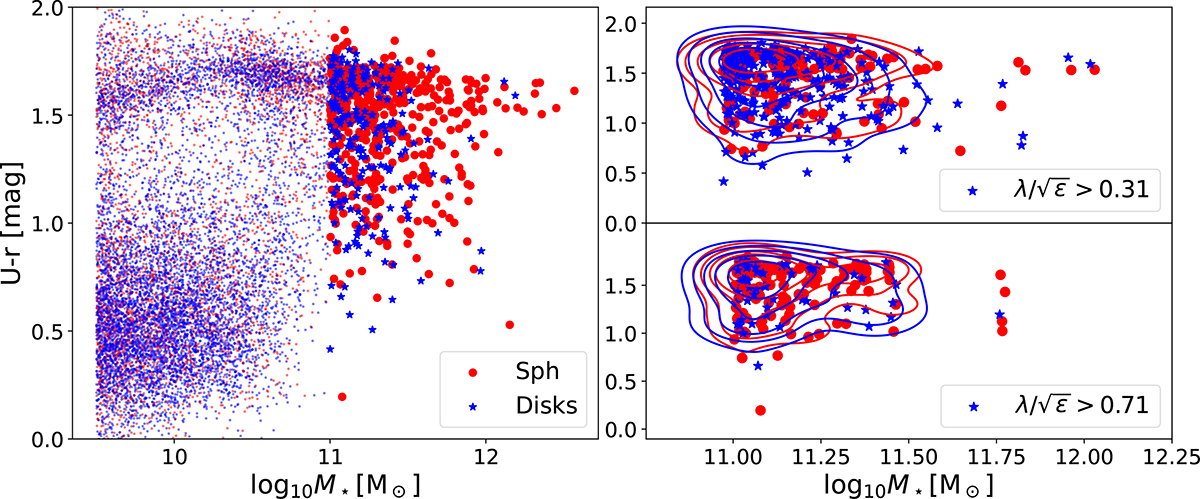
Left: Color (U−r) stellar mass diagram for all galaxies in the simulation. Blue and red dots show disk and spheroidal galaxies, with stars highlighting galaxies with log10M⋆≥11. We chose a threshold ![]() to split the disks and spheroids. Right: Selection of massive galaxies in our sample. The upper and lower panels use two different selection criteria:
to split the disks and spheroids. Right: Selection of massive galaxies in our sample. The upper and lower panels use two different selection criteria: ![]() and 0.71, respectively. Blue stars and red dots correspond to the disks and CSs associated with each sample, respectively. Contours are added for visualization purposes. Disk galaxies show a broad distribution in mass and color, but their density decreases dramatically toward higher stellar masses, as expected, populating the green valley preferentially for log10M⋆≥11[M⊙]. Spheroidal galaxies dominate the red population at any stellar mass but can also be found as blue galaxies at low stellar masses.
and 0.71, respectively. Blue stars and red dots correspond to the disks and CSs associated with each sample, respectively. Contours are added for visualization purposes. Disk galaxies show a broad distribution in mass and color, but their density decreases dramatically toward higher stellar masses, as expected, populating the green valley preferentially for log10M⋆≥11[M⊙]. Spheroidal galaxies dominate the red population at any stellar mass but can also be found as blue galaxies at low stellar masses.
Current usage metrics show cumulative count of Article Views (full-text article views including HTML views, PDF and ePub downloads, according to the available data) and Abstracts Views on Vision4Press platform.
Data correspond to usage on the plateform after 2015. The current usage metrics is available 48-96 hours after online publication and is updated daily on week days.
Initial download of the metrics may take a while.