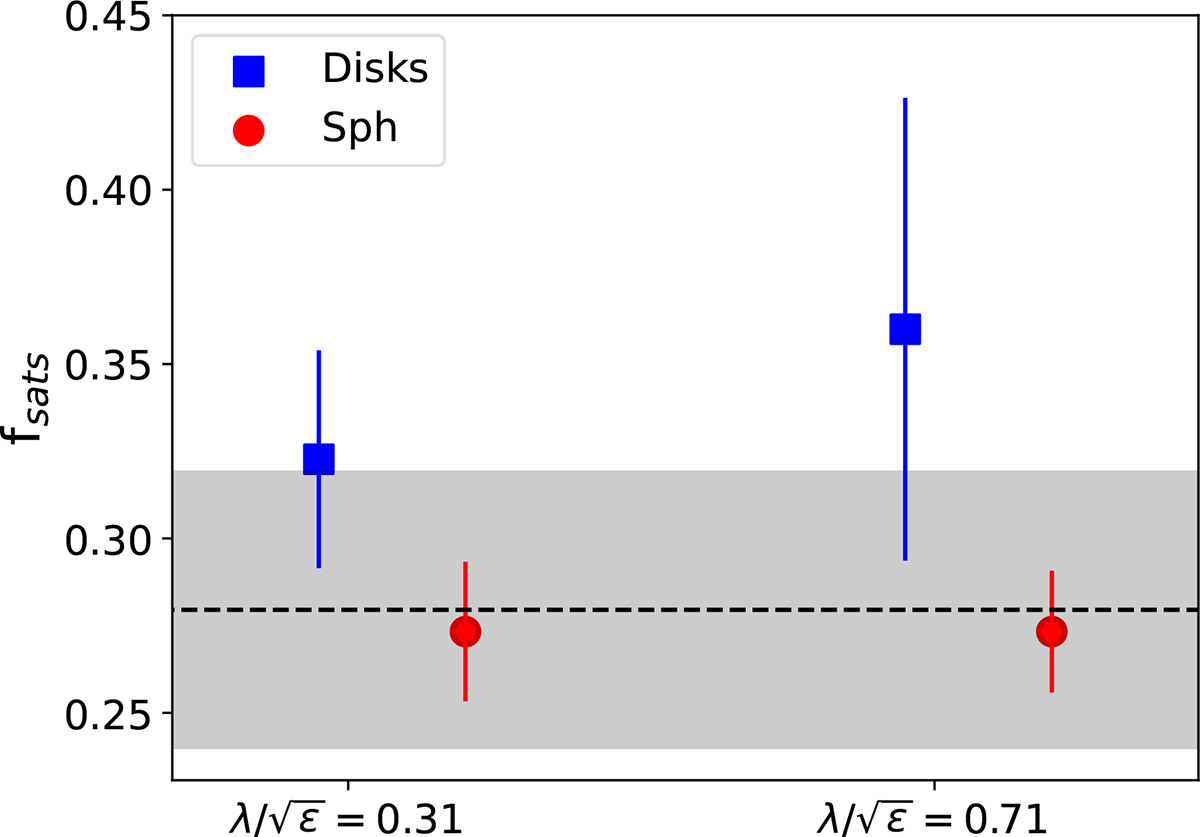
Fig. 4.
Download original image
Fraction of satellites in our sample of supermassive galaxies. Disks and spheroids are shown as blue squares and red circles. The dashed black line shows the mean fraction of satellites within the massive regime. Errors correspond to one sigma binomial errors as stated in Cameron (2011), while the gray shaded area corresponds to three sigma binomial errors for the whole sample. We can see that although disks tend to have a mild tendency to be satellites, the fractions of satellites for disks and spheroids are comparable within one sigma.
Current usage metrics show cumulative count of Article Views (full-text article views including HTML views, PDF and ePub downloads, according to the available data) and Abstracts Views on Vision4Press platform.
Data correspond to usage on the plateform after 2015. The current usage metrics is available 48-96 hours after online publication and is updated daily on week days.
Initial download of the metrics may take a while.